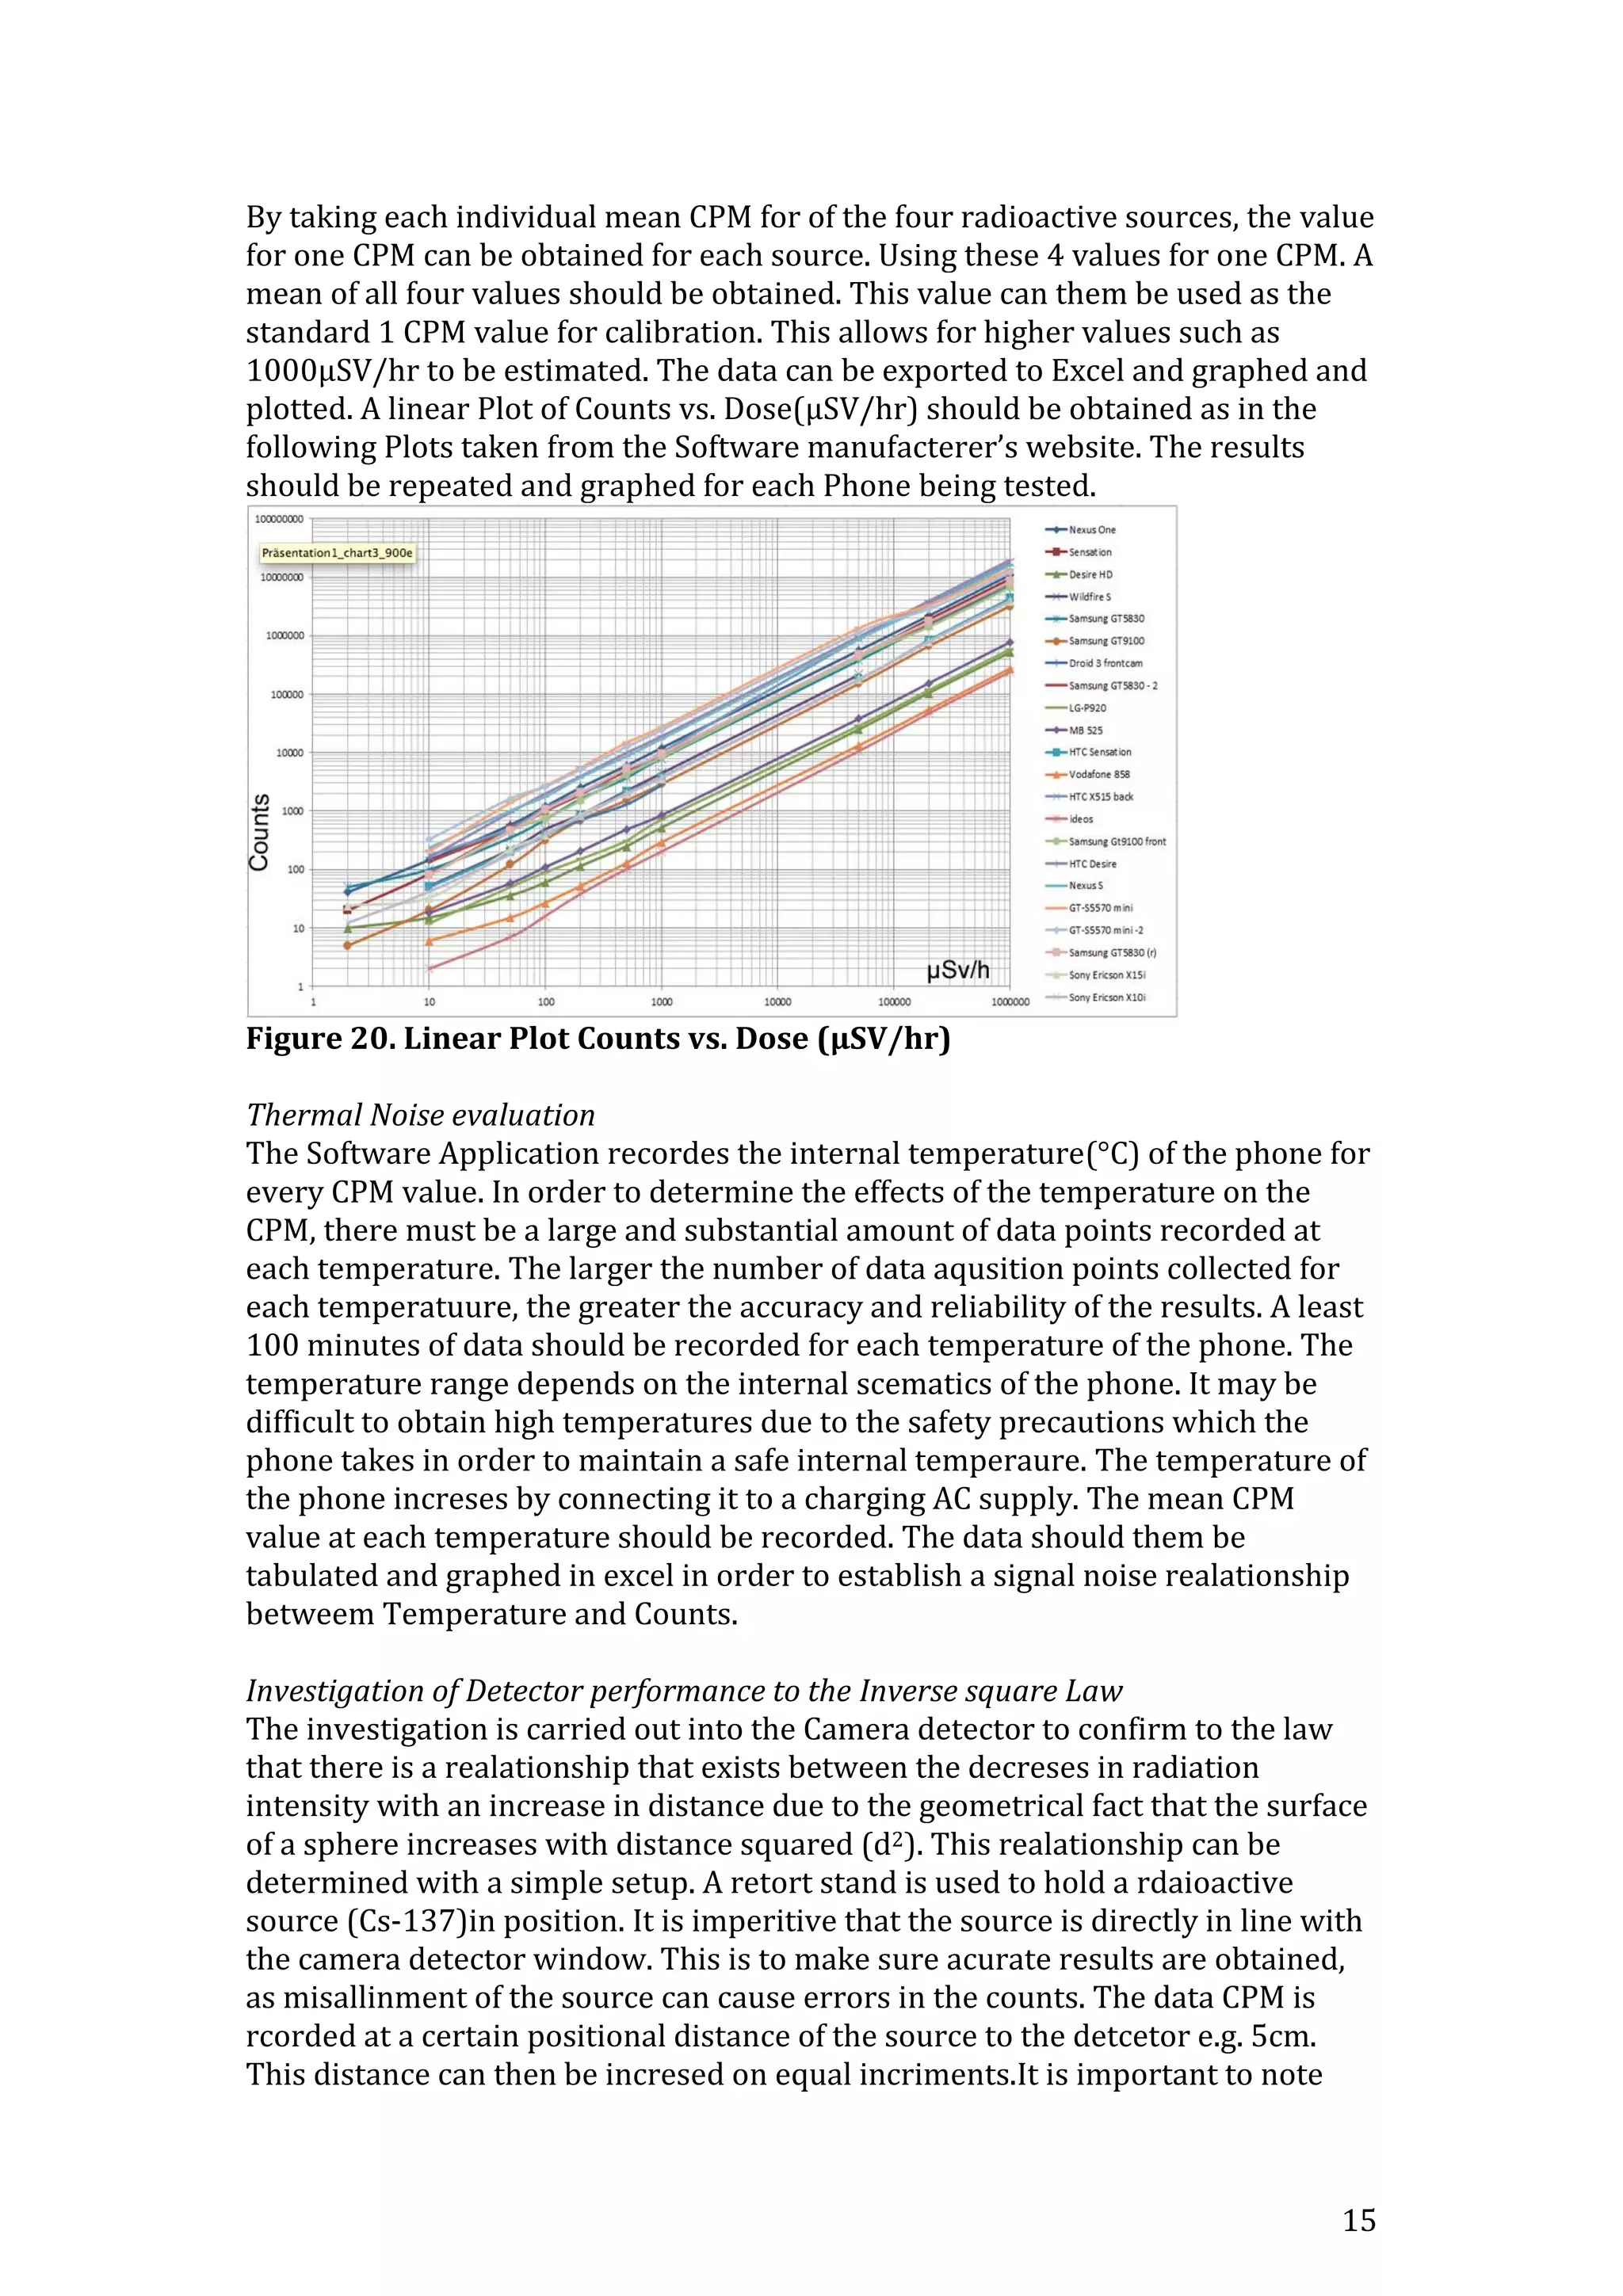
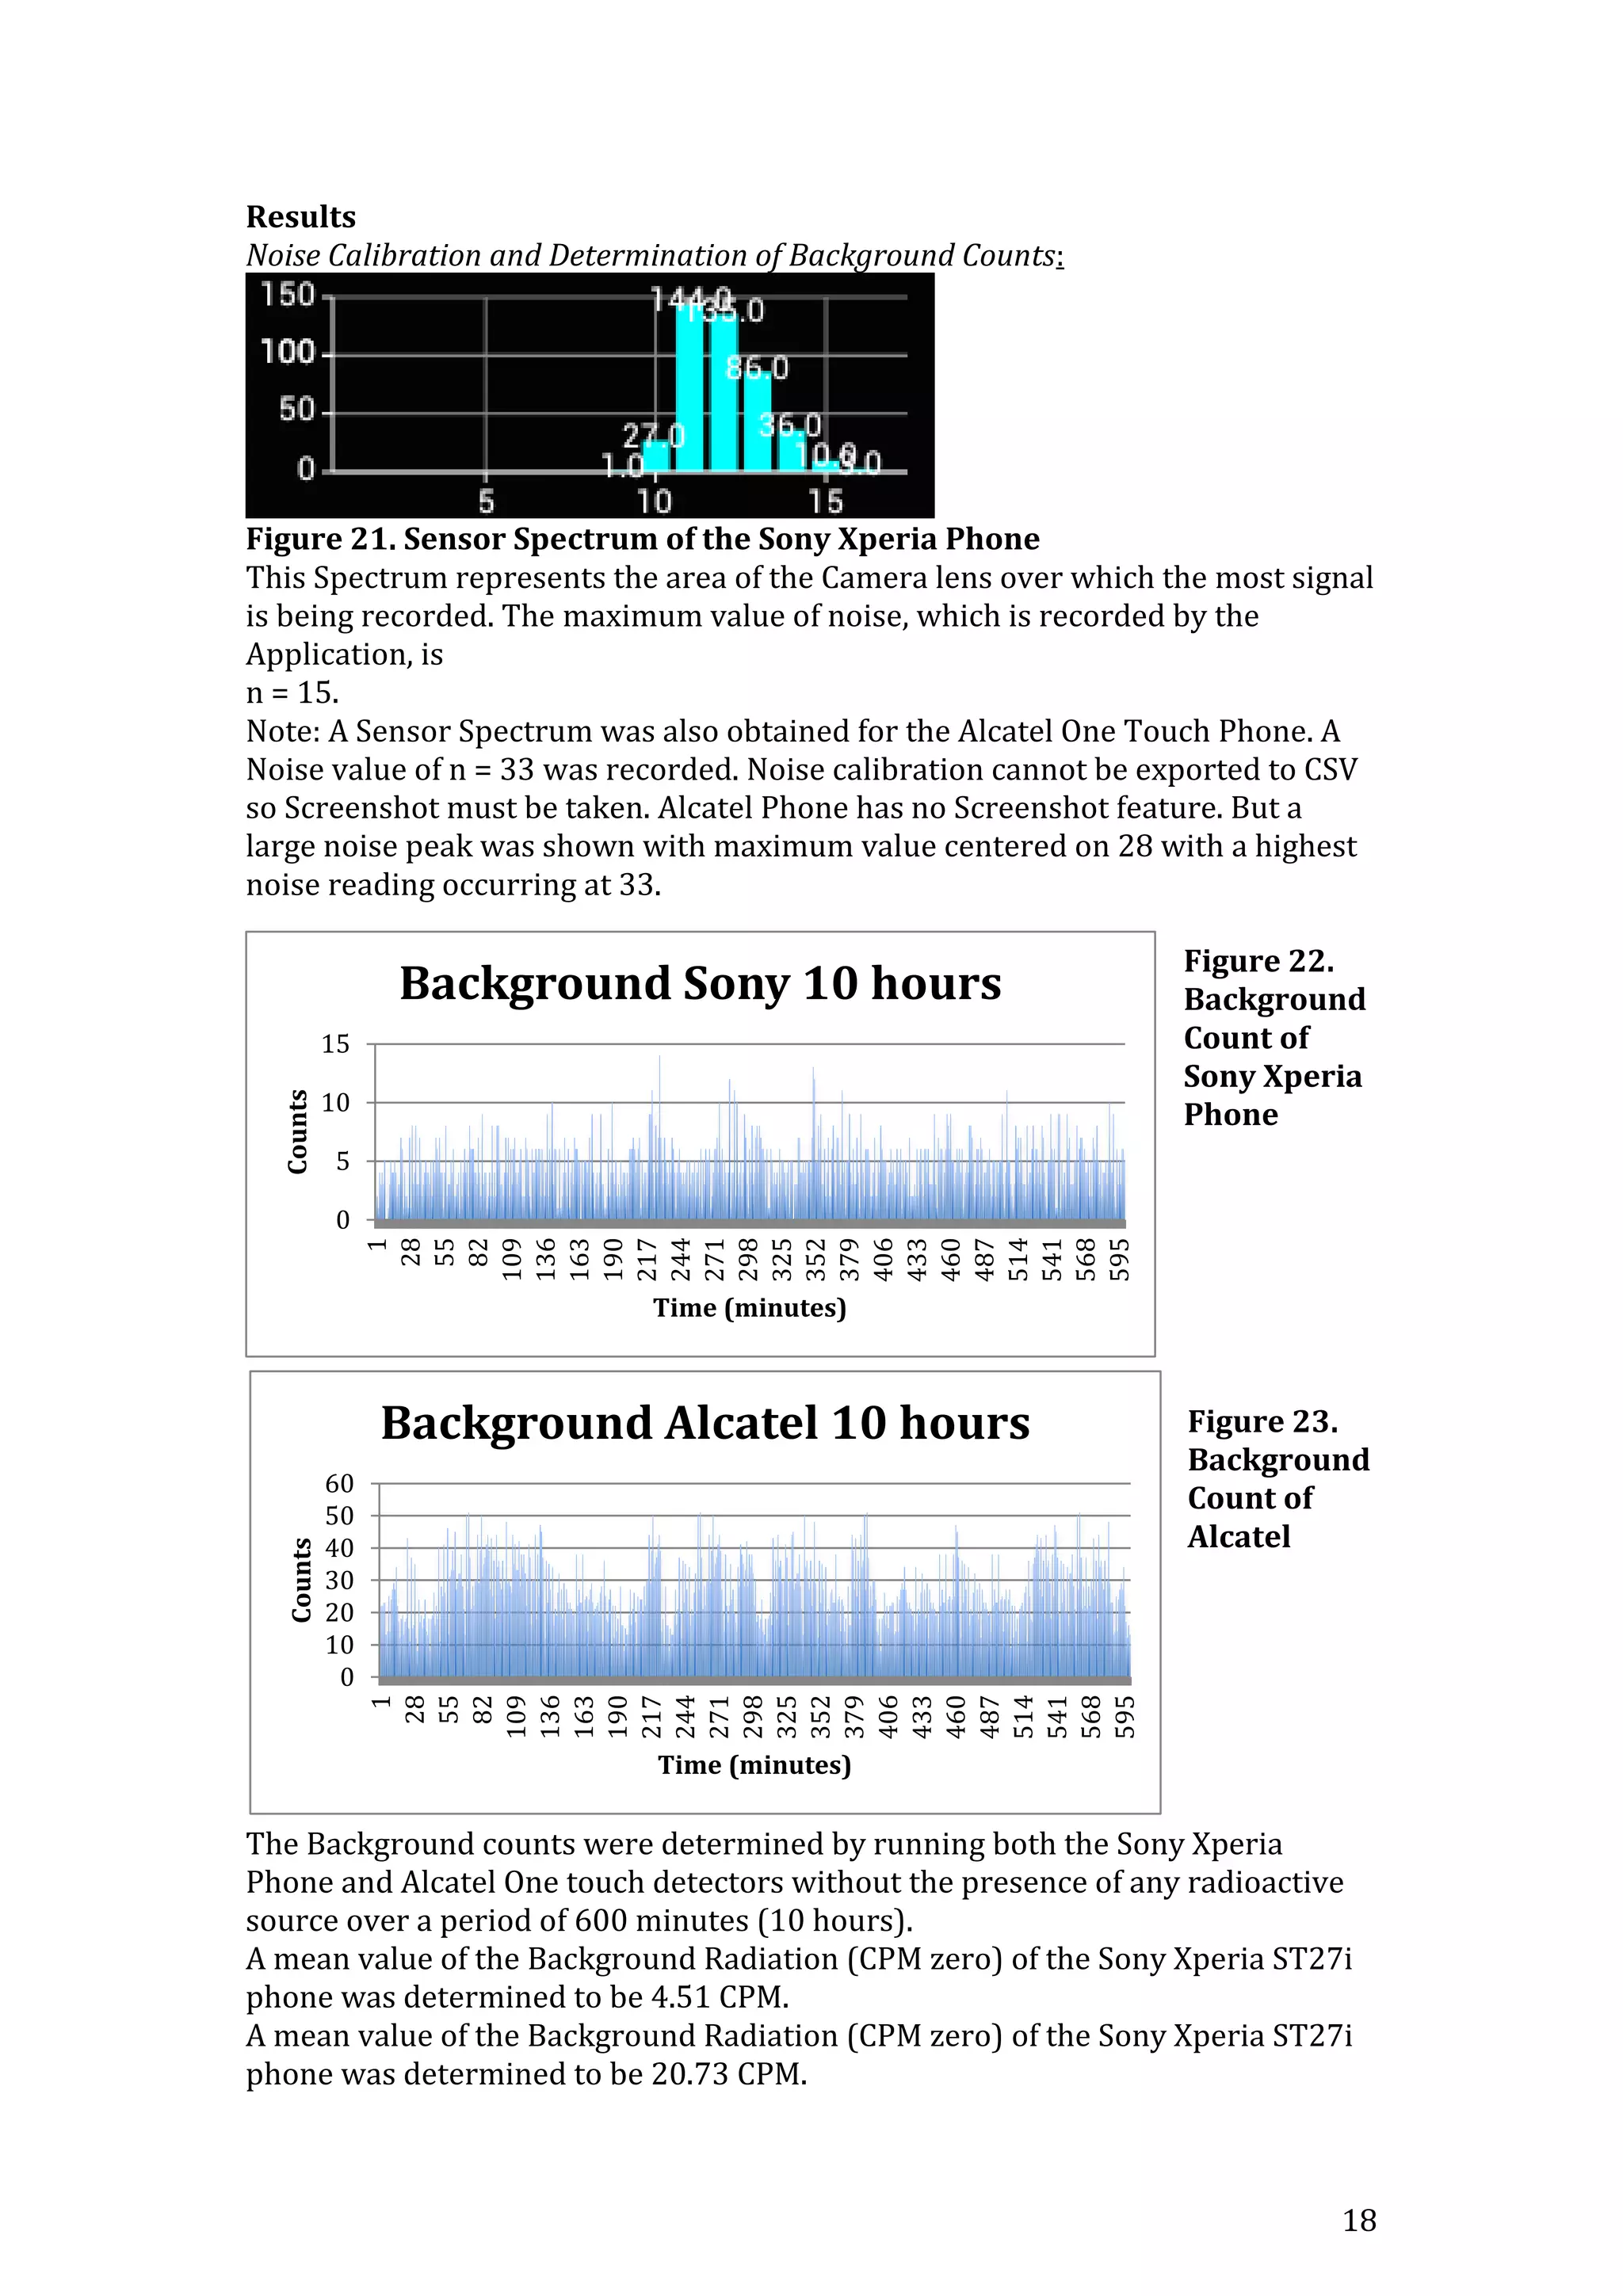
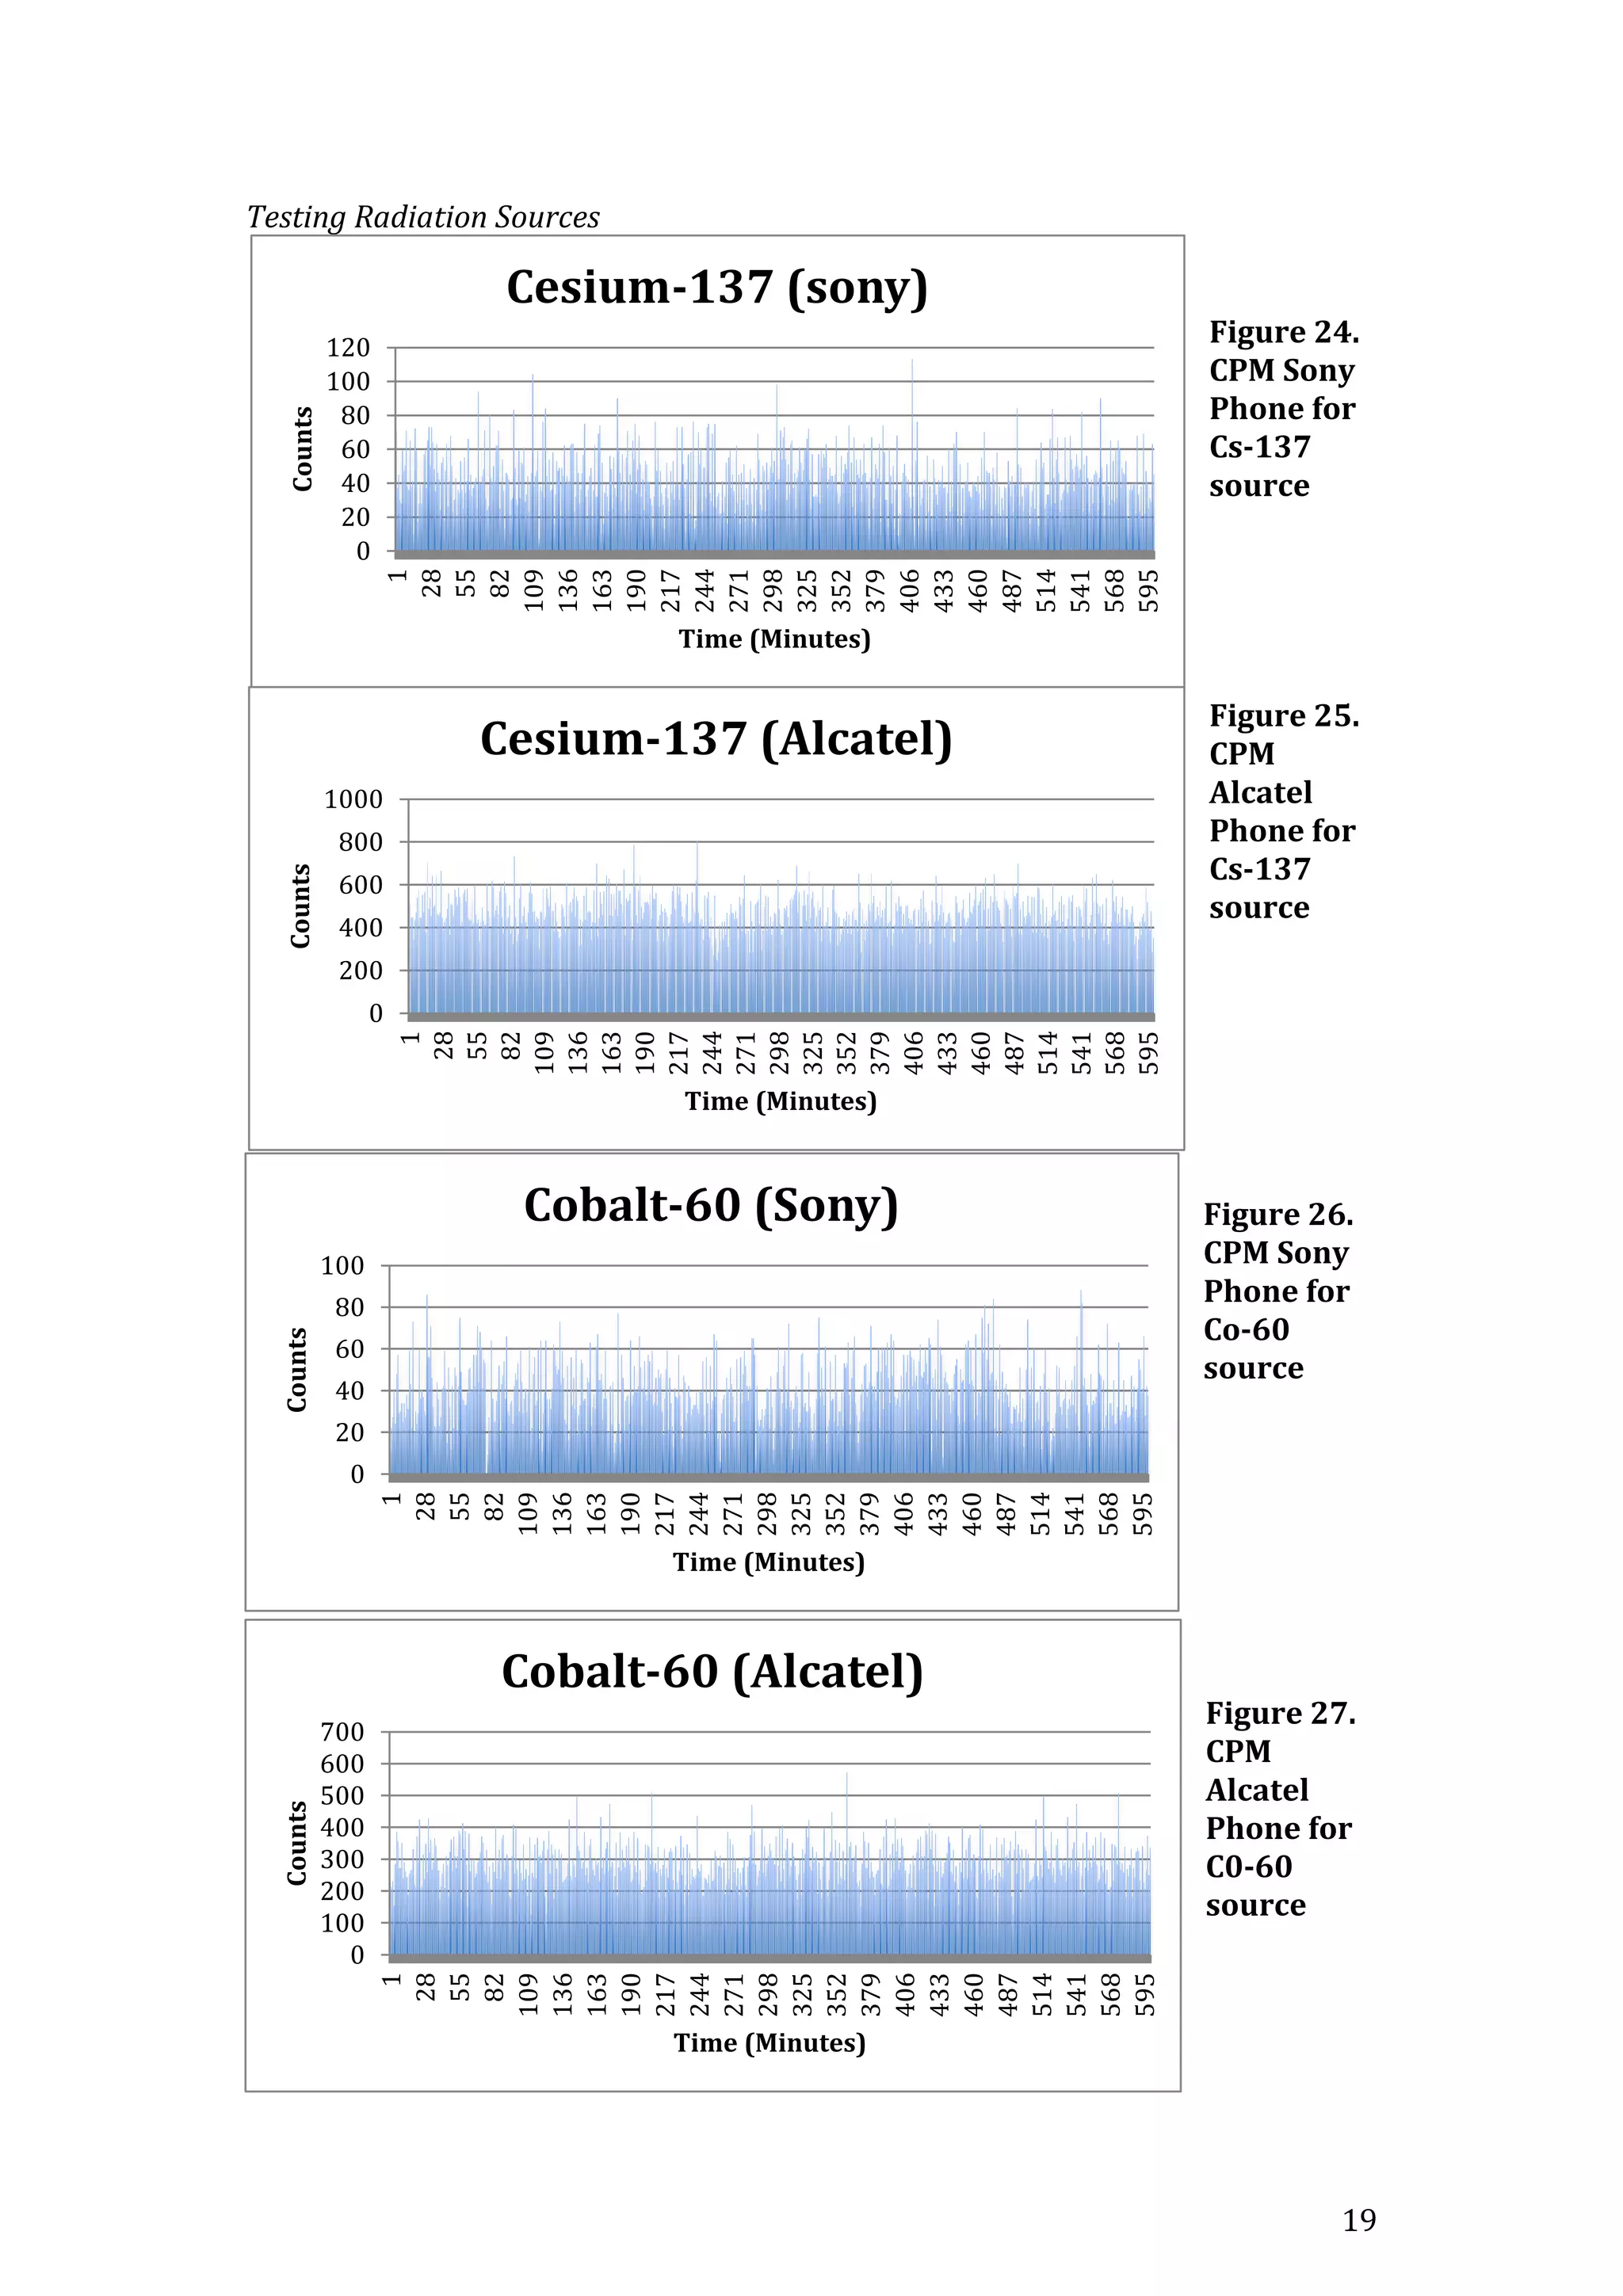
The document describes designing and testing a low-cost gamma radiation detector using a smartphone camera. The author tests various parameters of the smartphone detector such as calibration with radiation sources, thermal noise, distance effects, shielding effects, timing resolution, and efficiency compared to semiconductor detectors. Although not as efficient as professional detectors, the smartphone detector provides a low-cost option for estimating radiation dose that is more accessible than specialized equipment.
![1
Introduction
Radioactivity
Alpha, Beta and Gamma emission occur as a result of the decay of unstable nuclei
into less energetic nuclei. Respectively, these forms of emission consist of He4
nuclei, positron or electron, and high-energy photons. The types of decays that
occur depend on the instability of the nuclei. Some radioactive materials emit
more than one type of radiation. This is the case if the original radioactive parent
nuclei produce in decay chain radioactive daughter nuclei. The three forms of
radiation can de deflected and separated by a magnetic field.
Alpha decay occurs with the emission of a helium nucleus with two neutrons and
two protons, which results in the original nuclei being reduced by an atomic
number and mass of two and four respectively.
If a nuclei that has too many or too few neutrons with respect to the number of
protons can cause the nuclei to become unstable. If the nuclei are flooded with
neutrons, there is a probability that one will undergo a change into a proton with
the emission of an electron and an antineutrino. This electron has a high rate of
energy and is referred to as a beta particle. This process is called β- decay.
Likewise if there are too few protons present then there is a probability that one
will change into a neutron with the emission of a positron (which is a negative
electron) and a neutrino. This process is called β+ decay, however the positron is
very difficult to detect as it usually reacts with an electron and annihilates
producing gamma rays in the form of high-energy photons.
Gamma radiation occurs as a result of alpha and beta decay causing the nucleus
to be left in a high-energy state. The nucleus can emit photons to go from a
higher energy level to one of a lower energy level. These photons have very high
energies and are called gamma rays. (Siegbahn, 2012)
Figure 1. Radioactivity (Alpha, Beta and Gamma emission) [7]](https://image.slidesharecdn.com/finalyearproject-150728225946-lva1-app6892/75/Final-year-project-To-Design-and-Test-a-low-cost-Gamma-Ray-detector-6-2048.jpg)
![2
Decay of the Nucleus
The decay of a nucleus occurs randomly. In each infinitesimally event of time,
there is a probability of the unstable nuclei in the radioactive sample to decay.
Poisson statistics can be used to describe the number decays that occur in a
certain finite period of time.
𝑃𝑟𝑜𝑏𝑎𝑏𝑖𝑙𝑡𝑦 𝑜𝑓 𝑛𝑢𝑚𝑏𝑒𝑟 𝑜𝑓 𝑑𝑒𝑐𝑎𝑦𝑠 =
(𝜆𝑡) 𝑛
𝑒−𝜆𝑡
𝑛!
λ is the mean number of decays in a second; n is the probability of the number of
decays that occur in a time interval of t, n is a factorial.
The square root of the number of decays that occur is equal to the standard
deviation of the number of decays that occur throughout a certain time interval t.
The standard deviation is used to see if a measured set of counts deviates from
the overall mean of the results. This relationship between the mean and the
standard deviation can be used to gauge the number of counts that are needed to
achieve a certain level of accuracy. √𝜆 Represents the average number that
deviates from the mean λ, therefore the
√𝜆
𝜆
=
1
√𝜆
so the accuracy is increased as
the square root of the number of counts. (Wahlström, 1995)
Background Radiation
External sources have an impact on any recorded counts of a detector. It
represents a percentage of all recorded count events. These external background
counts can be as a result of sources including cosmic rays, or radioactive
elements that are airborne or found in close by building materials or even other
radioactive sources which are present close enough to be detected as they are
not correctly shielded with e.g. lead. Before any radiation counting experiment is
attempted, the background radiation of the surrounding area must first always
be recorded. The data measured can then be more accurately determined for
any source by subtracting the recorded value for the background radiation. The
recorded radiation values can never be fully accurately determined, as the count
events of radiation emitted by both radioactive sources and naturally occurring
background radiation are completely random events. This introduces a certain
level of uncertainty and noise into any data measurements. As Poisson statistics
can be used to determine the background radiation, it follows that the
uncertainty will be the square root of the mean number of background counts.
The total uncertainty of different sources is calculated by using the following
equation. 𝜎𝑡𝑜𝑡𝑎𝑙
2
= 𝜎𝑠𝑜𝑢𝑟𝑐𝑒 1
2
+𝜎𝑠𝑜𝑢𝑟𝑐𝑒 2
2
….
The effects of the uncertainty of noise caused by the background radiation
counts on the accuracy of recorded counts can be decreased by increasing the
count rate of the radioactive source in comparison to the count rate of the
background radiation. Other methods of decreasing the effects of added
background radiation include moving the source closer to the detector or
increasing the amount of radioactive source used to increase the count rate ratio
to background counts. Also the effects can be negated by using shielding such as
lead, around the source being measured to block out the effects of the
background counts. (Knoll, 2010) [5]](https://image.slidesharecdn.com/finalyearproject-150728225946-lva1-app6892/75/Final-year-project-To-Design-and-Test-a-low-cost-Gamma-Ray-detector-7-2048.jpg)
![3
Gamma Radiation
Gamma radiation is comprised of photons with very high energies. These
photons have wavelengths equivalent to less than 10-10 meters. Visible light has a
wavelength of approx. 10-6m. The emission of gamma particles comes before
alpha or beta emission, which leaves the nucleus in an excited state. A nucleus in
an excited state can go to a lower state by emitting a photon such as a gamma
ray. This is comparable to an emission of a photon and an electron changes from
a higher to a lower orbital. The nuclear energy state spacing occurs with energy
in the order of Millions of electron Volts (MeV). Electron orbital energies only
occur in the order of electron Volts (eV). The energy of a photon E = hf can be
substituted into the equation describing wavelength and frequency, c = fλ
λ =
c
f
=
hc
E
=
1240 MeV ∗ femtometers
1 MeV
= 1240 fm
In the visible light, a material absorbs gamma rays at a linear rate. An equal
fraction of the remaining light is absorbs for every unit of distance that the
radiation travels through the material. Such as if radiation is passed through
absorption plates made up of the same materials of equal thickness.
The half thickness of the material is the thickness at which it absorbs half the
gamma rays that pass through it. After the gamma rays pass through the first
absorbing plate, the intensity of the rays is halved. After it passes through a
second plate, then the rays half again leaving one quarter of the original
intensity. After it passes through a third plate, then the intensity is one eight.
This is an exponential decrease, which is described by the Lambert’s law.
I(X) = I0 e−μX
ln (
I
I0
) = −μX
μ is the coefficient of linear absorption.
The half thickness of a material is given by the following equation.
I (𝑋1
2
) = 0.5 I0 = I0e
−μ𝑋1
2
𝑋1
2
=
−ln(1 2)⁄
μ
=
0.693
μ
Gamma rays can be absorbed by a number of ways including pair production at
high energies, Compton effect at medium energies and the photoelectric effect at
very low energies. The μ (the coefficient of linear absorption) is calculated by a
combination sum of all three processes. (Lilley, 2013) [5]
Figure2. Compton Scattering, Pair Production, Photoelectric effect
[8],[9],[10]](https://image.slidesharecdn.com/finalyearproject-150728225946-lva1-app6892/75/Final-year-project-To-Design-and-Test-a-low-cost-Gamma-Ray-detector-8-2048.jpg)
![4
μ = τ(Photoelectric) + 𝜎(𝐶𝑜𝑚𝑝𝑡𝑜𝑛) + 𝐾(𝑃𝑎𝑖𝑟 𝑝𝑟𝑜𝑑𝑢𝑐𝑡𝑖𝑜𝑛)
A number of different factors also decrease the beam energy such as Bragg
scattering, Rayleigh scattering, Photodisintegration and nuclear resonance
scattering.
The absorption of Gamma by the photoelectric effect occurs as a result of gamma
rays ionising an atom. The density of the interacted material is proportional to τ
the rate of absorption by photoelectric effect. This increases with atomic
number,
𝜏 = 0.0089𝜌
𝑧4.1
𝐴
𝜆 𝑛
ρ is the materials density, the atomic number and mass are Z and A respectively,
λ is the wavelength and n is 3 for Carbon, Nitrogen and Oxygen and 2.85 for the
rest of the elements that have an atomic no less than Fe (Iron). The greater the
wavelength, the stronger the photoelectric effect due to lesser energetic gamma
rays. The photoelectric effect greatly increases with atomic number. (Gilmore,
2011) [5]
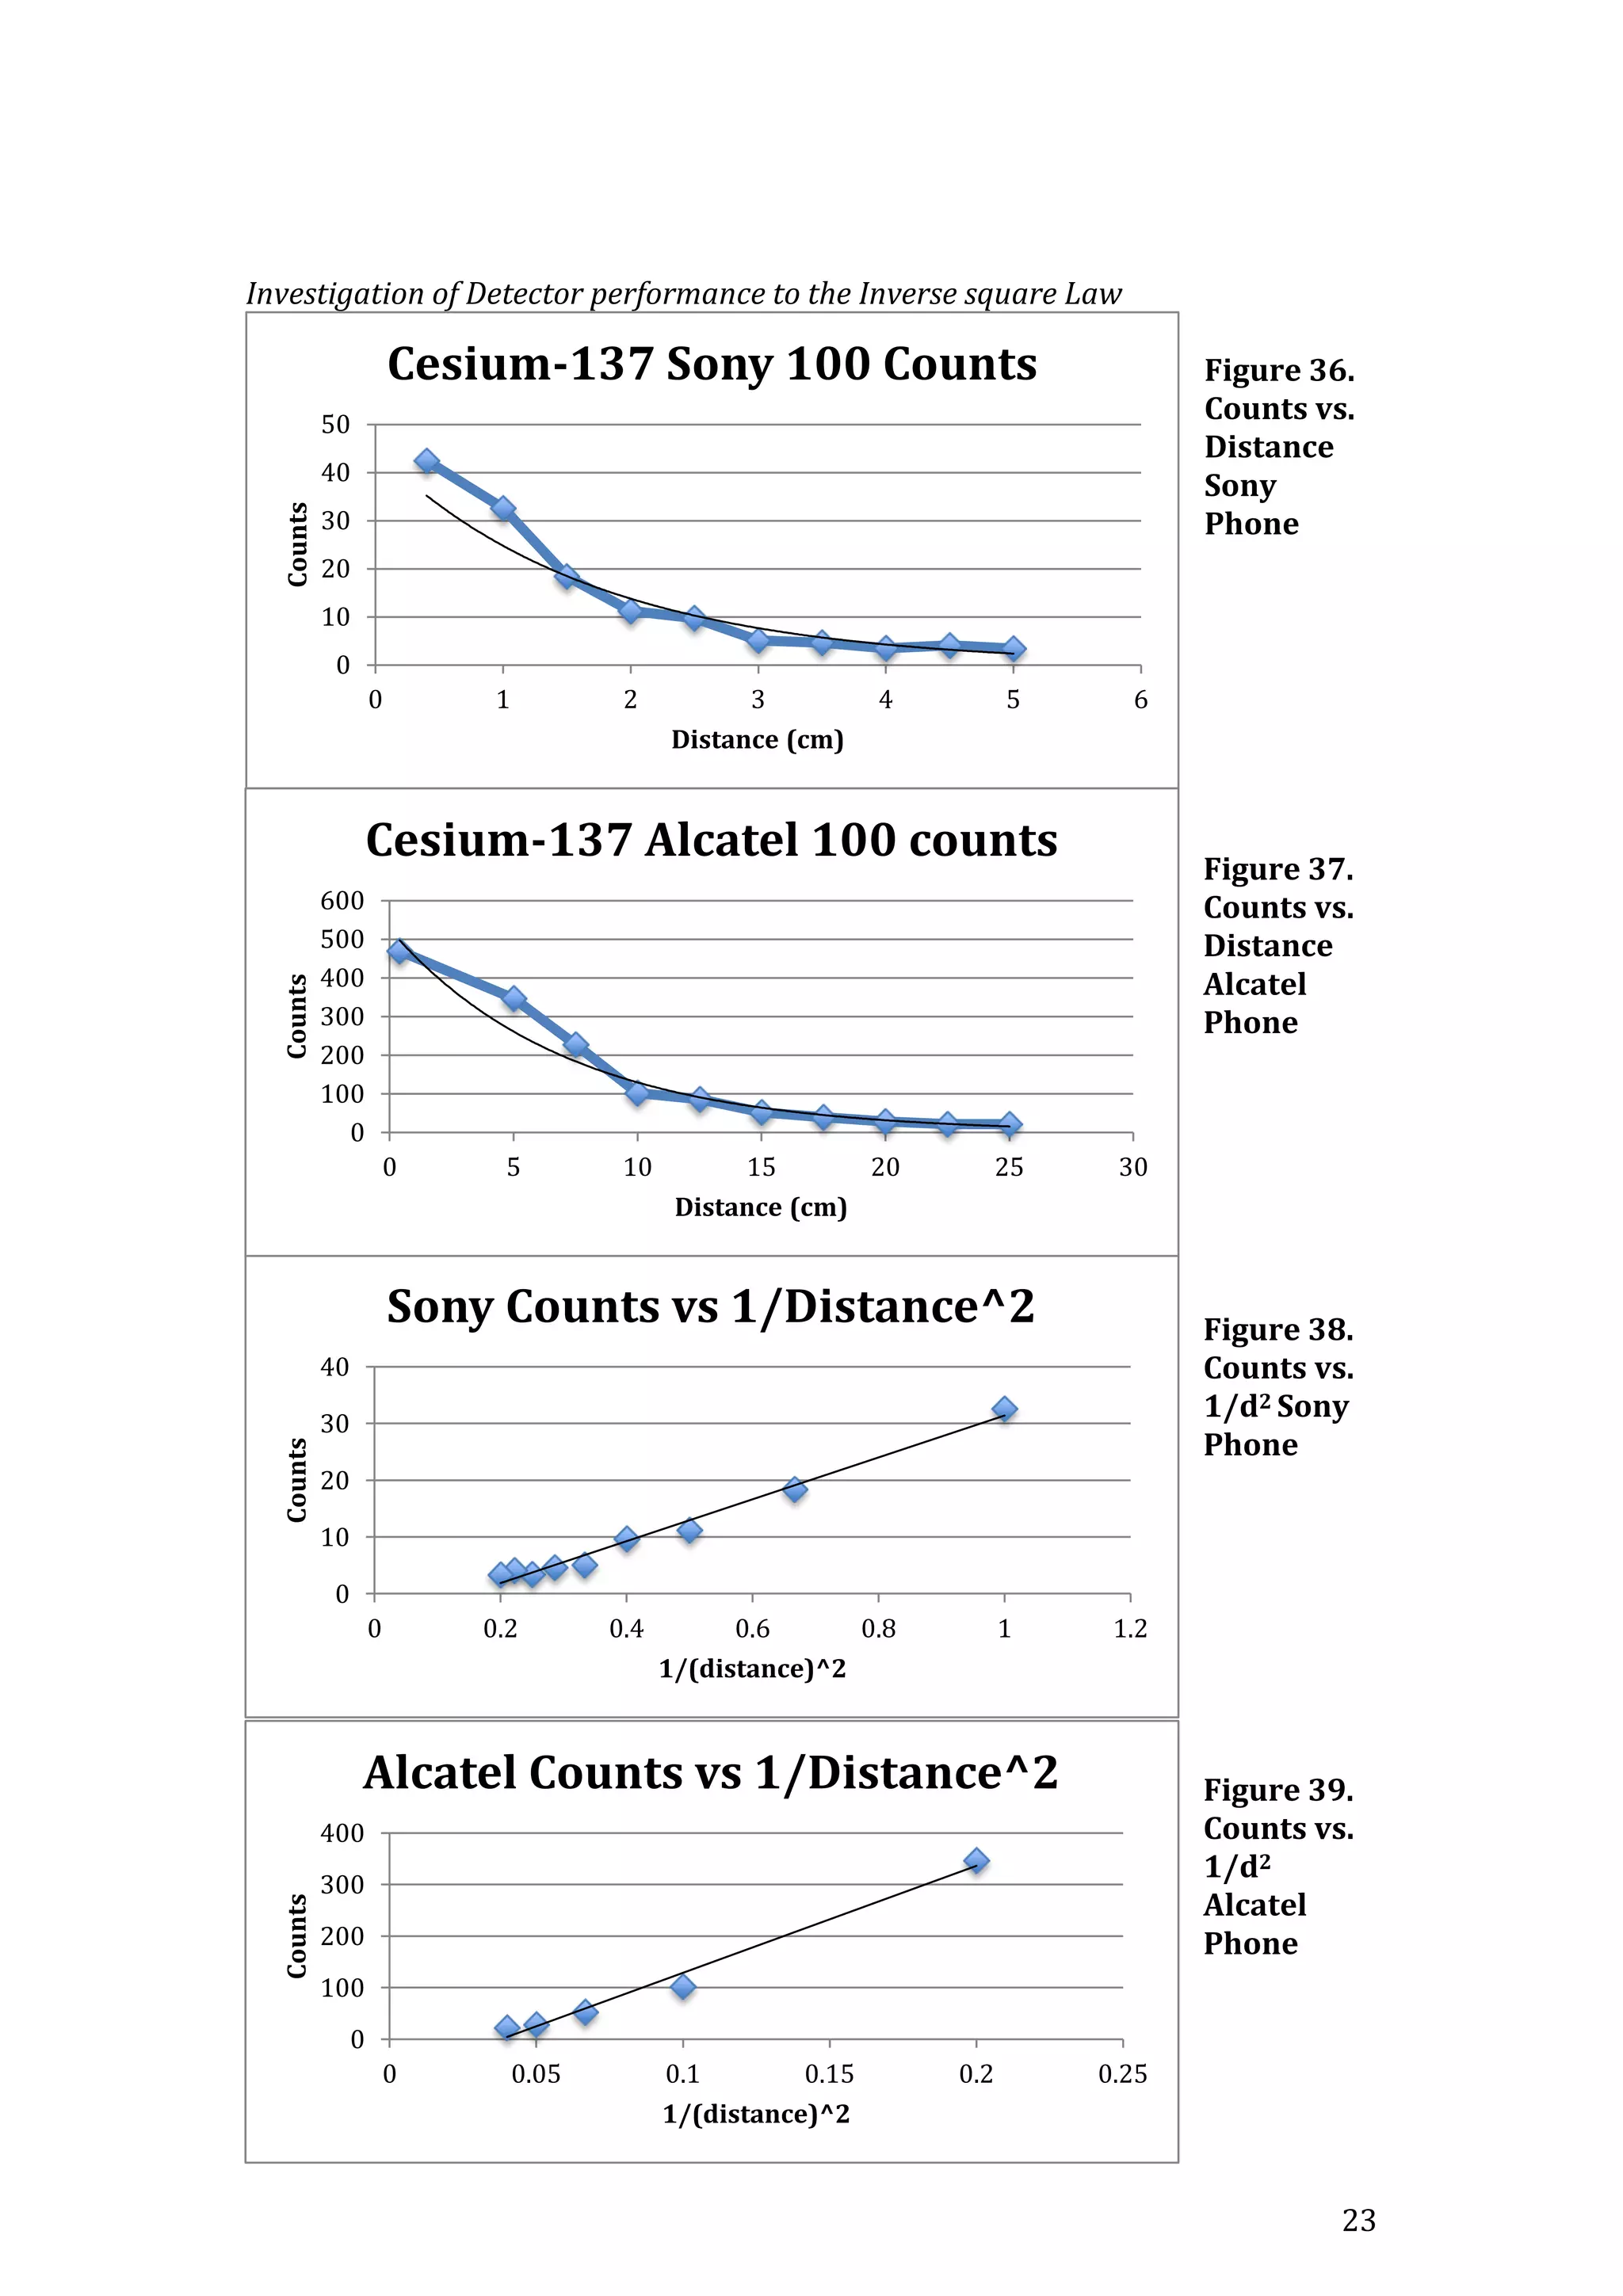
The inverse Square Law
The direction is random of particles that are emitted during nuclei decay. So the
emission of the particles is evenly distributed in every direction if the absorption
is neglected in a radioactive source. If they are centered on the source, a set of
concentric spherical surfaces surrounding it and none of the particles are
absorbed, then each of the spheres has more of a surface area then the inner
sphere. As a result there is a higher density of radiation nearer the source. The
surface area of a sphere is
𝑠 = 4𝜋𝑑2
Even if absorption radiation is not present, the radiation intensity levels
decrease as a reciprocal of distance from the source squared. This is the inverse
square law. (Bloor, 2013)
The fraction of radiation totally emitted from a source that is placed near the
detector window of a Geiger molar counter and detected in the direction of the
window, is given by the geometry G factor.
𝐺 =
𝑆′
4𝜋𝑑2
A Geiger molar counter has a round window with a radius r, and an area of πr2,
as long as the source is not placed directly at the detector window. (Spiers, 1941)
𝐺 =
𝜋𝑟2
4𝜋𝑑2
=
𝑟2
4𝑑2
When the detector is moved away from the radiation source, there is an increase
in the total spherical surface area of the window by a distance squared. However
the enclosed area of S’ stays the same throughout. The inverse square law results
in a drop off in intensity of radiation levels as the particles spread away from the
source. If the sources are moved away from the detector at different distances, or
likewise the geometry size of the detector window is changed, then the G factor
must be used to compare any results. The benefits of the inverse square law are
that it can be implemented to change the count rate if it is too low by simple
moving the source closer to the detector window, or vice versa if it is too high.](https://image.slidesharecdn.com/finalyearproject-150728225946-lva1-app6892/75/Final-year-project-To-Design-and-Test-a-low-cost-Gamma-Ray-detector-9-2048.jpg)
![5
Figure 3. The Inverse Square Law [11]
Detectors
There are a wide variety of Semiconductor detectors available fro the detection
of ionising radiation. They usually implement a semiconductor such as
germanium or even silicon to detect the absorption of photons.
Photons are not directly in the form of ionising radiation particles e.g. gamma
particles. However the energy of the photons can be converted into particles
charged with kinetic energy. The energy of these charged particles are then
measured to obtain the energy of the gamma particles.(Bushberg and Boone,
2011)
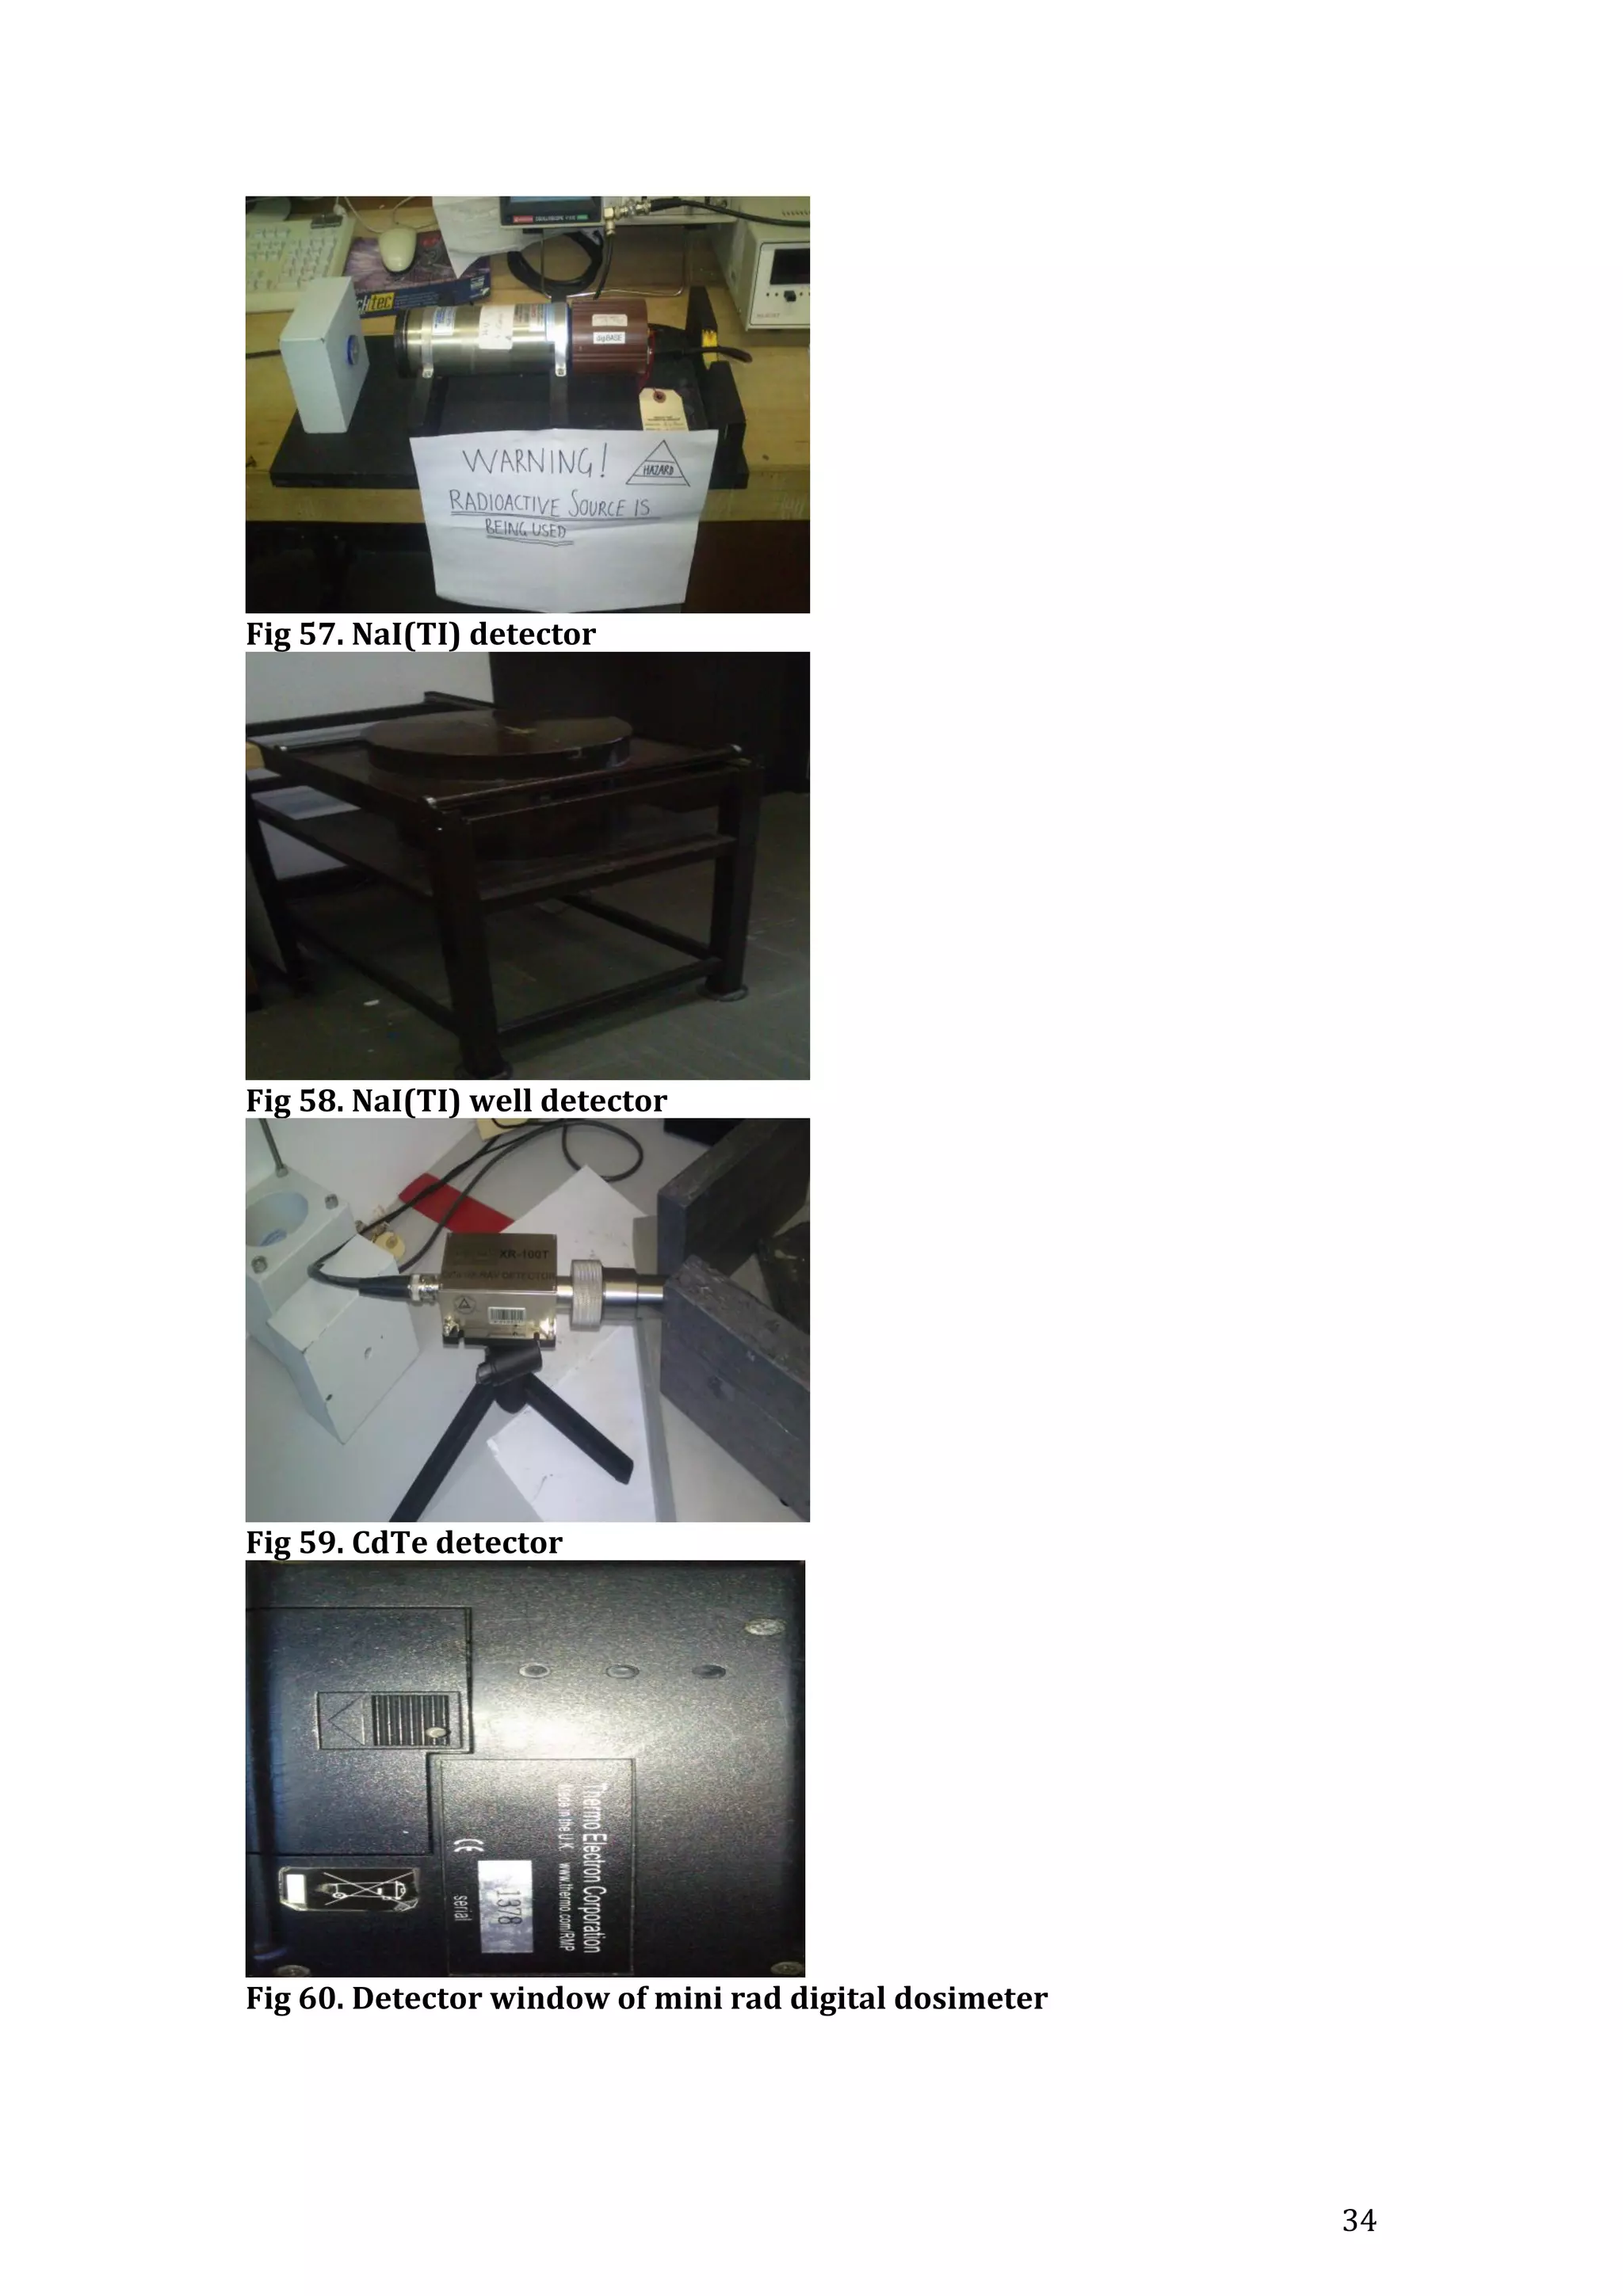
Scintillation detectors : A gamma ray interacts with the scintillator e.g. Thallium-
activated sodium iodide (NaI(TI)). This produces a pulse of light that is
converted into an electrical pulse by a Photo Multiplier Tube (PMT). The PMT
consists of a photocathode, a focusing electrode and dynodes that multiply the
number of electrons, which strike it.
There are two types of scintillation detectors that will be used. A well detector
has a large 3”x 3” detector window. Shielding which allows it to obtain more
accurate results surrounds the detector. The second type is just a stand alone
(NaI(TI)) detector which has the PMT built into its body. The well scintillation
detectors have a higher efficiency at recording the decays of a radioactive source
due to the shielding. [1]
Another type of detector is a Cadmium Telluride (CdTe) detector. This is a
thermoelectrically cooled X-ray detector, which used CdTe diodes in a
preamplifier. The Gamma rays interact with the CdTe atoms in the preamplifier
to create on average one electron hole pair for every 4.43KeV it detects as being
lost in the CdTe. The efficiency of the detector to stop incoming radiation
increases by increasing the thickness of the CdTe. [4]
Figure 4. (NaI(TI)) Figure 5. (NaI(TI)) Well Figure 6. CdTe](https://image.slidesharecdn.com/finalyearproject-150728225946-lva1-app6892/75/Final-year-project-To-Design-and-Test-a-low-cost-Gamma-Ray-detector-10-2048.jpg)
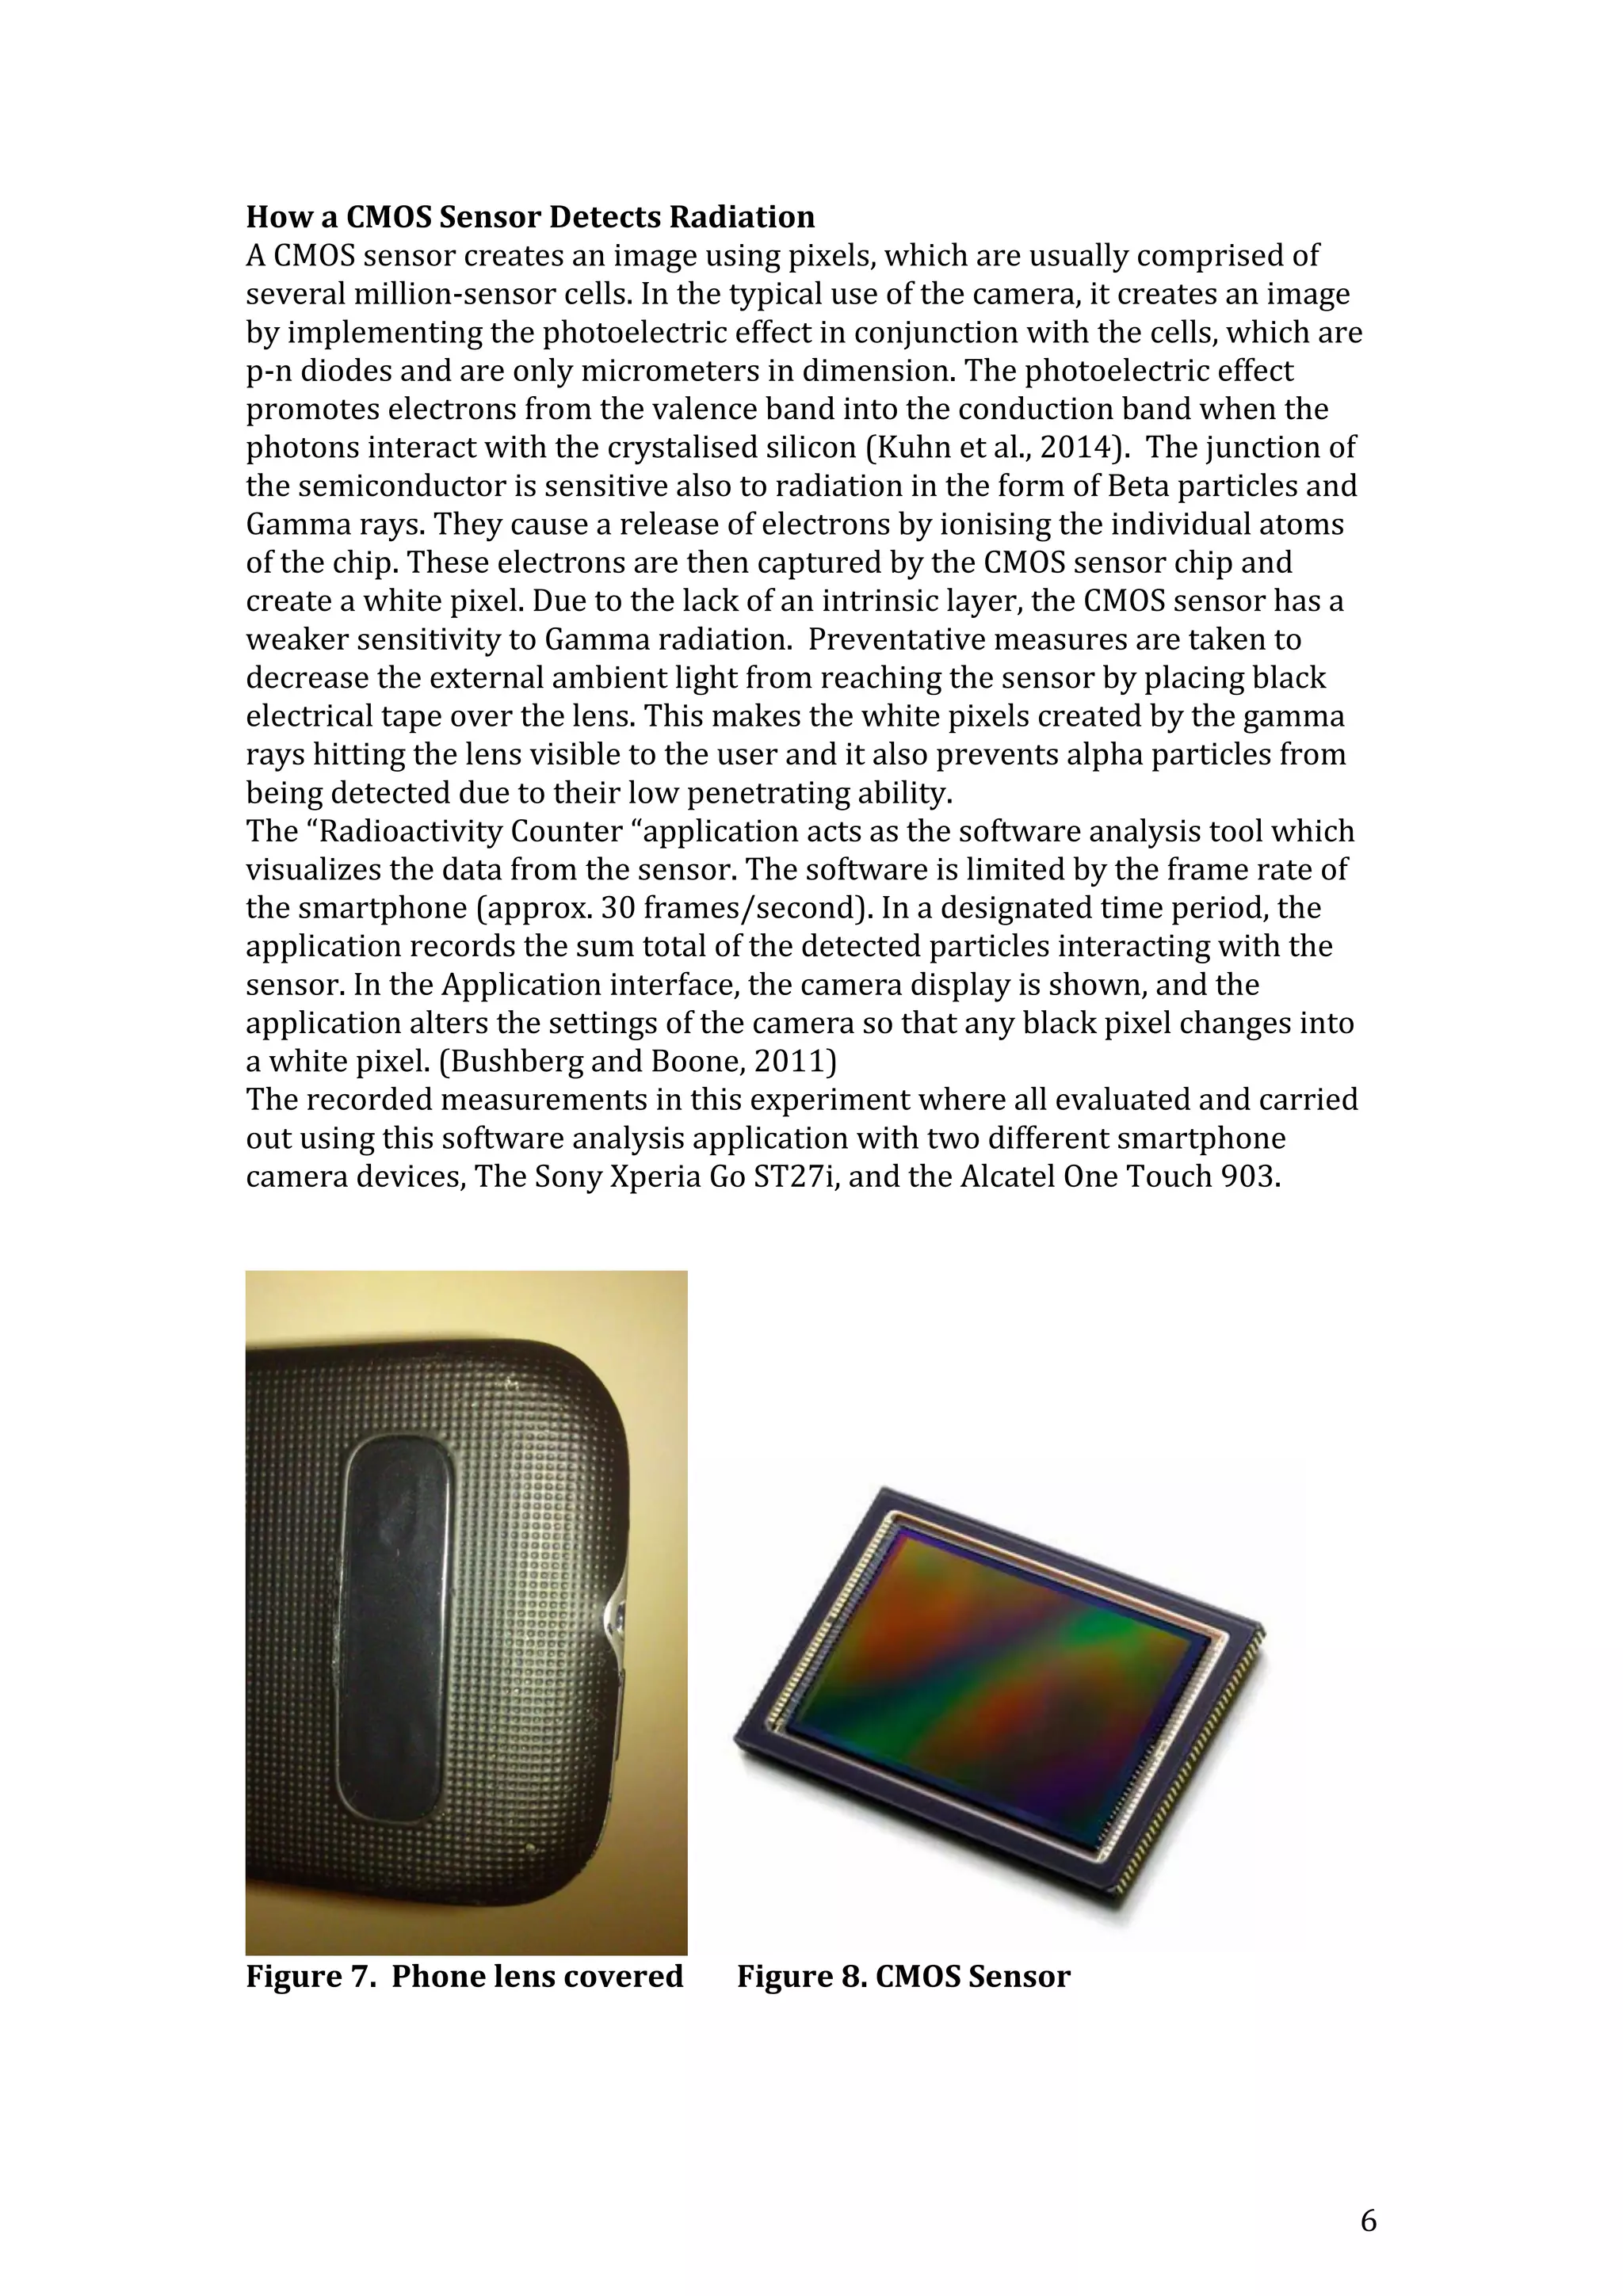
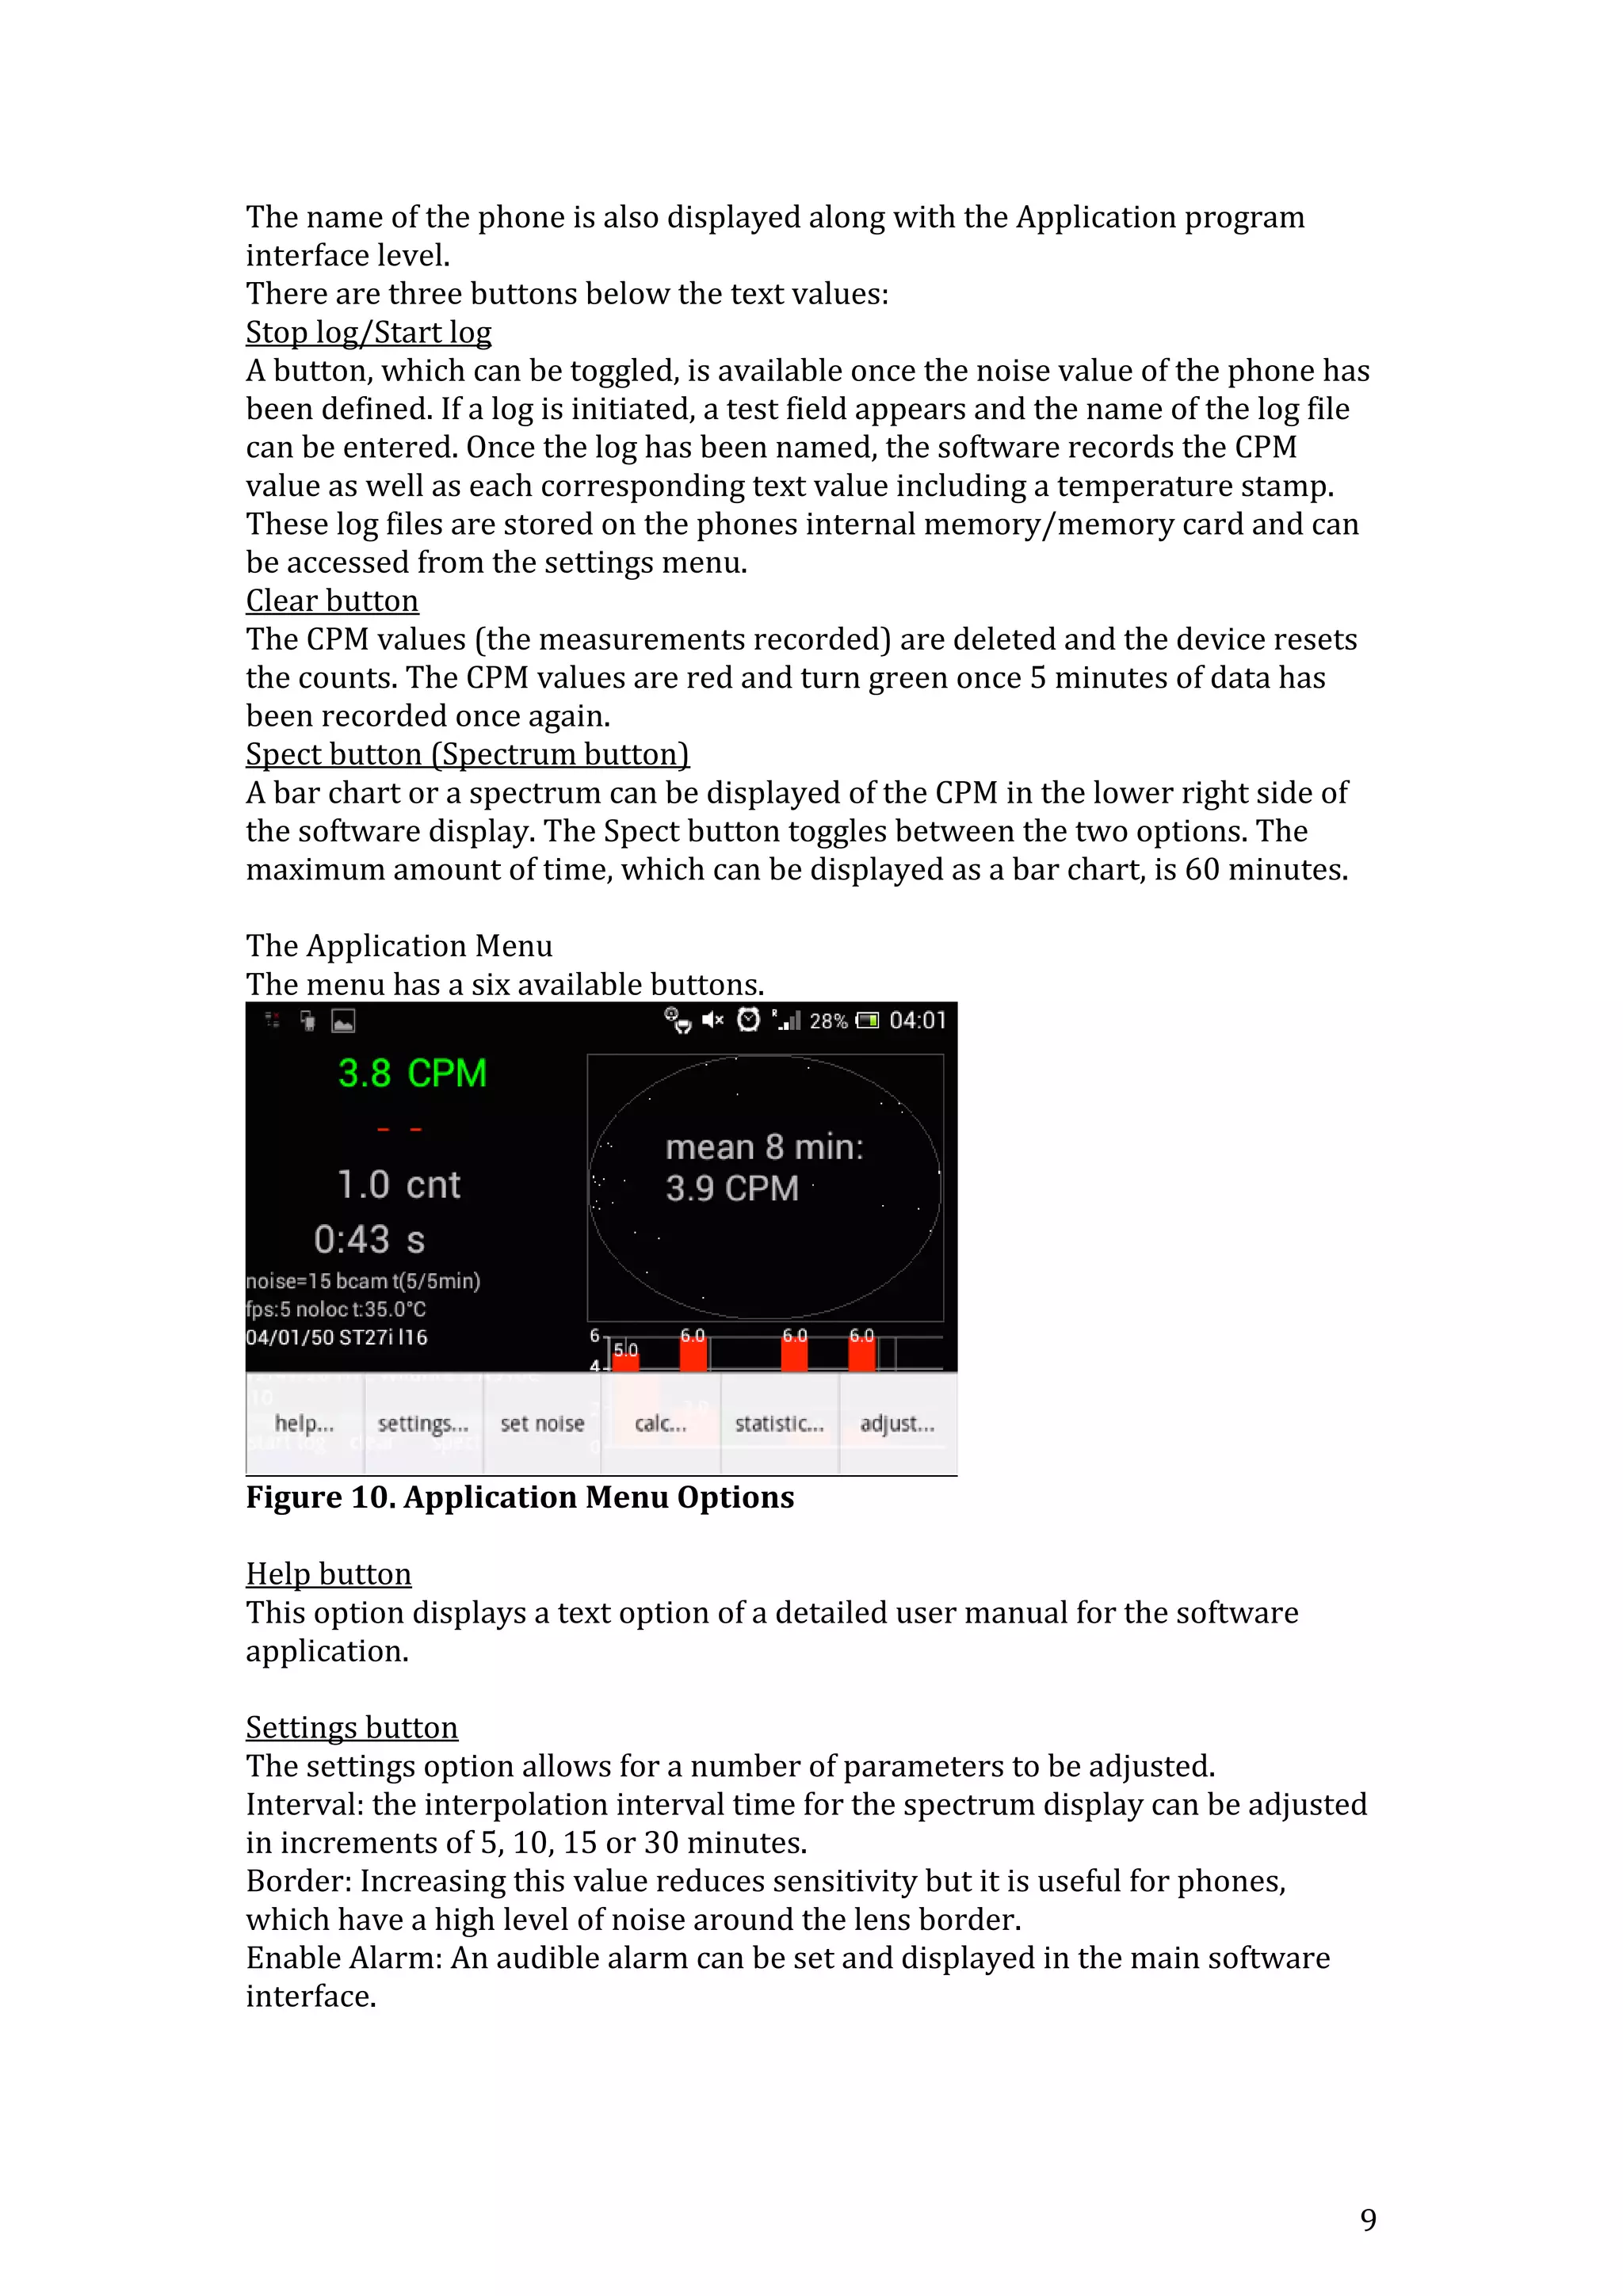
![8
Method
Detector Application Design and layout
Figure 9. Software Analysis Application Layout
The upper right portion of the application displays the image of the camera. This
should be displaying black when covered with black tape. When the gamma rays
interact with the sensor chip, white pixels appear. The application only has the
ability to display a maximum value of 200 white ray pixels per image frame. This
can result in only part of the rays being displayed in the presence of a high
radiation field. If the lens cover is removed, then there will be a dramatic
increase in the number of white pixels measured by the software analysis tools.
A warning message is then displayed.
The number of Counts Per Minute is displayed on the upper left corner of the
application, and below it is the dose reading in μGy/h. This dose value changes
from a red to green colour once calibration is complete to define adjustments of
CPM values for corresponding μGy/h values. When the sensor experiences an
increase in the radiation field, this value is automatically adjusted to mGy/h or
Gy/h values respectively. When measuring the radiation dose, the value will turn
green after 5 minutes of values are recorded. [3]
The text values located below the timer each have a corresponding meaning.
“n” represents the noise value of the phone with values of units. The lower the
value the higher the sensitivity of the phone. An increase in one unit results in
approximately 10% decrease in sensitivity.
“e” represents the exposure time. This is only displayed if the value is changed
from the default value. The default value is 0. Increasing the exposure time
increases the sensitivity of the phone but also increases noise value.
“t(/5min)” represents the standard deviation over the last 5 minutes of
measurements. It displays values in minutes out of a total of 5 minutes e.g
t(3/5min). The higher the standard deviation percentage, the more stable the
radiation measurements in the current environment.
“fps” represents the frames per second. The higher the frame rate of the phone
implies an increase in phone sensitivity.
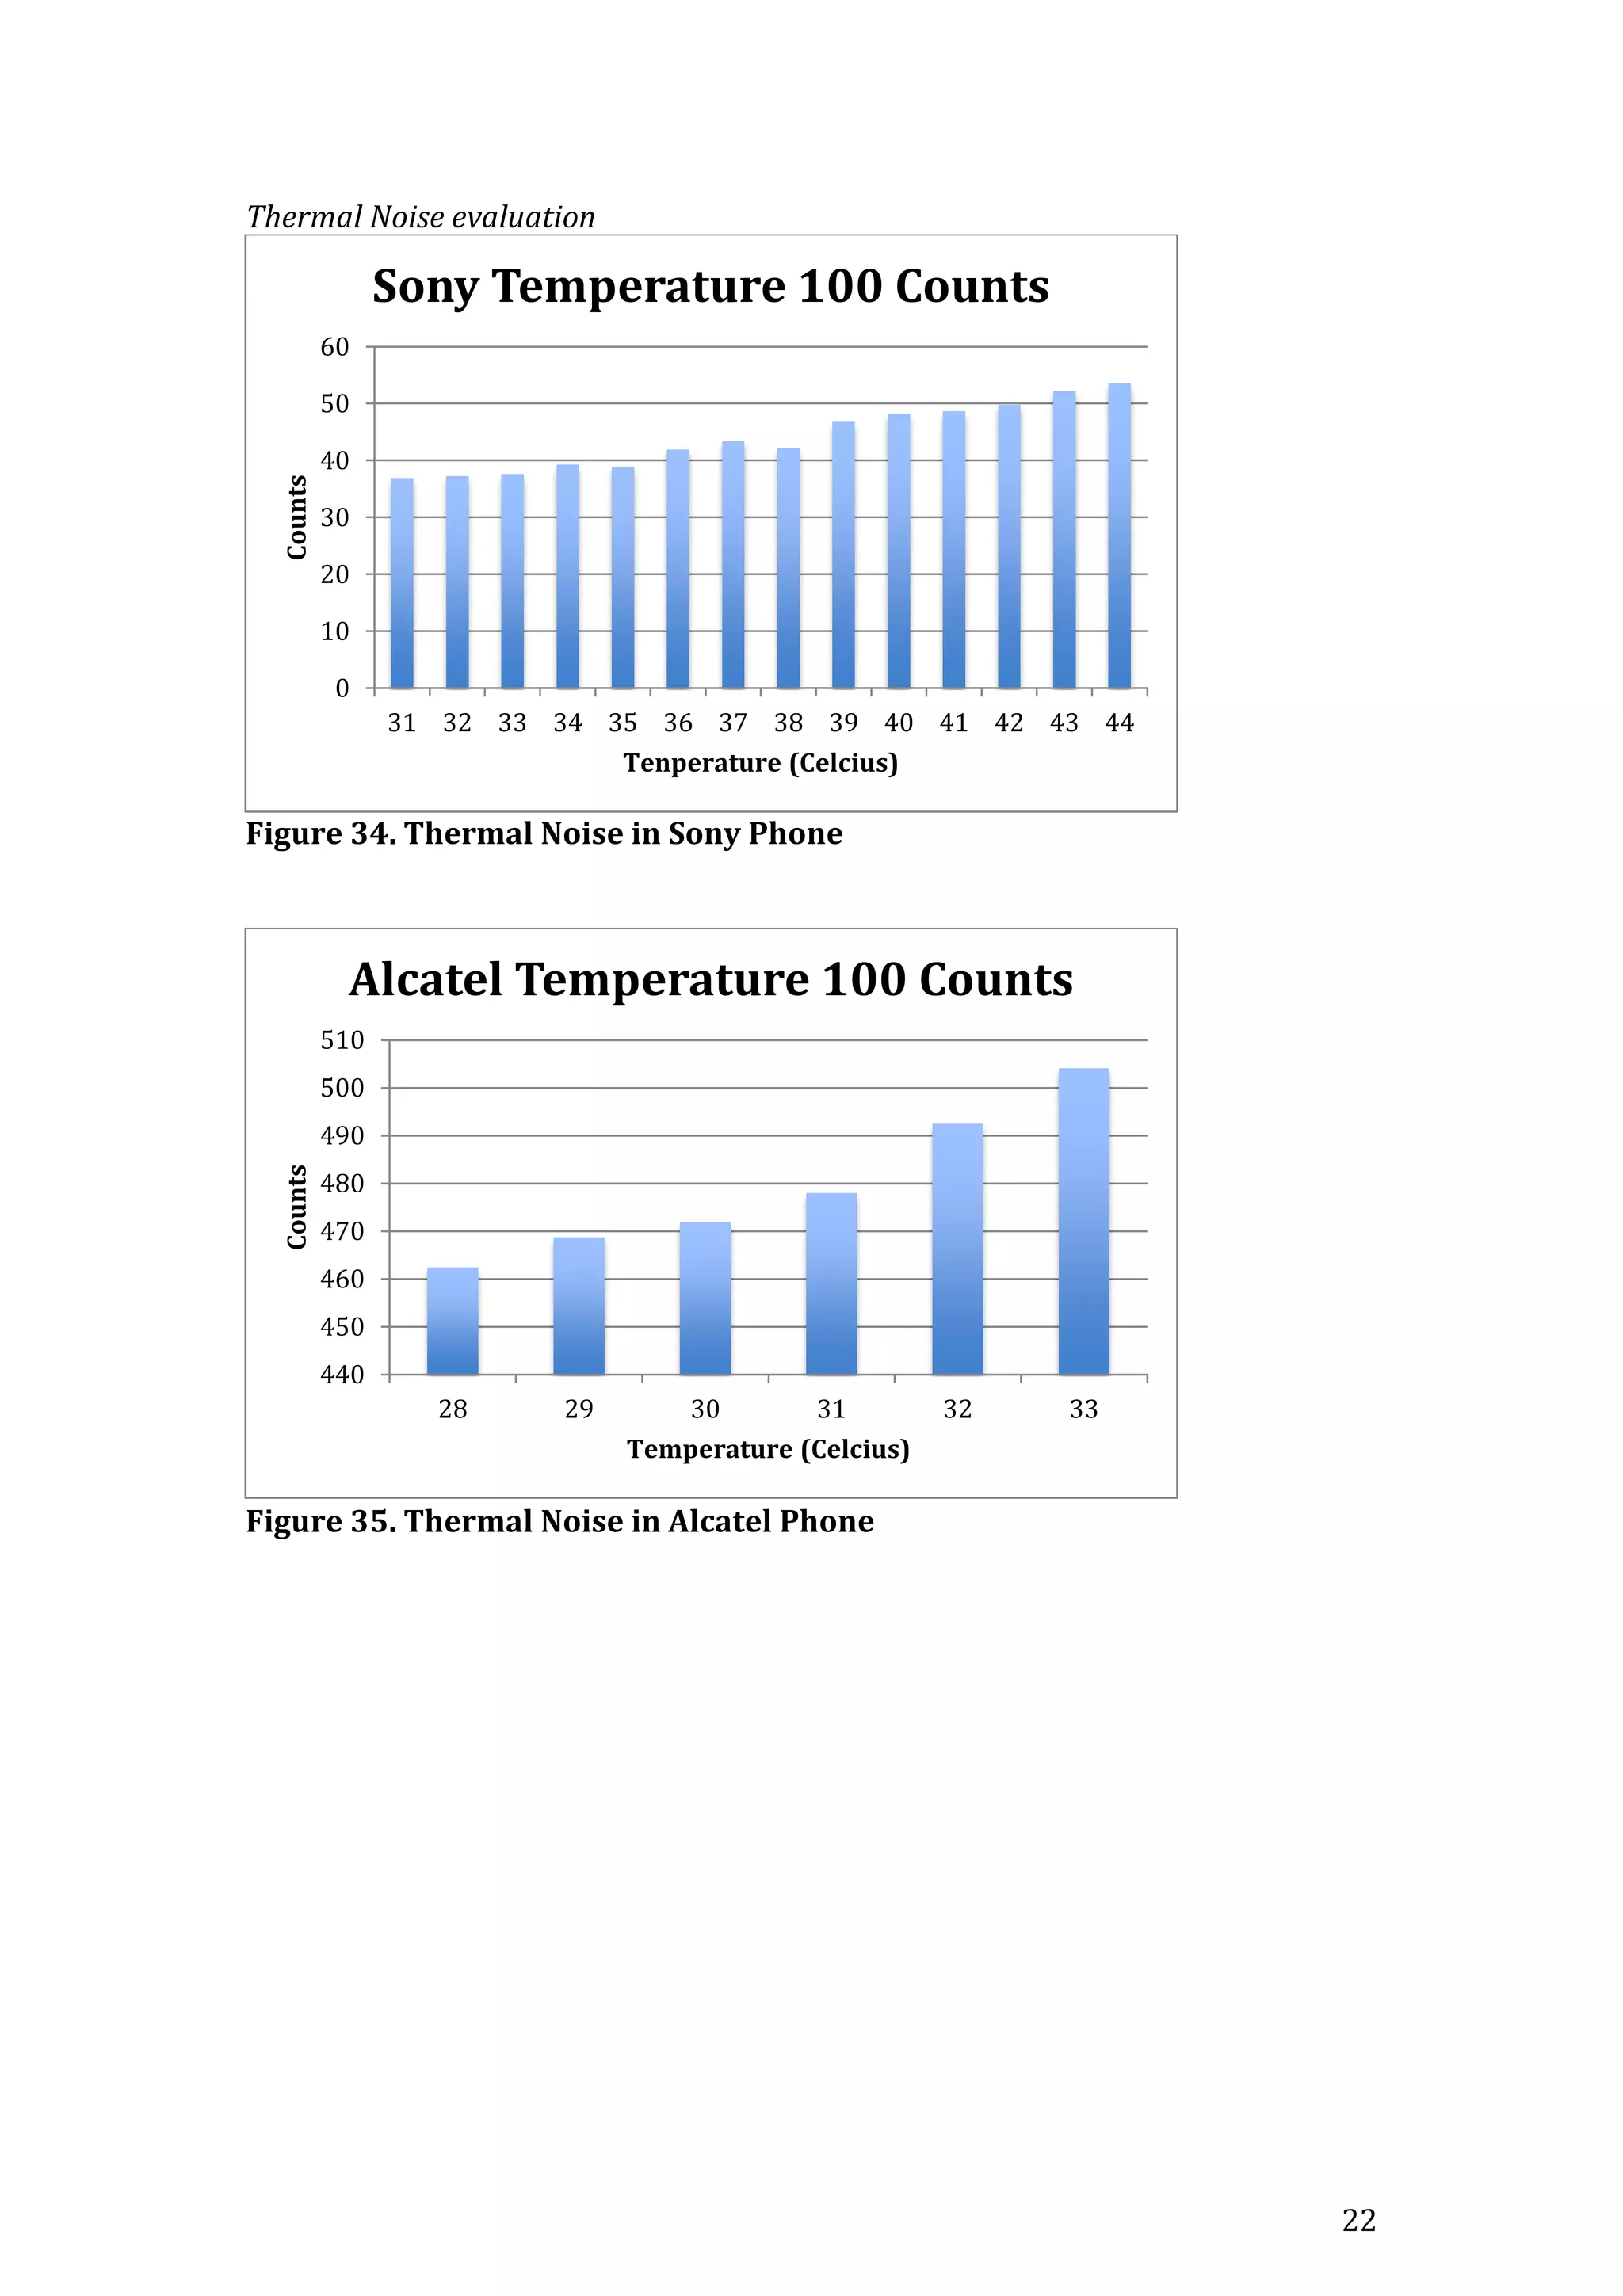
“t” represents the internal temperature of the device battery. An increase in the
temperature can results in an increase in noise. No temperature correction is
implemented in the algorithm of the applications software if the temperature
interferes with the sensitivity of the phone.](https://image.slidesharecdn.com/finalyearproject-150728225946-lva1-app6892/75/Final-year-project-To-Design-and-Test-a-low-cost-Gamma-Ray-detector-13-2048.jpg)
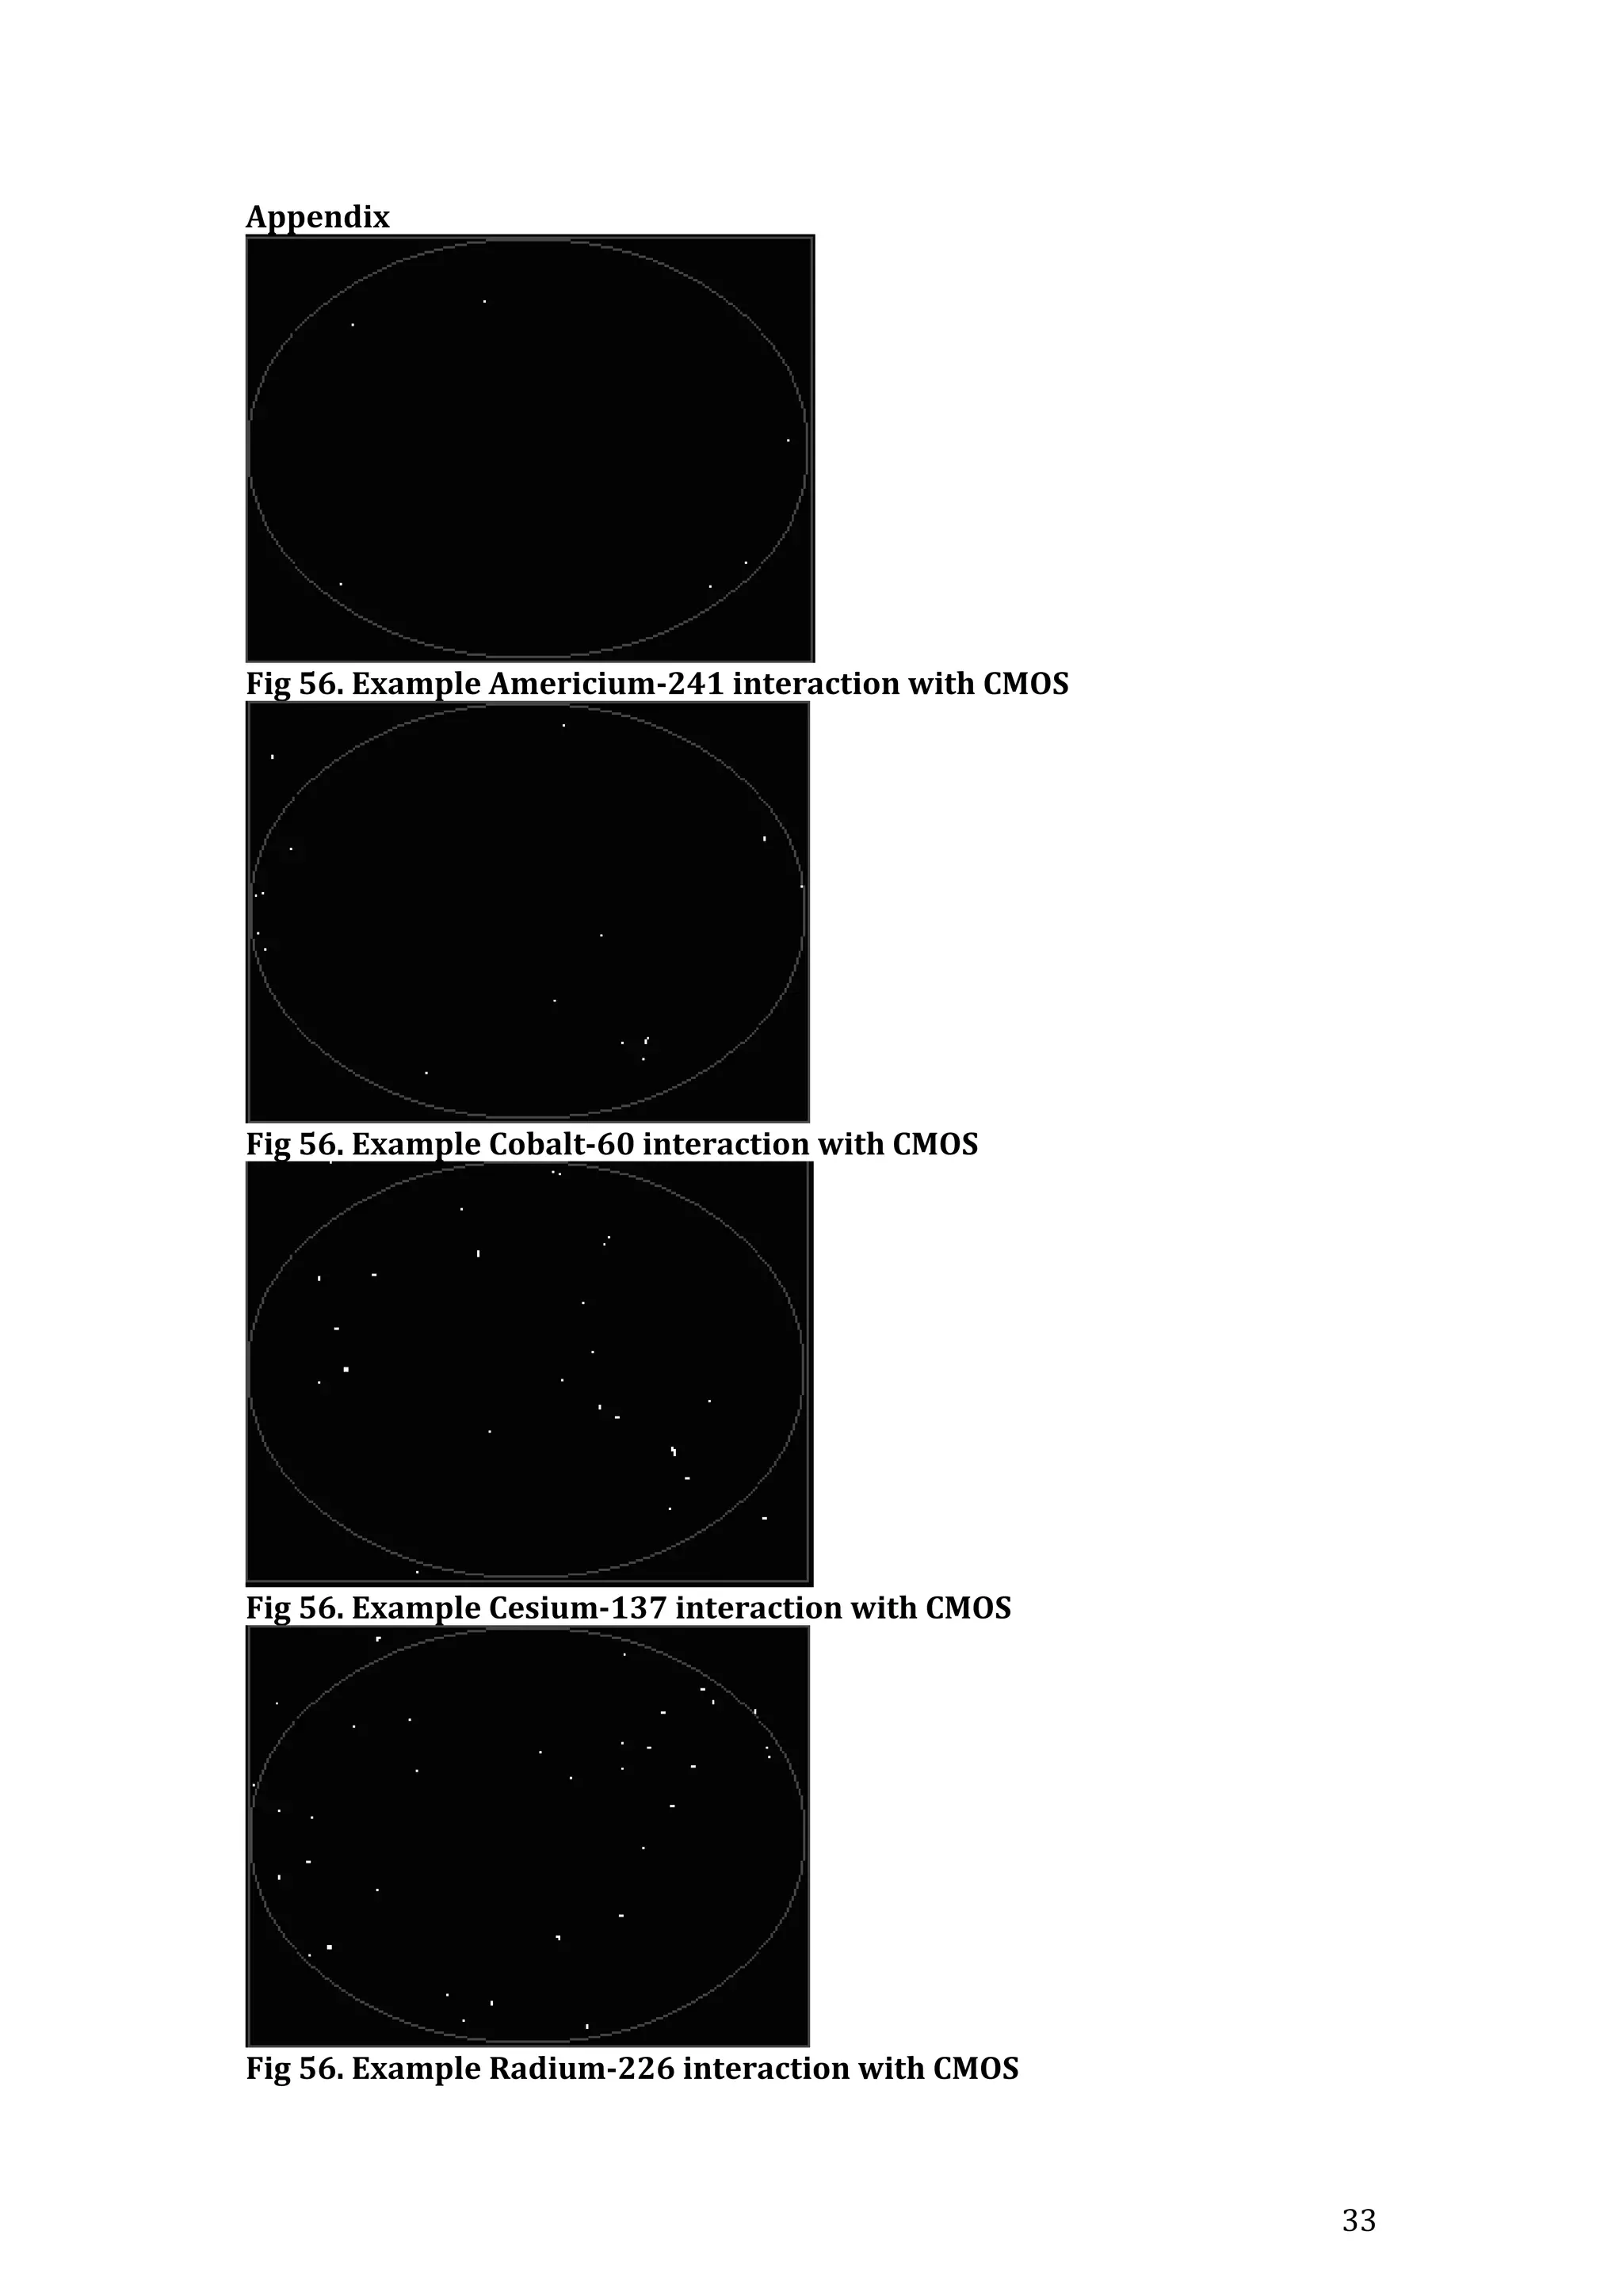
![14
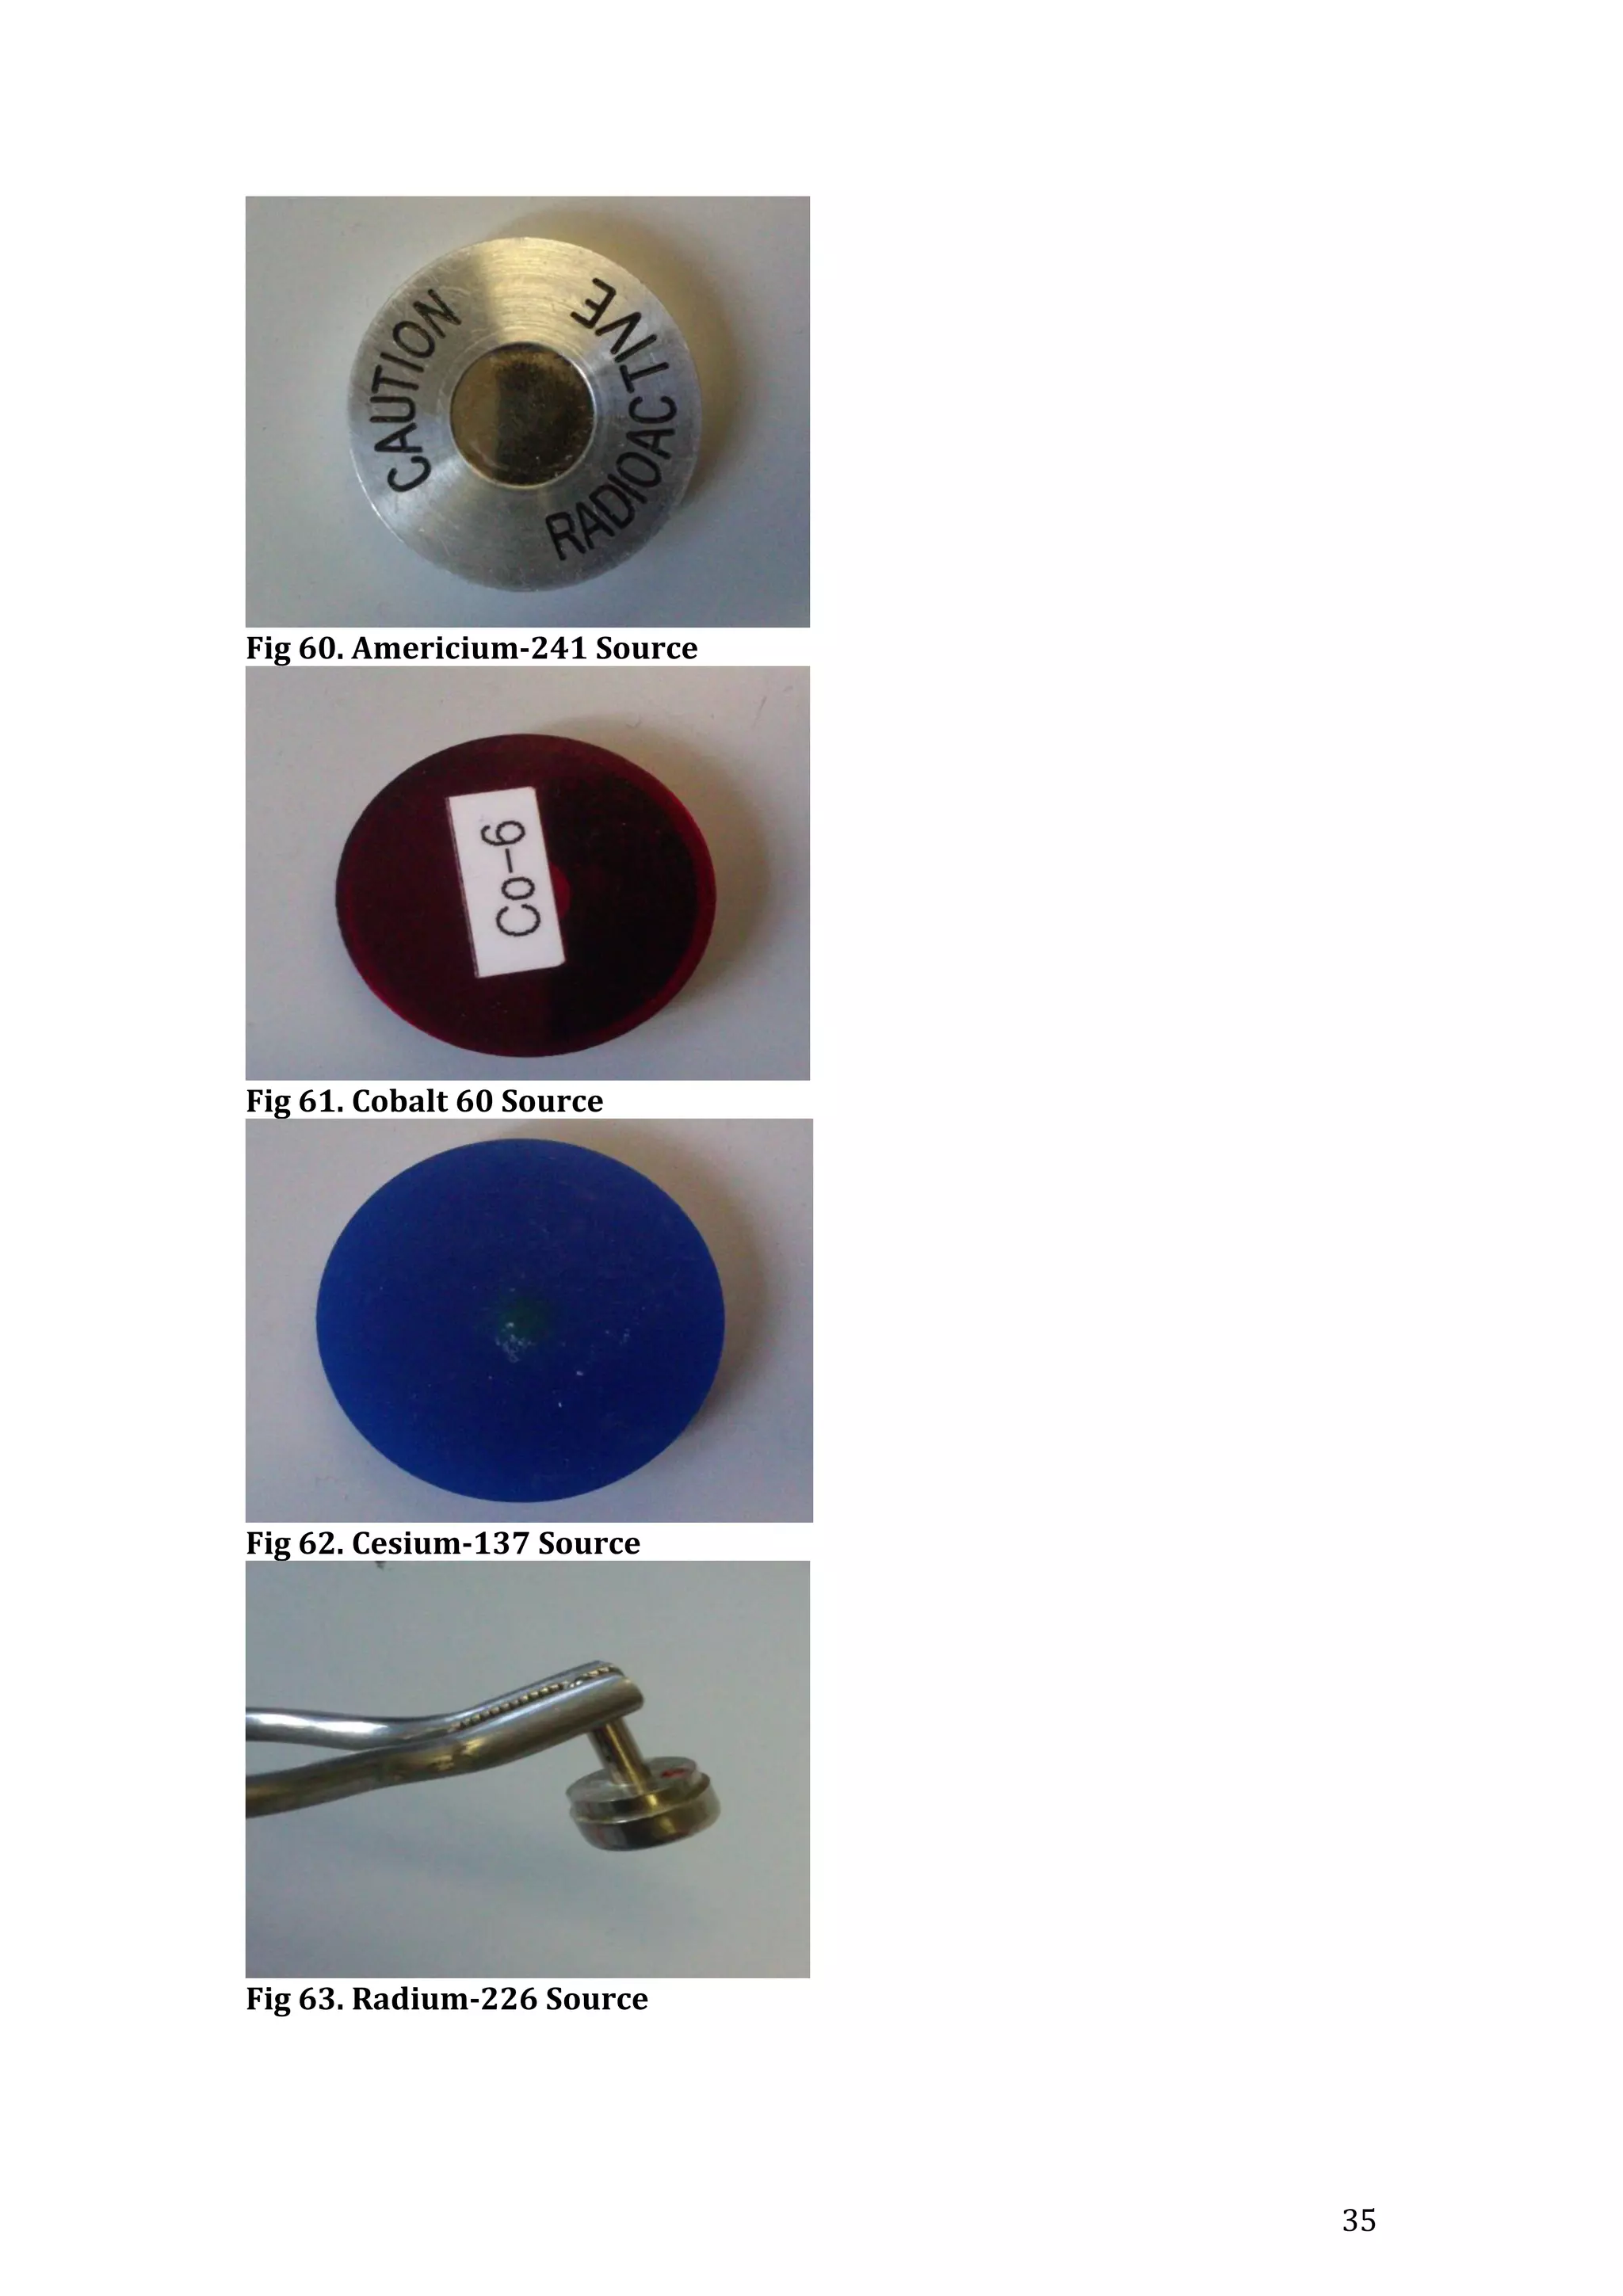
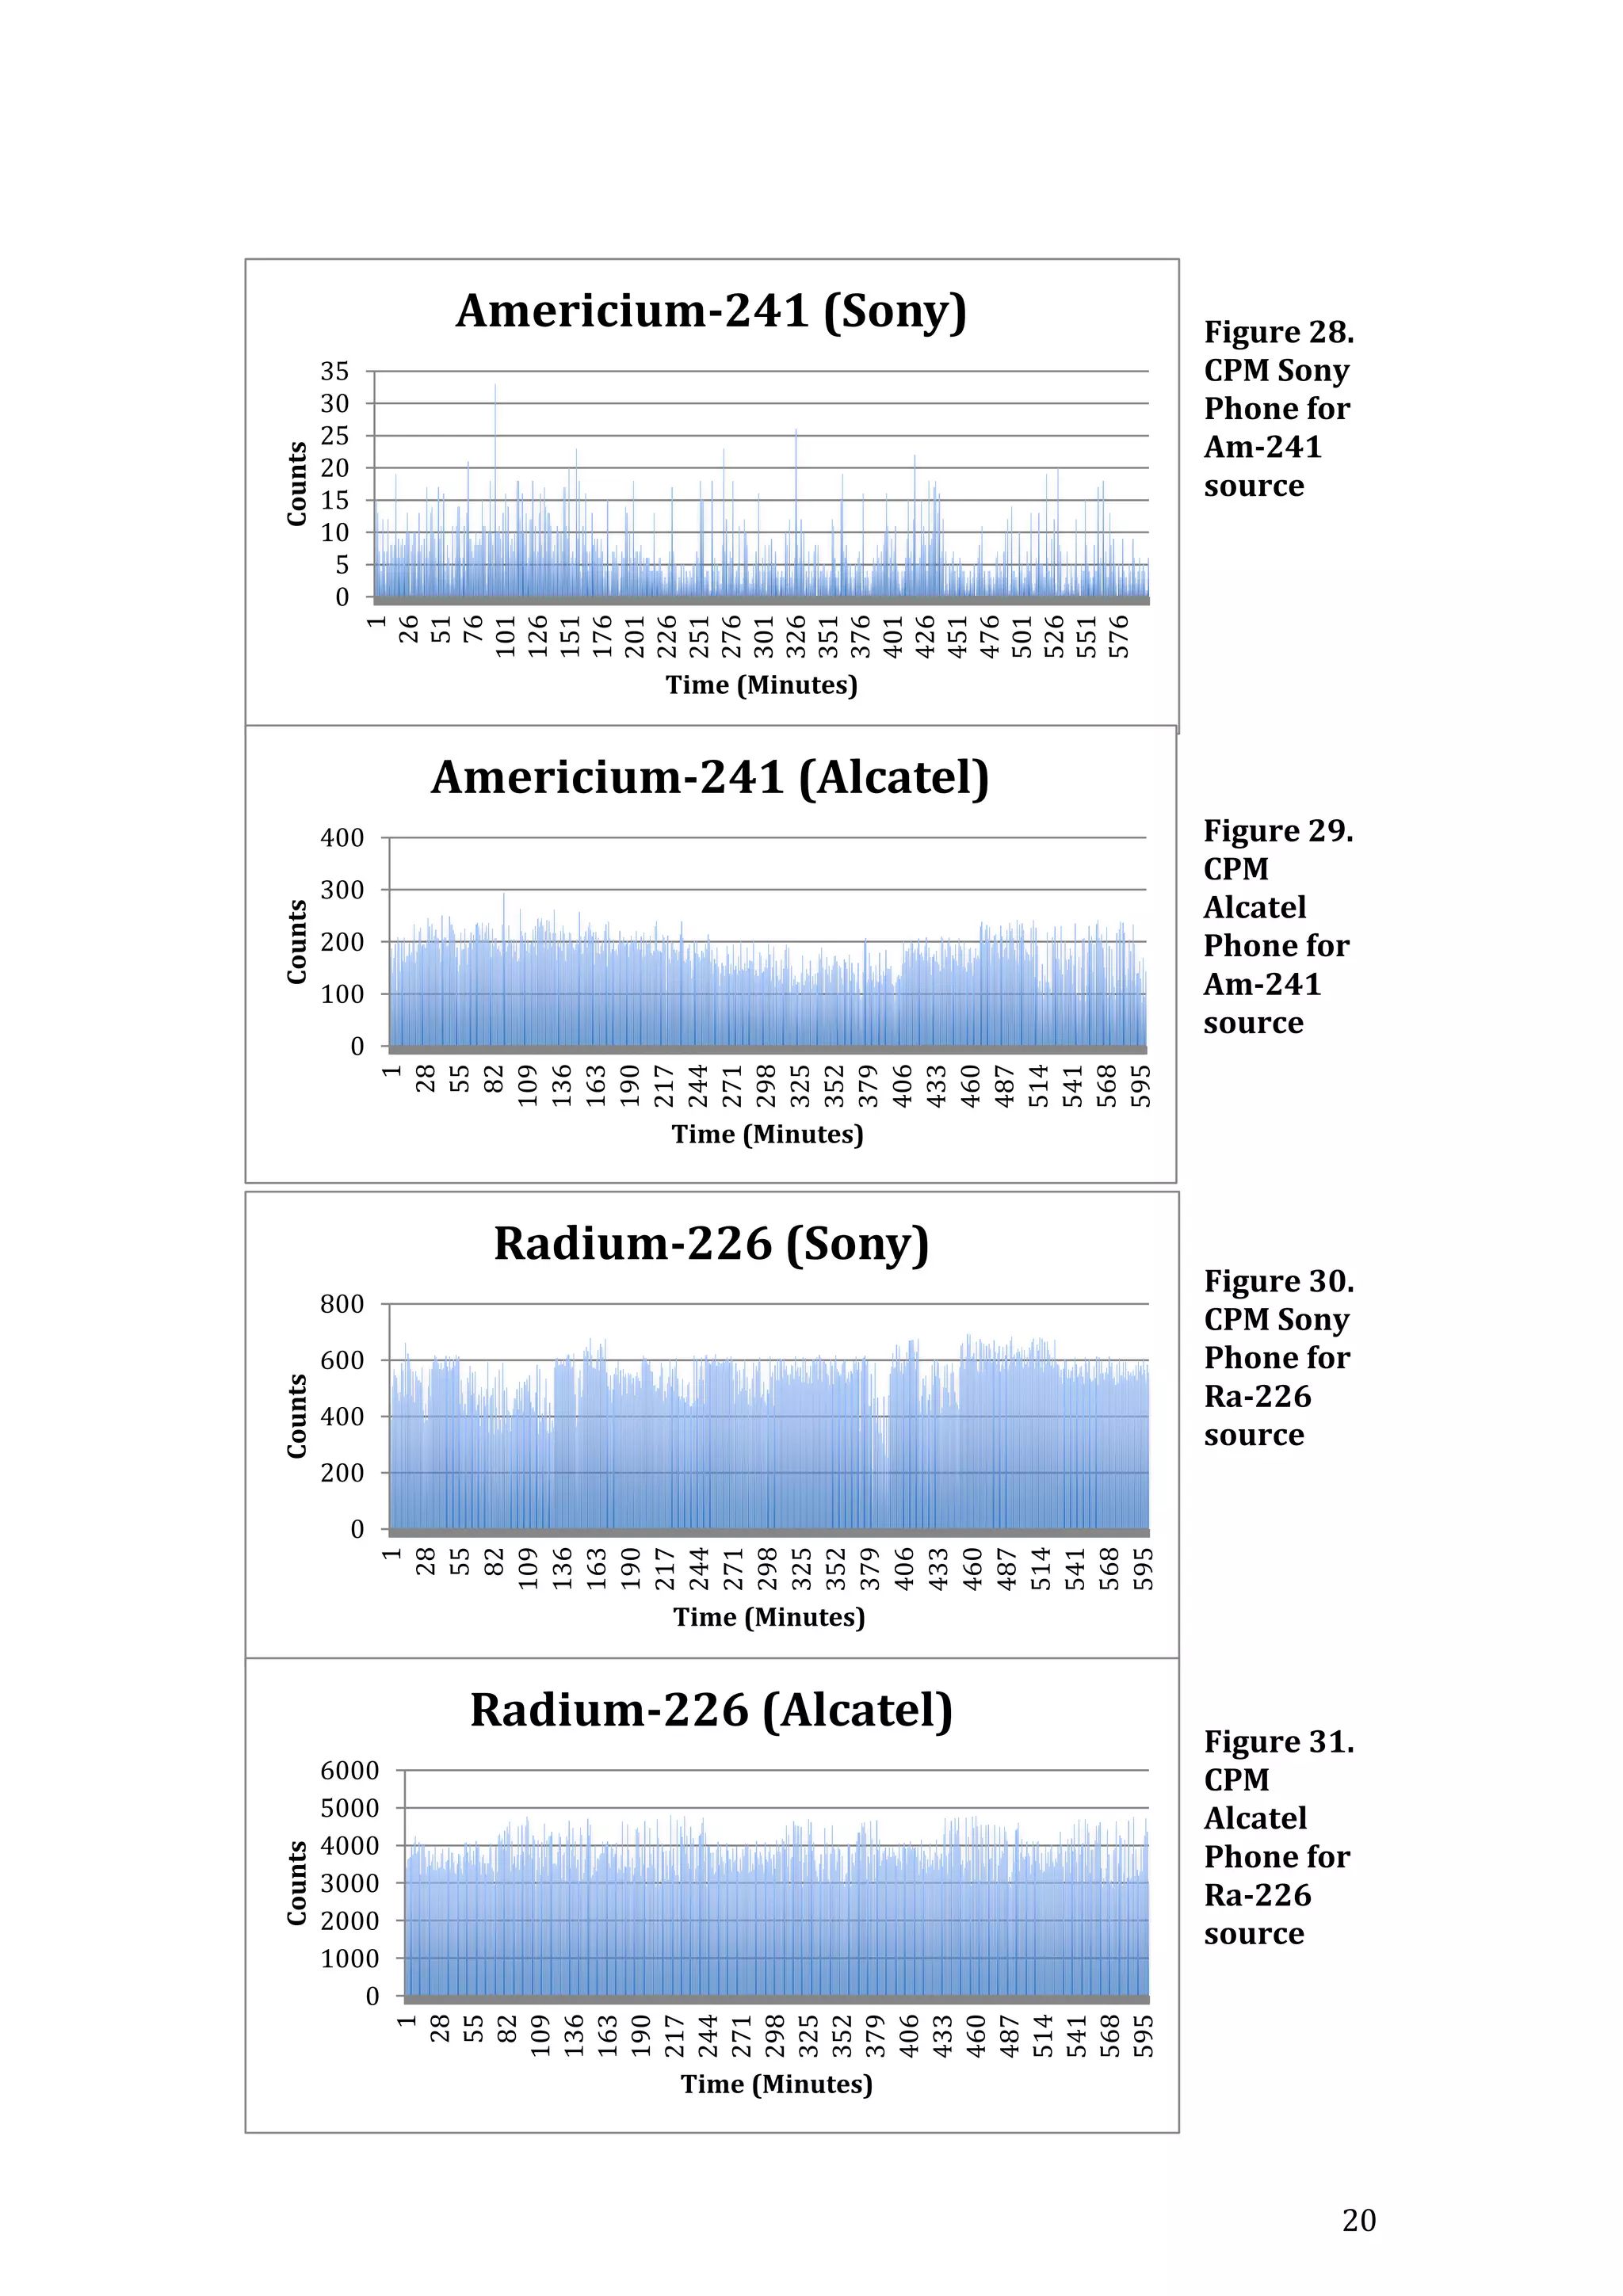
Testing Radiation Sources
A variety of different Gamma Radiation Sources are available including
Americium 241(Am–241), Cobalt 60(Co-60), Cesium 137(Cs-137) and Radium
226(Ra-226).
These sources are placed in front of the detector Camera lens/window. In order
to obtain accurate CPM mean value counts for each gamma source, the detector
must be used to measure each source over a long period of time (10 hours).
Using the software analysis application, the data can be sent to a computer in a
CSV file and converted to an .xlc file. This allows the data to then be plotted and
graphed in excel.
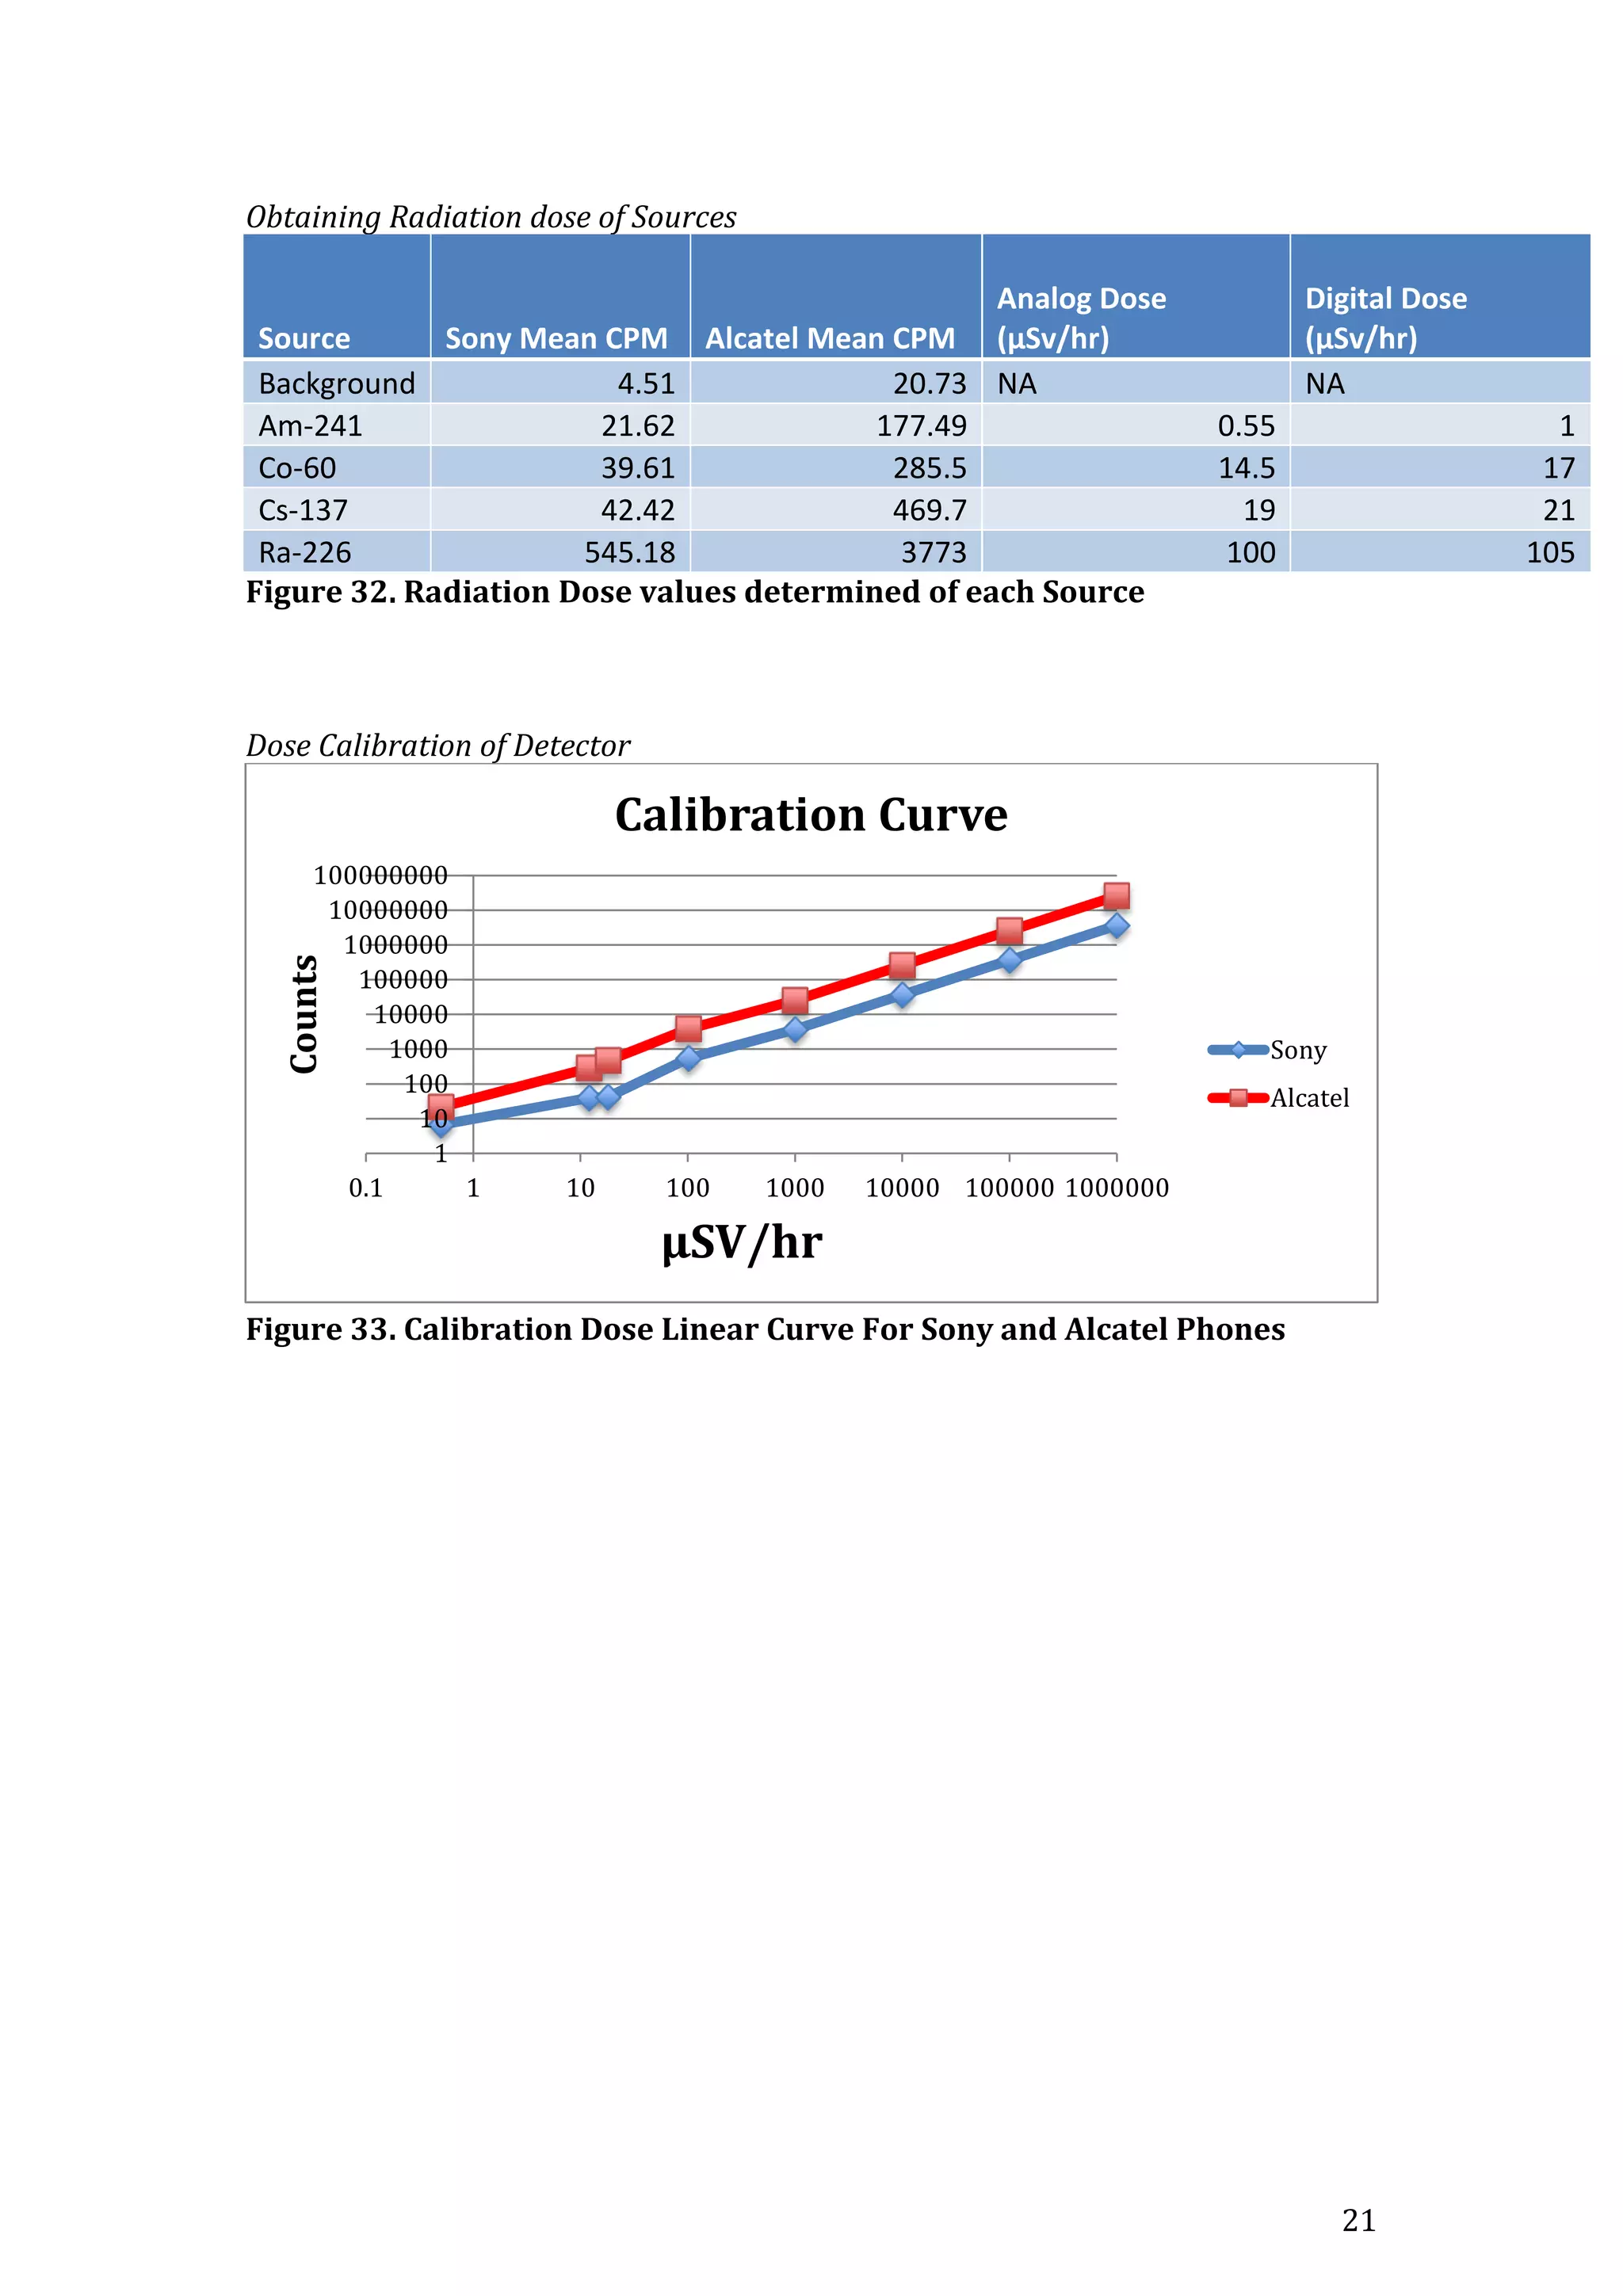
Obtaining Radiation dose of Sources
In order to calibrate the Phone camera detector to accurately measure dose, the
radiation sources must all have their dose levels determined. Two different
dosimeters are used to verify the dose readings, an analog counter- “Mini rad
1000 Series Monitor” [2] and a digital counter- “Mini 6100 series Electronic
Personal dosimeter (EPD).
Figure 18. Mini Rad series 1000 Figure 19. Mini 6100 series EPD
The Mini Rad has an x on either side of the measurement screen to represent the
detector window. The Mini 6100 has three circles to represent the detector
window. The devices have already been calibrated. The dose measurement is
given in μSV/hr values. Measurements should be taken by placing the different
radioactive sources at the detctor window and also at other positions of the
detcteor in order to gauge an acurate reading.
Dose Calibration of Detector
The ability of the Phone Camera detctor to acuratly detect a dose reading in
μSV/hr must be calibrated. The mean CPM values for each Radioactive source
over 10 hours is implemented with the mean dose reading recorded from both
the digital and analog dosimeters. These values are imputted into the adjust
menu in the software application settings menu. (refer to figure.) This allows for
a dose calibration curve to be obtained. Depending on the acuracy of the
imputted data, the Software should now give a μSV/hr dose reading at the
detector window. The CPM-0 value should also be recorded here to give a base
line cut off to cancel out the background radiation for a more acurate result.](https://image.slidesharecdn.com/finalyearproject-150728225946-lva1-app6892/75/Final-year-project-To-Design-and-Test-a-low-cost-Gamma-Ray-detector-19-2048.jpg)
![16
that the same number of counts should be recorded at each position and the
overal geometry position in the x and y plane should not change. The larger the
number of counts that are recorded, the more acurate the average data value will
be. The usuable distance range for the measurements of position (rmin,rmax) are
determined. rmin is obtained based on the fact that the usuable distance of
detection should be approximatly five times the diameter of the radiation source.
The sources are usually 5mm in diameter. The rmax value varies depending on the
detectors sensitivity which varies from phone to phone.
Absorption effects of the air is negligable as the electrons (0.546/2.2 MeV) have
a range of 1.5 -10m in air. These values are much higher than the usuable
detector range of the CMOS sensor detcetors.
Once the data has been obtained from the different positions, the data can be
exported to excel, tabulated and a graph of Counts vs 1/disance2 (1/d2) should
show a linear realationship through the origin. [6]
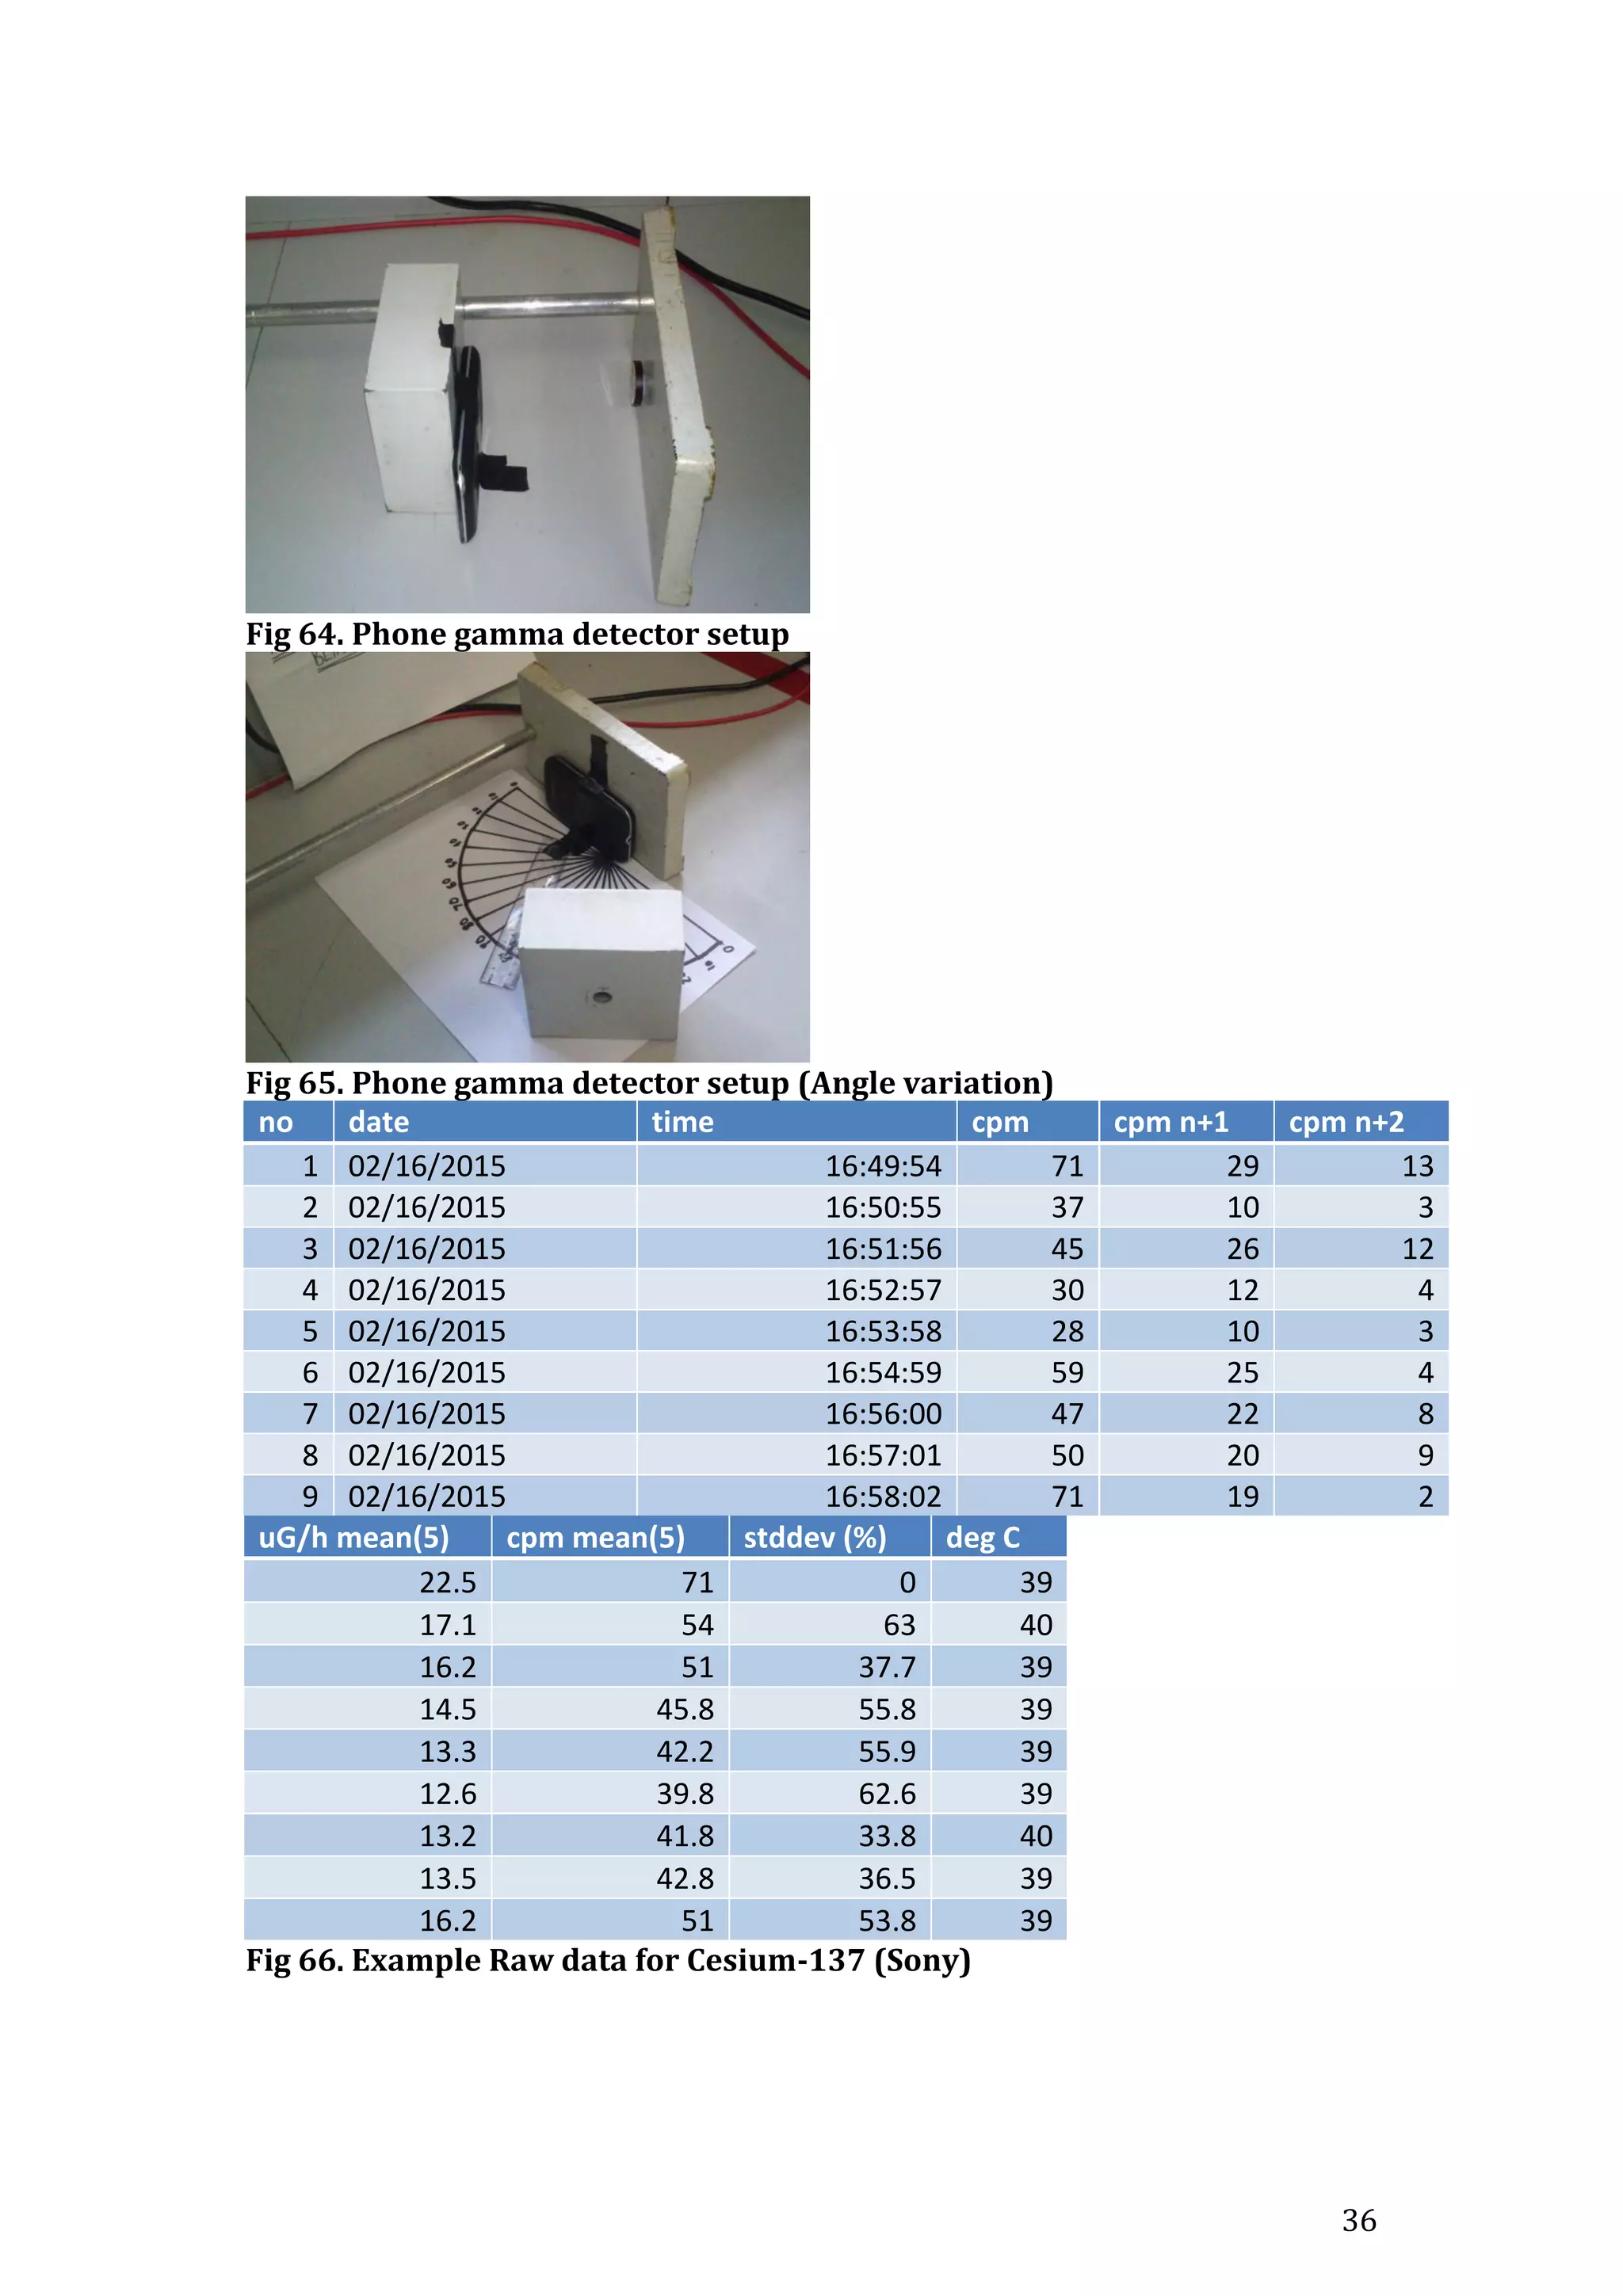
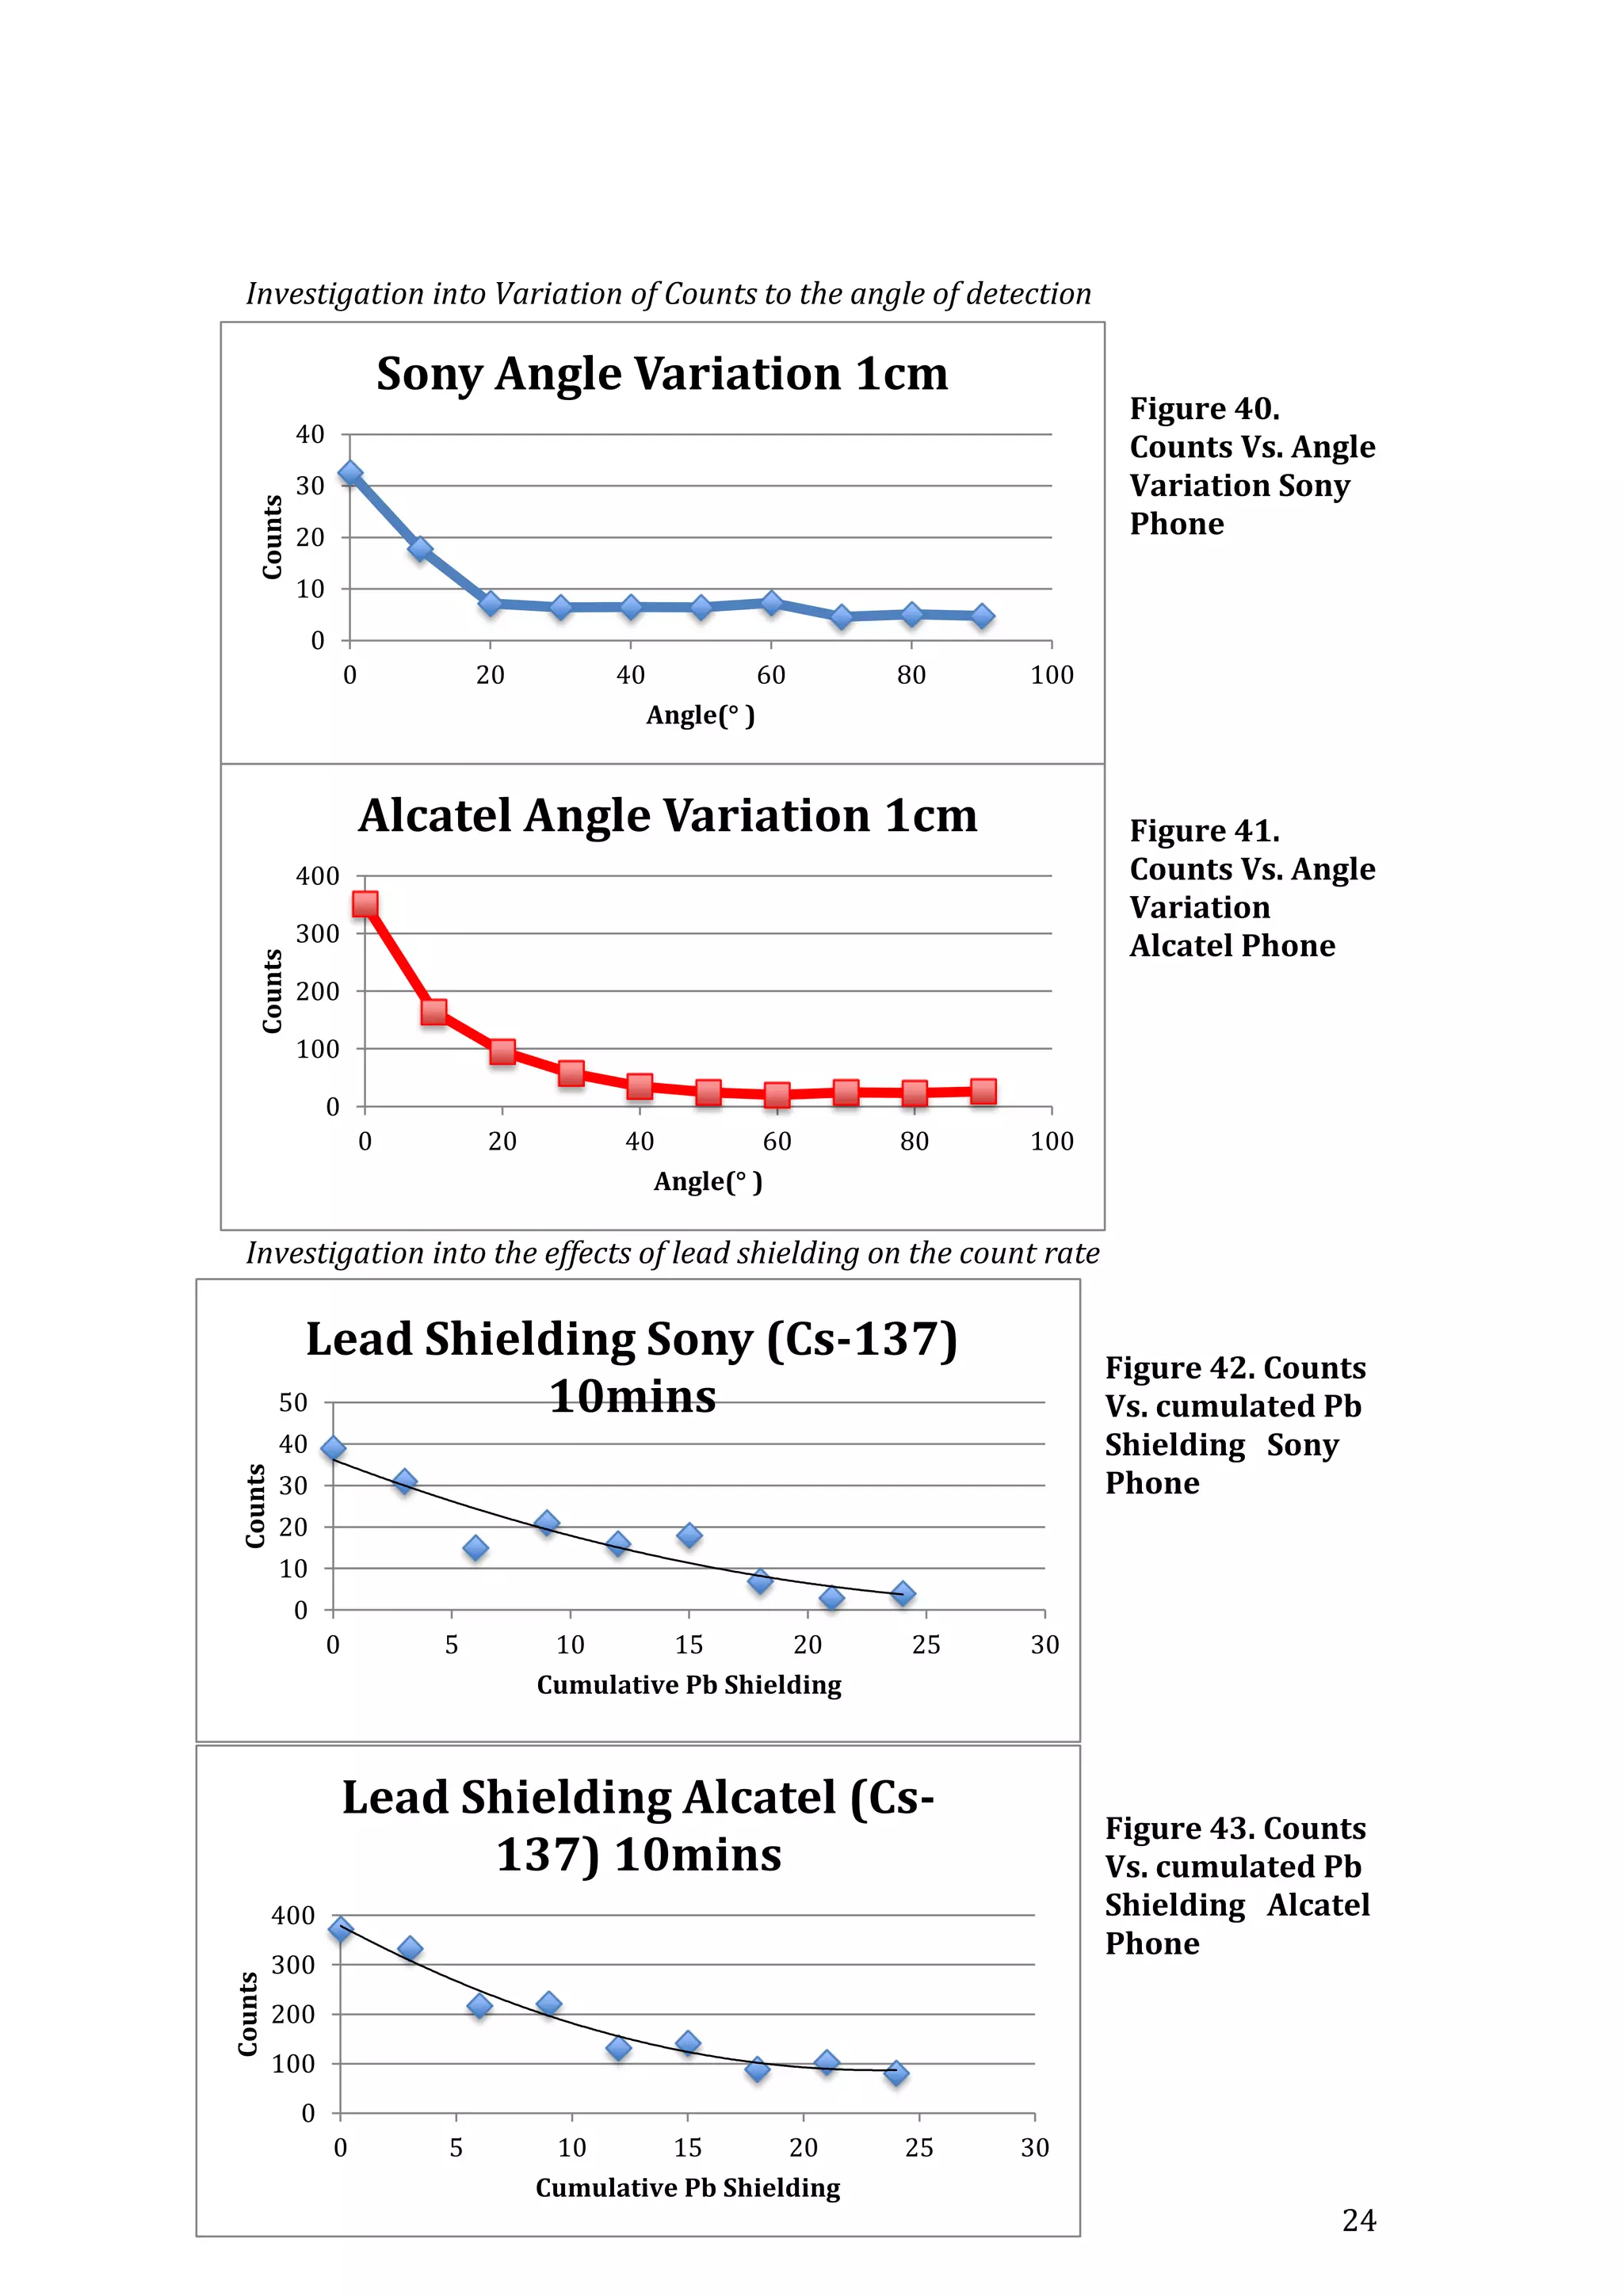
Investigation into Variation of Counts to the angle of detection
The Variation of the Count rate with respect to the angle of detection can be
investigated by having the detector in a fixed position. The angle of the
radioctive source being used (Cs-137) can be changed in increments of 10°.
However the distance of the source to the detector window must be fixed for all
measurements, and the source height must also be constant for all
measurements. Again by keeping all of these parameters unchanged for each
variable angle, and obtaining a reasonable amout of data points e.g. 100 Minutes
of CPM. Then an accurate realationship of the number of Counts detected to the
change in the angle of the source to the deetctor can be obtained and graphed.
Investigation into the effects of lead shielding on the count rate
The efects of lead (Pb) shielding can be examined on the count rate. The Detector
should be set up at a certain distance from the a chosen radioactive source
(Cs -137). The position of both should be fixed in position. Lead shileding should
then be positioned between the detector and the sourse. The lead shielding used
has a thickness of 3mm. A number of values are recorded for a constant amount
of time in order to obtain vallid accurate results. The cumulative thickness of the
lead shielding of the gamma source is increased in incriments of 0.3mm until a
total of 24mm. This data is then plotted in excel of counts vs. Cumulative Pb
thickness.
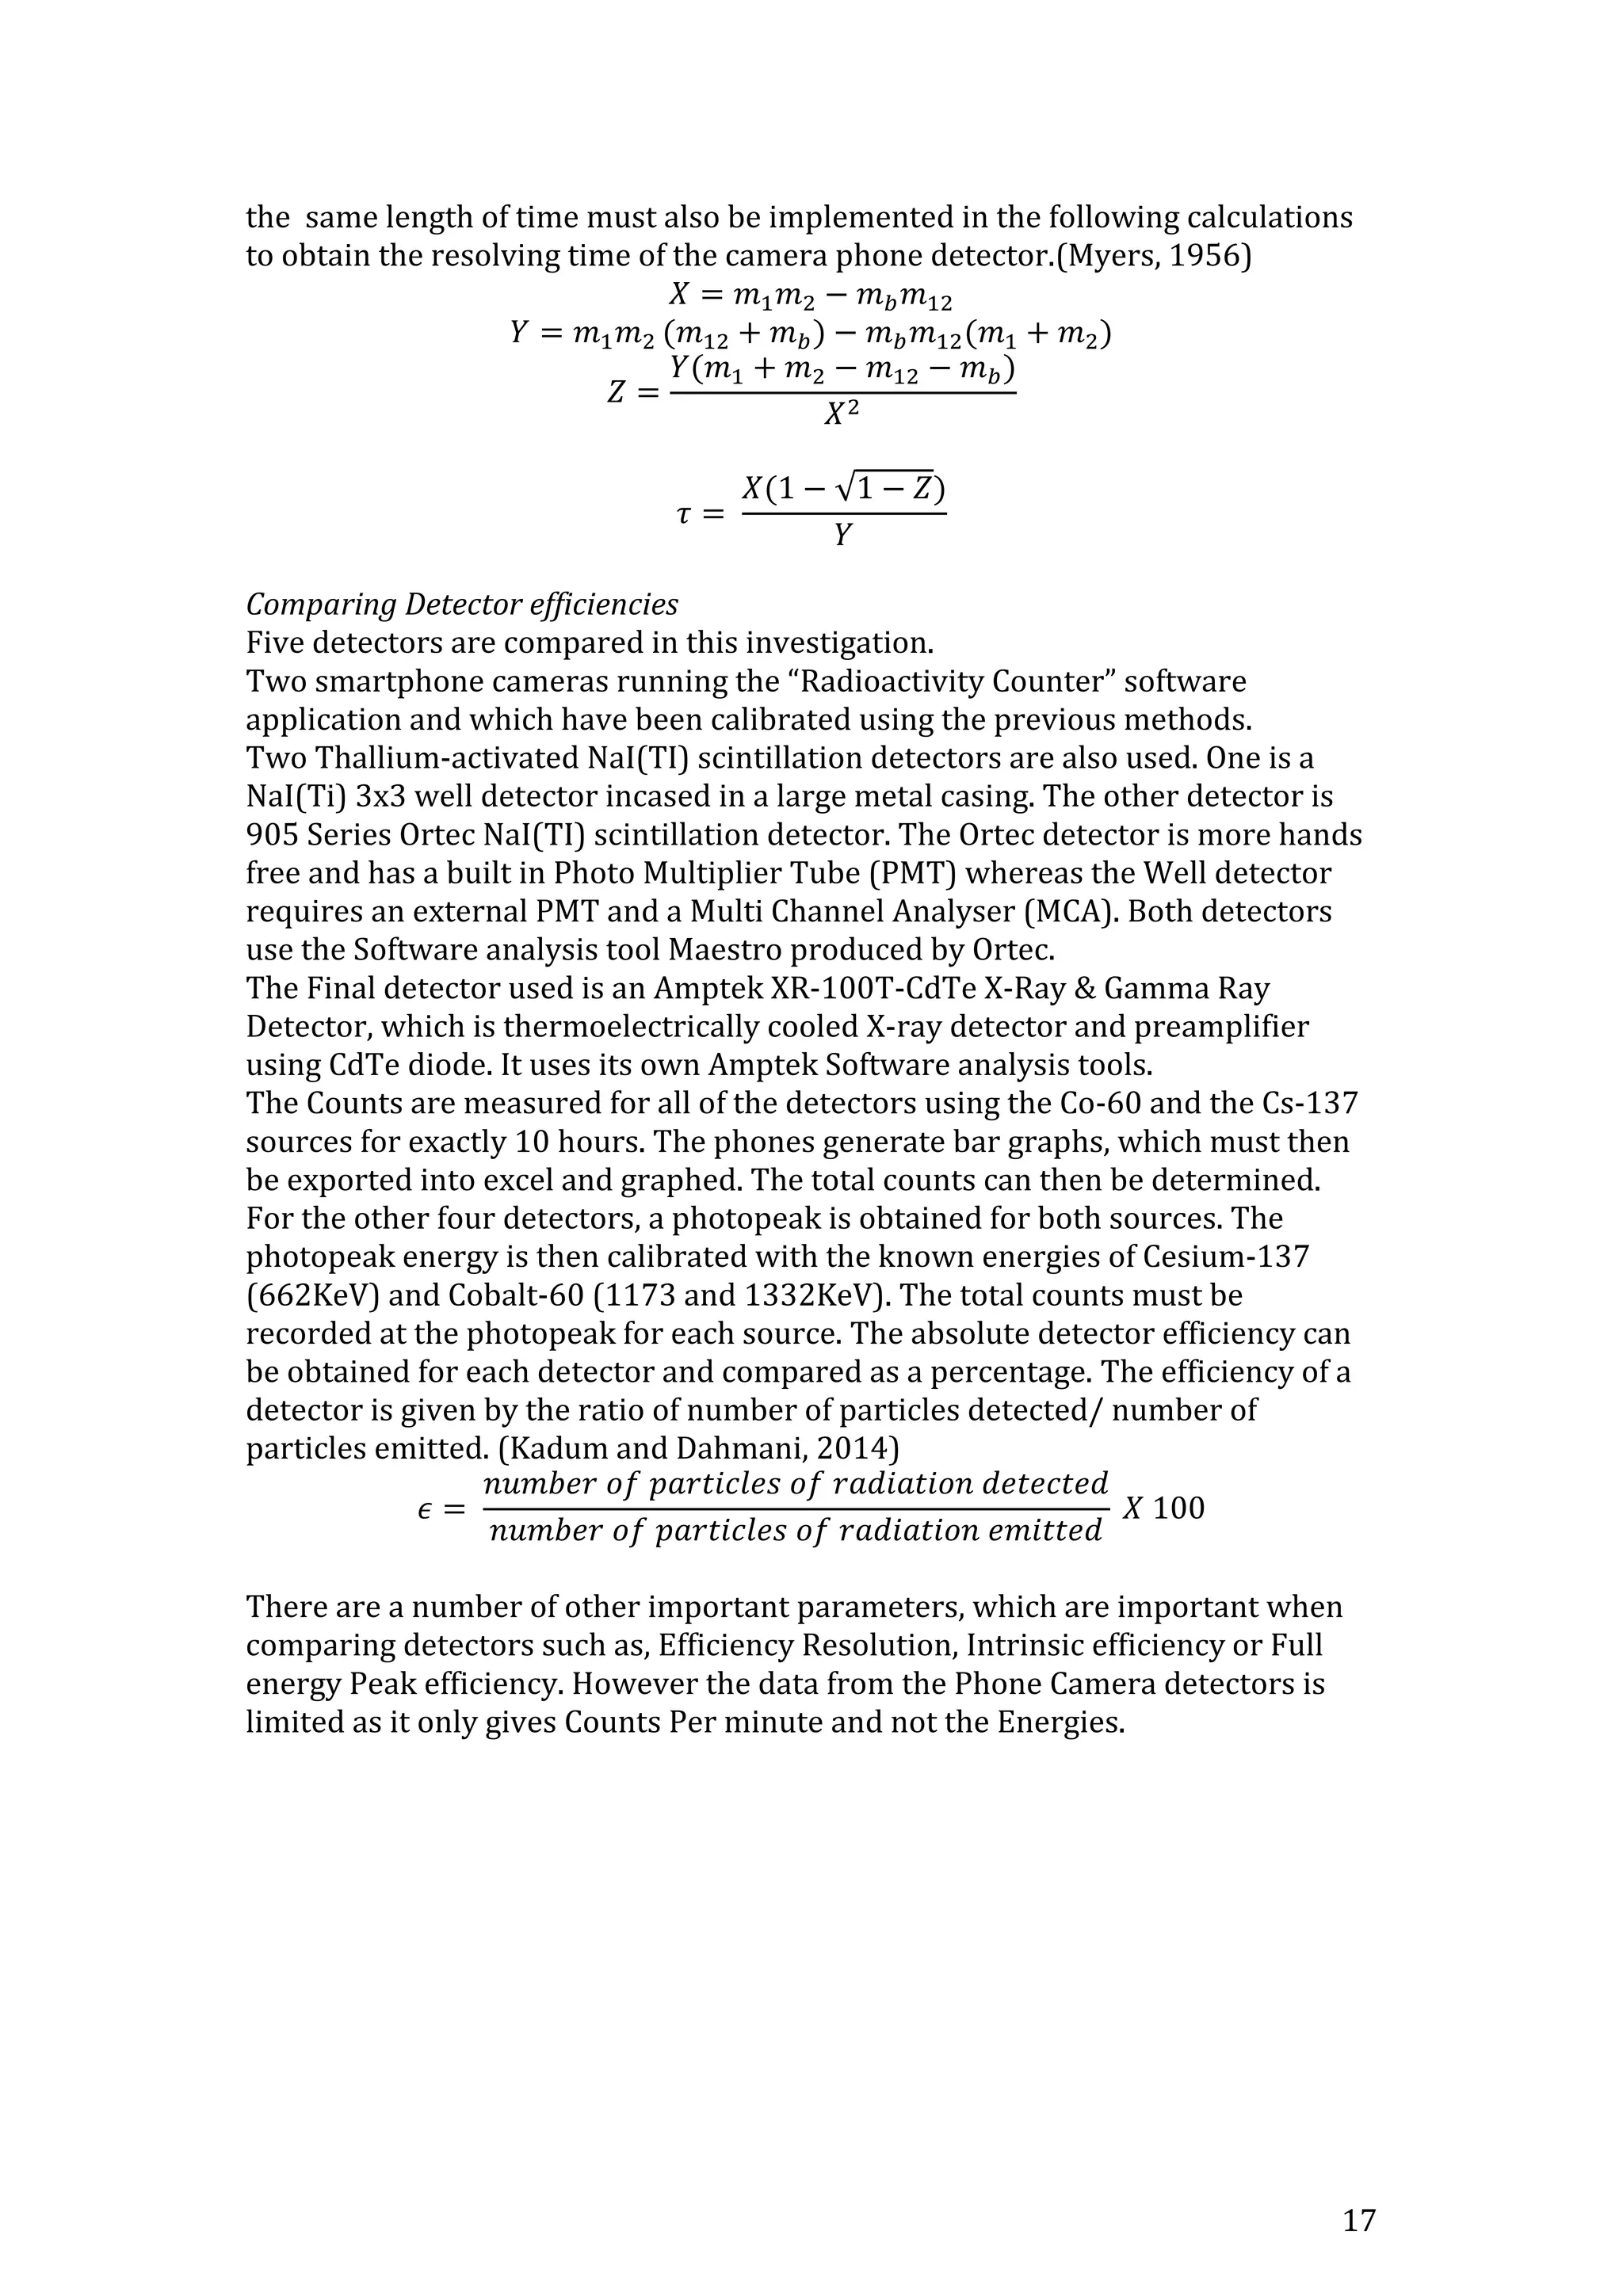
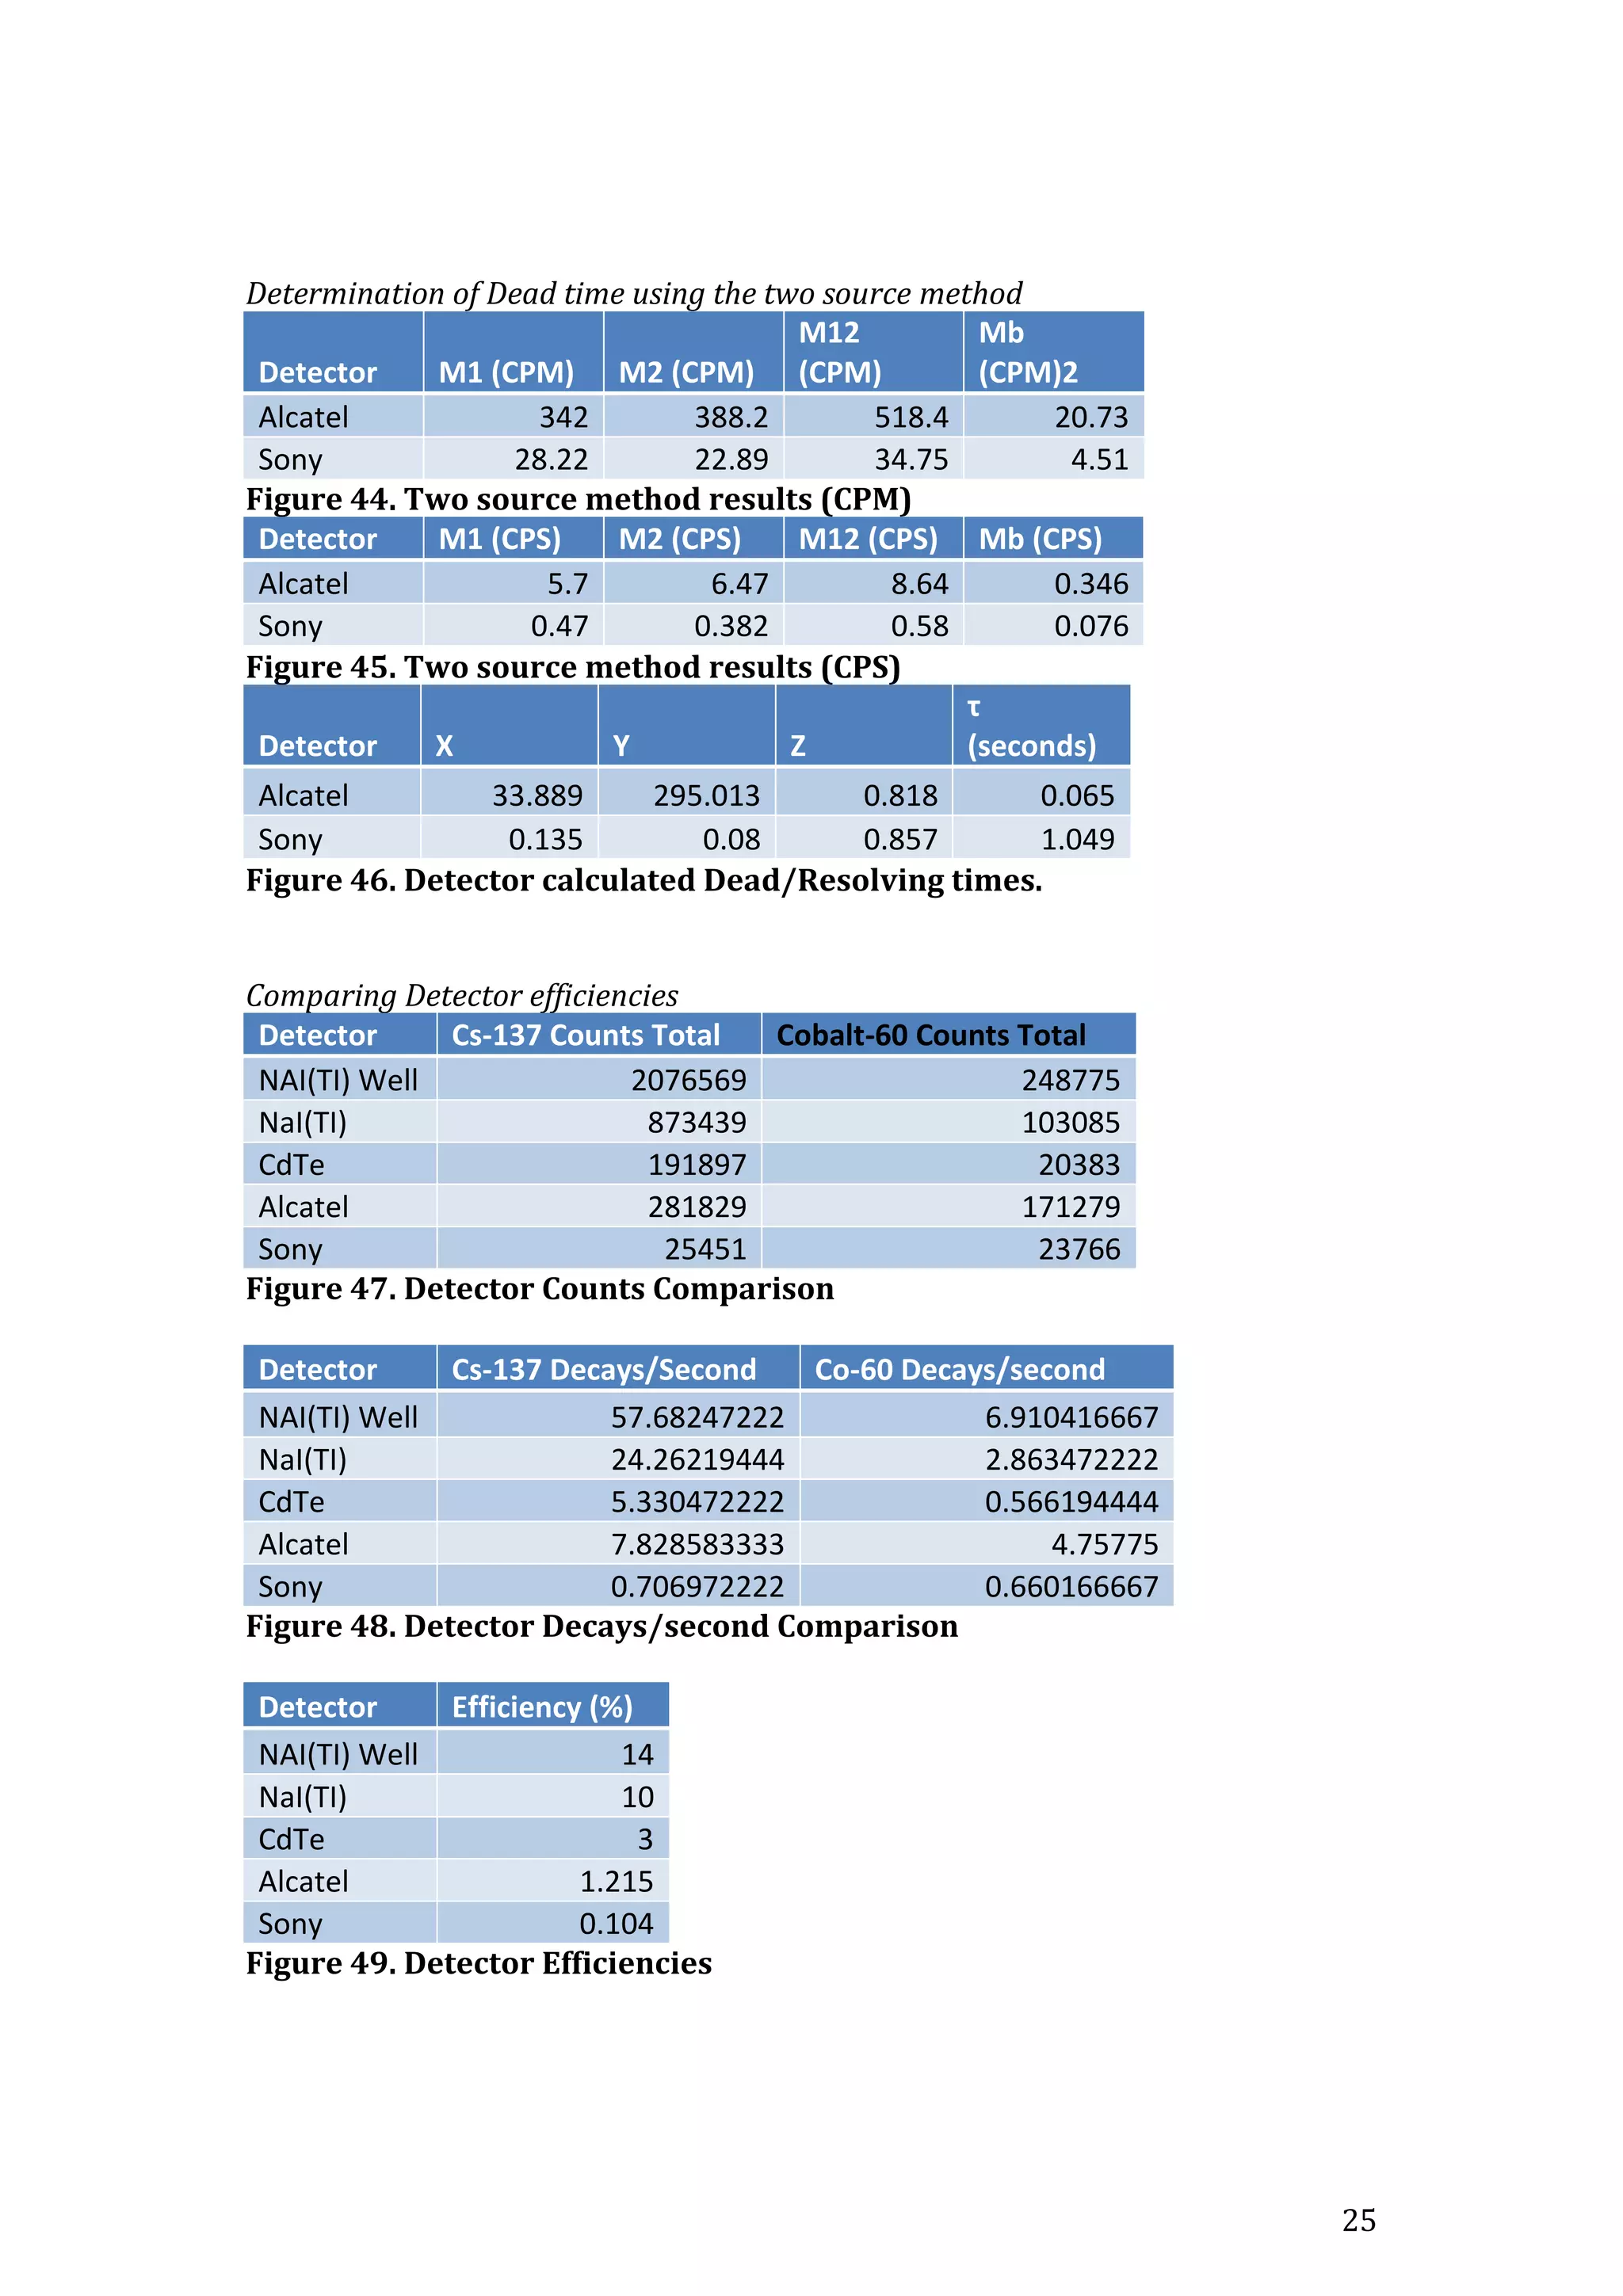
Determination of Dead time using the two source method
The dead/resolving time (τ) of a system can be obtained using the two source
method. Two different radioactive sources muct be used. The first step is to place
source 1(Cs-137) and source 2(Co-60) in combination together (m12) in front of
the deterctor window at a fixed distance. In order to obtain acurate results, all
data measurements must be carried out over a long period of time (10 hours),
this is because the sources will have similar counting rates. The next step is to
repeat the measurements seperatly with each source, source 1(m1) and source 2
(m2). However it is important to note that the sources must be kept in the same
position as they were when the combined position measurements were taken.
This allows for the solid angle to be preserved. The background counts (mb) for](https://image.slidesharecdn.com/finalyearproject-150728225946-lva1-app6892/75/Final-year-project-To-Design-and-Test-a-low-cost-Gamma-Ray-detector-21-2048.jpg)
![32
Manuals
[1] 905 Series-Ortec
www.ortec-online.com/download/905-series.pdf (Accessed April 2015)
[2] Series 1000 'Mini Rad'
http://rp-alba.com/index.php?filename=MR1000.php (Accessed April 2015)
[3] Radioactivity Counter Application
http://www.hotray-info.de/html/radioa_help.html (Accessed January 2015)
[4] XR-100T-CdTe X-Ray & Gamma Ray Detector
http://www.amptek.com/products/xr-100t-cdte-x-ray-and-gamma-ray-
detector/ (Accessed April 2015)
Documents
[5] Alpha Beta and Gamma Radiation Lab- Northwestern University
http://courses.physics.northwestern.edu/new335/PDF/alphabeta.pdf
(Accessed April 2015)
[6] Ortec Geiger Counting
http://www3.nd.edu/~wzech/Application-Note-AN34-Experiments-Nuclear-
Science-Experiment-2.pdf (Accessed April 2015)
Images
[7] Radiation
http://physics.tutorcircle.com/waves/gamma-decay.html (Accessed April 2015)
[8] Compton Scattering
http://www.fesaus.org/glossary/lib/exe/fetch.php?media=terms:glsp22f1.gif
(Accessed April 2015)
[9] Pair Production and annihilation
http://electrons.wikidot.com/pair-production-and-annihilation (Accessed April
2015)
[10] Photoelectric effect
http://drgstoothpix.com/wp-content/uploads/2012/10/photoelectric-effect-
1.jpg (Accessed 2015)
[11] Inverse Square law
http://hyperphysics.phy-astr.gsu.edu/hbase/acoustic/invsqs.html (Accessed
April 2015)](https://image.slidesharecdn.com/finalyearproject-150728225946-lva1-app6892/75/Final-year-project-To-Design-and-Test-a-low-cost-Gamma-Ray-detector-37-2048.jpg)