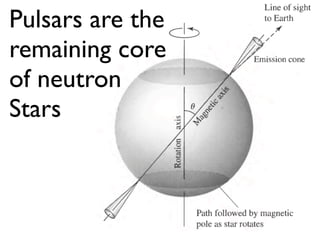
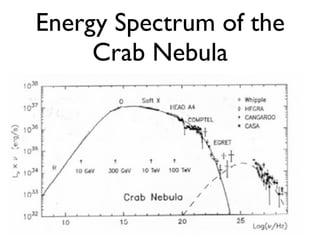
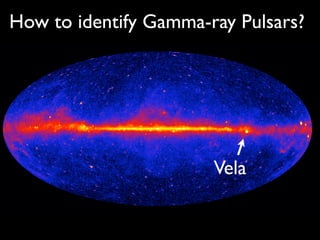
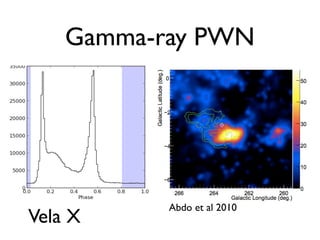
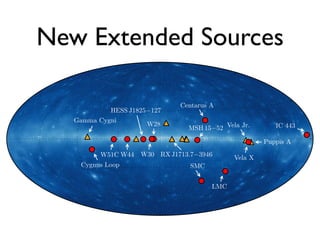
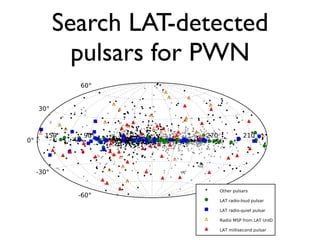
The document discusses neutron star-powered nebulae, particularly pulsar wind nebulae (PWNe), using data from the Fermi Gamma-Ray Space Telescope. It details the historical context of gamma-ray astronomy, the characteristics of pulsars, and the methodologies for identifying and analyzing gamma-ray emissions from these astronomical phenomena. Additionally, the text highlights the challenges in detecting new PWNe and their connections to supernova remnants and other astrophysical sources.


![0◦
0.◦
1 0.◦
2 0.◦
3 0.◦
4 0.◦
5 0.◦
6
Extension
10000
10200
10400
10600
10800
11000
11200TestStatistic
(a)
102
103
104
105
Energy (MeV)
0
50
100
150
200
TSext
(b)
0.0 0.1 0.2 0.3 0.4 0.5
∆θ2
([deg]2
)
101
102
103
Counts
(c)
Disk
Point
Counts
(d)
2◦
3◦
b
188◦
189◦
l
0
500
1000
1500
2000
2500
3000
3500
counts[deg]−2
Extended
Source IC 443](https://image.slidesharecdn.com/neutronstarpowerednebulae-130731000405-phpapp02/85/Neutron-Star-Powered-Nebulae-58-320.jpg)
![0
1b
2526
l
0
25
50
75
100
125
150
175
200
225
counts/[deg]2
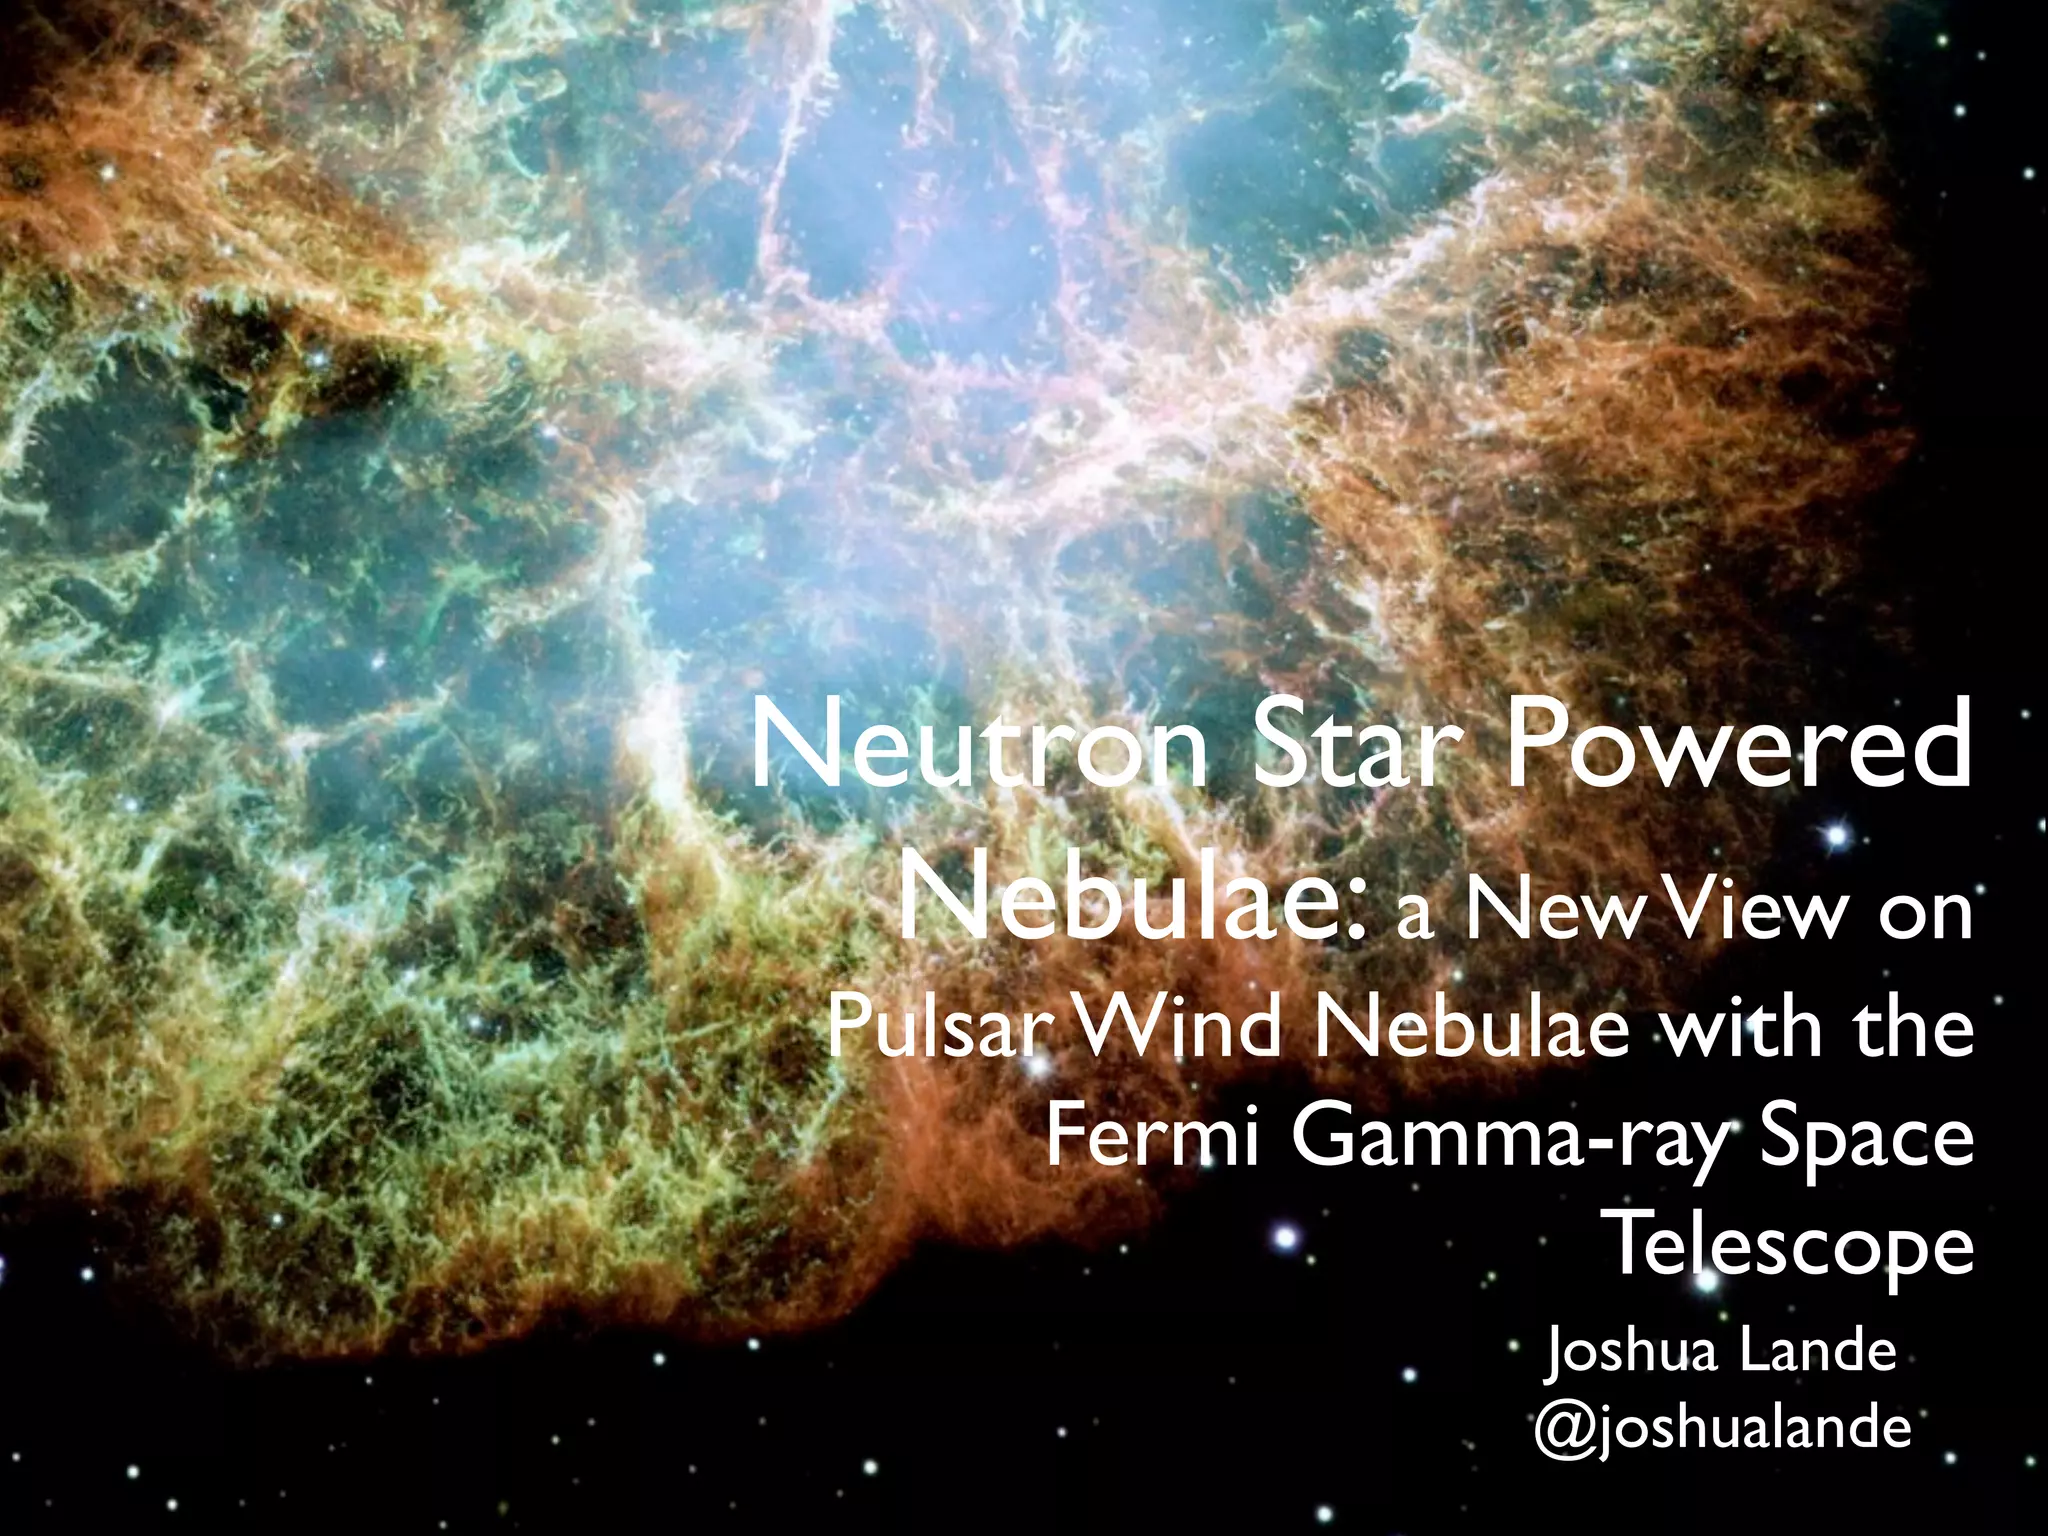
HESS J1837-069](https://image.slidesharecdn.com/neutronstarpowerednebulae-130731000405-phpapp02/85/Neutron-Star-Powered-Nebulae-61-320.jpg)
![1 000
0 300
0 000
0 300
b
331 300
332 000
332 300
333 000
l
0
30
60
90
120
150
180
210
240
270
counts/[deg]2
HESS J1616−508](https://image.slidesharecdn.com/neutronstarpowerednebulae-130731000405-phpapp02/85/Neutron-Star-Powered-Nebulae-62-320.jpg)
![1
0
1
b
336337
l
0
30
60
90
120
150
180
210
240
270
counts/[deg]2
HESS J1632-478](https://image.slidesharecdn.com/neutronstarpowerednebulae-130731000405-phpapp02/85/Neutron-Star-Powered-Nebulae-63-320.jpg)
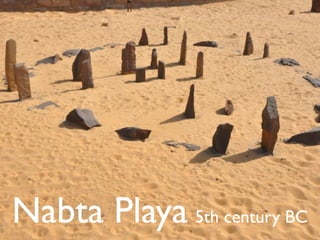
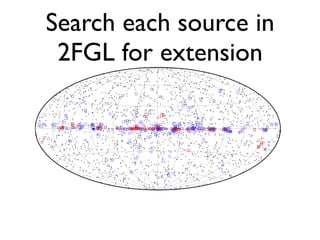
![Is it a pulsar or a PWN?Grondin et al.
Energy [MeV]
3
10 4
10
5
10
6
10 7
10
]-1s-2
dN/dE[ergcm2
E
-12
10
-11
10
-10
10
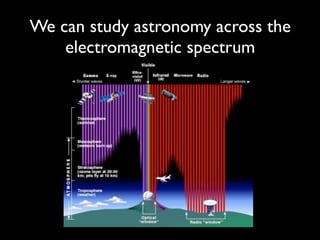
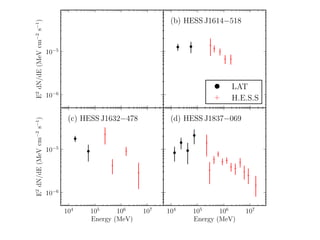
pectral energy distribution of HESS J1825−137 in gamma-rays. The LAT spectral points (in red) are obtained using the maximum likelihood
described in section 4.2 in 6 logarithmically-spaced energy bins. The statistical errors are shown in red, while the black lines take into account both
nd systematic errors as discussed in section 4.2. The red solid line presents the result obtained by fitting a power-law to the data in the 1 – 100 GeV
using a maximum likelihood fit. A 95 % C.L. upper limit is computed when the statistical significance is lower than 3 σ. The H.E.S.S. results are
blue (Aharonian et al. 2006).
pulsar, we fix the initial spin period at 10 ms and
ex at 2.5, yielding an age of 26 kyr for the sys-
simple injection spectrum slightly underestimates
ata but the overall fit is still reasonable. For the
of 26 kyr, we require a power-law index of 1.9,
57 TeV and a magnetic field of 4 µG. The corre-
sult is presented in Figure 4 (Top).
option to fit the multi-wavelength data is adopting
tic Maxwellian plus power-law tail electron spec-
sed by Spitkovsky (2008). For this injection spec-
sume a bulk gamma-factor (γ0) for the PWN wind
f the termination shock. At the termination shock
t pressure balances the wind pressure, fully ther-
e wind; in this case the downstream post-shock
= (γ0 − 1)/2. One could also interpret this as
e temperature kT of mec2
(γ0 − 1)/2. Per the
of Spitkovsky (2008), a power-law tail begins at
mec2
γ0, and suffers an exponential cutoff at some
The Fermi LAT Collaboration acknowledges generous ongoing support
from a number of agencies and institutes that have supported both the de-
velopment and the operation of the LAT as well as scientific data analysis.
These include the National Aeronautics and Space Administration and the
Department of Energy in the United States, the Commissariat `a l’Energie
Atomique and the Centre National de la Recherche Scientifique / Institut Na-
tional de Physique Nucl´eaire et de Physique des Particules in France, the
Agenzia Spaziale Italiana, the Istituto Nazionale di Fisica Nucleare, and the
Istituto Nazionale di Astrofisica in Italy, the Ministry of Education, Culture,
Sports, Science and Technology (MEXT), High Energy Accelerator Research
Organization (KEK) and Japan Aerospace Exploration Agency (JAXA) in
Japan, and the K. A. Wallenberg Foundation and the Swedish National Space
Board in Sweden. Additional support for science analysis during the opera-
tions phase from the following agencies is also gratefully acknowledged: the
Instituto Nazionale di Astrofisica in Italy and the Centre National d’´Etudes
Spatiales in France.
The Nanc¸ay Radio Observatory is operated by the Paris Observatory, associ-
ated with the French Centre National de la Recherche Scientifique (CNRS).
The Lovell Telescope is owned and operated by the University of Manchester
as part of the Jodrell Bank Centre for Astrophysics with support from the
Science and Technology Facilities Council of the United Kingdom.
The Parkes radio telescope is part of the Australia Telescope which is funded
– 37 –
Energy (MeV)
2
10
3
10
4
10
]-1
s-2
dN/dE[ergcm2
E
-11
10
-10
10
1
]-1
s-2
dN/dE[ergcm2
E
-12
10
-11
10
Energy (MeV)
2
10
3
10 10
]-1
s-2
dN/dE[ergcm2
E
-12
10
-11
10
4 Grondin et al.
HESS J1825-137
(Grondin et al 2011)
PSR J2021+4026
Ackermann et al 2010
HESS J1825-137
(Grondin et al 2011)
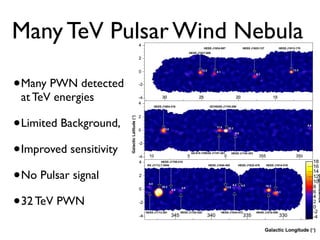
Spectral Shape:
• Pulsars are cutoff
• PWN rising spectrum
Morphology
• Pulsars are point sources
• PWN could be extended](https://image.slidesharecdn.com/neutronstarpowerednebulae-130731000405-phpapp02/85/Neutron-Star-Powered-Nebulae-68-320.jpg)

![HESS J1303-613
1
0
1
b
262728
l
0
20
40
60
80
100
120
140
160
180
counts/[deg]2
HESS J1841-055
1
0
b
292293
l
0
10
20
30
40
50
60
70
80
90
counts/[deg]2
HESS J1119-614 HESS J1356-645
0
1
b
313314
l
0
25
50
75
100
125
150
175
200
225 counts/[deg]2
HESS J1420-607](https://image.slidesharecdn.com/neutronstarpowerednebulae-130731000405-phpapp02/85/Neutron-Star-Powered-Nebulae-74-320.jpg)

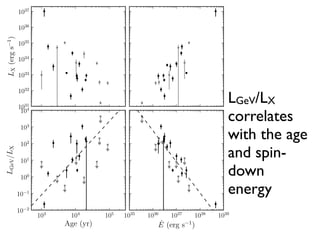
![102
103
104
105
106
107
108
109
1010
1011
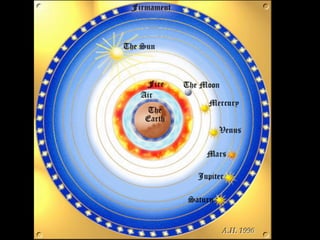
⌧C [years]
1028
1029
1030
1031
1032
1033
1034
1035
1036
1037
1038
1039
˙E[ergs1
]
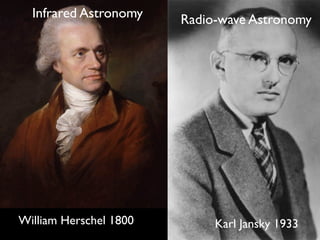
LAT Detects
PWN from
young and
highly-
energetic
pulsars](https://image.slidesharecdn.com/neutronstarpowerednebulae-130731000405-phpapp02/85/Neutron-Star-Powered-Nebulae-77-320.jpg)


![[PDF] Mauritius2017 - Testing strong-field gravity with pulsar timing & gravi...](https://cdn.slidesharecdn.com/ss_thumbnails/mauritiusshao-171101223749-thumbnail.jpg?width=640&height=640&fit=bounds)