Download to read offline
![The Characterization of the Gamma-Ray Signal from the Central Milky Way:
A Compelling Case for Annihilating Dark Matter
Tansu Daylan,1
Douglas P. Finkbeiner,1, 2
Dan Hooper,3, 4
Tim Linden,5
Stephen K. N. Portillo,2
Nicholas L. Rodd,6
and Tracy R. Slatyer6, 7
1
Department of Physics, Harvard University, Cambridge, MA
2
Harvard-Smithsonian Center for Astrophysics, Cambridge, MA
3
Fermi National Accelerator Laboratory, Theoretical Astrophysics Group, Batavia, IL
4
University of Chicago, Department of Astronomy and Astrophysics, Chicago, IL
5
University of Chicago, Kavli Institute for Cosmological Physics, Chicago, IL
6
Center for Theoretical Physics, Massachusetts Institute of Technology, Boston, MA
7
School of Natural Sciences, Institute for Advanced Study, Princeton, NJ
Past studies have identified a spatially extended excess of ∼1-3 GeV gamma rays from the re-
gion surrounding the Galactic Center, consistent with the emission expected from annihilating dark
matter. We revisit and scrutinize this signal with the intention of further constraining its character-
istics and origin. By applying cuts to the Fermi event parameter CTBCORE, we suppress the tails
of the point spread function and generate high resolution gamma-ray maps, enabling us to more
easily separate the various gamma-ray components. Within these maps, we find the GeV excess
to be robust and highly statistically significant, with a spectrum, angular distribution, and overall
normalization that is in good agreement with that predicted by simple annihilating dark matter
models. For example, the signal is very well fit by a 36-51 GeV dark matter particle annihilating to
b¯b with an annihilation cross section of σv = (1−3)×10−26
cm3
/s (normalized to a local dark matter
density of 0.4 GeV/cm3
). Furthermore, we confirm that the angular distribution of the excess is
approximately spherically symmetric and centered around the dynamical center of the Milky Way
(within ∼0.05◦
of Sgr A∗
), showing no sign of elongation along the Galactic Plane. The signal is
observed to extend to at least 10◦
from the Galactic Center, disfavoring the possibility that this
emission originates from millisecond pulsars.
PACS numbers: 95.85.Pw, 98.70.Rz, 95.35.+d; FERMILAB-PUB-14-032-A, MIT-CTP 4533
I. INTRODUCTION
Weakly interacting massive particles (WIMPs) are a
leading class of candidates for the dark matter of our uni-
verse. If the dark matter consists of such particles, then
their annihilations are predicted to produce potentially
observable fluxes of energetic particles, including gamma
rays, cosmic rays, and neutrinos. Of particular interest
are gamma rays from the region of the Galactic Center
which, due to its proximity and high dark matter density,
is expected to be the brightest source of dark matter an-
nihilation products on the sky, hundreds of times brighter
than the most promising dwarf spheroidal galaxies.
Over the past few years, several groups analyzing data
from the Fermi Gamma-Ray Space Telescope have re-
ported the detection of a gamma-ray signal from the in-
ner few degrees around the Galactic Center (correspond-
ing to a region several hundred parsecs in radius), with a
spectrum and angular distribution compatible with that
anticipated from annihilating dark matter particles [1–7].
More recently, this signal was shown to also be present
throughout the larger Inner Galaxy region, extending
kiloparsecs from the center of the Milky Way [8, 9]. While
the spectrum and morphology of the Galactic Center and
Inner Galaxy signals have been shown to be compatible
with that predicted from the annihilations of an approx-
imately 30-40 GeV WIMP annihilating to quarks (or a
∼7-10 GeV WIMP annihilating significantly to tau lep-
tons), other explanations have also been proposed. In
particular, it has been argued that if our galaxy’s central
stellar cluster contains several thousand unresolved mil-
lisecond pulsars, they might be able to account for the
emission observed from the Galactic Center [2, 4–7, 10].
The realization that this signal extends well beyond the
boundaries of the central stellar cluster [8, 9] disfavors
such interpretations, however. In particular, pulsar pop-
ulation models capable of producing the observed emis-
sion from the Inner Galaxy invariably predict that Fermi
should have resolved a much greater number of such ob-
jects. Accounting for this constraint, Ref. [11] concluded
that no more than ∼5-10% of the anomalous gamma-
ray emission from the Inner Galaxy can originate from
pulsars. Furthermore, while it has been suggested that
the Galactic Center signal might result from cosmic-ray
interactions with gas [2, 4–6], the analyses of Refs. [12]
and [13] find that measured distributions of gas provide
a poor fit to the morphology of the observed signal. It
also appears implausible that such processes could ac-
count for the more spatially extended emission observed
from throughout the Inner Galaxy.
In this study, we revisit the anomalous gamma-ray
emission from the Galactic Center and the Inner Galaxy
regions and scrutinize the Fermi data in an effort to con-
strain and characterize this signal more definitively, with
the ultimate goal being to confidently determine its ori-
gin. One way in which we expand upon previous work
arXiv:1402.6703v2[astro-ph.HE]17Mar2015](https://image.slidesharecdn.com/thecharacterizationofthegammaraysignalfromthecentralmilkwayacompelingcaseforannihilatingdarkmatter-160401005304/85/The-characterization-of_the_gamma_ray_signal_from_the_central_milk_way_a_compeling_case__for_annihilating_dark_m_atter-1-320.jpg)
![The Characterization of the Gamma-Ray Signal from the Central Milky Way:
A Compelling Case for Annihilating Dark Matter
Tansu Daylan,1
Douglas P. Finkbeiner,1, 2
Dan Hooper,3, 4
Tim Linden,5
Stephen K. N. Portillo,2
Nicholas L. Rodd,6
and Tracy R. Slatyer6, 7
1
Department of Physics, Harvard University, Cambridge, MA
2
Harvard-Smithsonian Center for Astrophysics, Cambridge, MA
3
Fermi National Accelerator Laboratory, Theoretical Astrophysics Group, Batavia, IL
4
University of Chicago, Department of Astronomy and Astrophysics, Chicago, IL
5
University of Chicago, Kavli Institute for Cosmological Physics, Chicago, IL
6
Center for Theoretical Physics, Massachusetts Institute of Technology, Boston, MA
7
School of Natural Sciences, Institute for Advanced Study, Princeton, NJ
Past studies have identified a spatially extended excess of ∼1-3 GeV gamma rays from the re-
gion surrounding the Galactic Center, consistent with the emission expected from annihilating dark
matter. We revisit and scrutinize this signal with the intention of further constraining its character-
istics and origin. By applying cuts to the Fermi event parameter CTBCORE, we suppress the tails
of the point spread function and generate high resolution gamma-ray maps, enabling us to more
easily separate the various gamma-ray components. Within these maps, we find the GeV excess
to be robust and highly statistically significant, with a spectrum, angular distribution, and overall
normalization that is in good agreement with that predicted by simple annihilating dark matter
models. For example, the signal is very well fit by a 36-51 GeV dark matter particle annihilating to
b¯b with an annihilation cross section of σv = (1−3)×10−26
cm3
/s (normalized to a local dark matter
density of 0.4 GeV/cm3
). Furthermore, we confirm that the angular distribution of the excess is
approximately spherically symmetric and centered around the dynamical center of the Milky Way
(within ∼0.05◦
of Sgr A∗
), showing no sign of elongation along the Galactic Plane. The signal is
observed to extend to at least 10◦
from the Galactic Center, disfavoring the possibility that this
emission originates from millisecond pulsars.
PACS numbers: 95.85.Pw, 98.70.Rz, 95.35.+d; FERMILAB-PUB-14-032-A, MIT-CTP 4533
I. INTRODUCTION
Weakly interacting massive particles (WIMPs) are a
leading class of candidates for the dark matter of our uni-
verse. If the dark matter consists of such particles, then
their annihilations are predicted to produce potentially
observable fluxes of energetic particles, including gamma
rays, cosmic rays, and neutrinos. Of particular interest
are gamma rays from the region of the Galactic Center
which, due to its proximity and high dark matter density,
is expected to be the brightest source of dark matter an-
nihilation products on the sky, hundreds of times brighter
than the most promising dwarf spheroidal galaxies.
Over the past few years, several groups analyzing data
from the Fermi Gamma-Ray Space Telescope have re-
ported the detection of a gamma-ray signal from the in-
ner few degrees around the Galactic Center (correspond-
ing to a region several hundred parsecs in radius), with a
spectrum and angular distribution compatible with that
anticipated from annihilating dark matter particles [1–7].
More recently, this signal was shown to also be present
throughout the larger Inner Galaxy region, extending
kiloparsecs from the center of the Milky Way [8, 9]. While
the spectrum and morphology of the Galactic Center and
Inner Galaxy signals have been shown to be compatible
with that predicted from the annihilations of an approx-
imately 30-40 GeV WIMP annihilating to quarks (or a
∼7-10 GeV WIMP annihilating significantly to tau lep-
tons), other explanations have also been proposed. In
particular, it has been argued that if our galaxy’s central
stellar cluster contains several thousand unresolved mil-
lisecond pulsars, they might be able to account for the
emission observed from the Galactic Center [2, 4–7, 10].
The realization that this signal extends well beyond the
boundaries of the central stellar cluster [8, 9] disfavors
such interpretations, however. In particular, pulsar pop-
ulation models capable of producing the observed emis-
sion from the Inner Galaxy invariably predict that Fermi
should have resolved a much greater number of such ob-
jects. Accounting for this constraint, Ref. [11] concluded
that no more than ∼5-10% of the anomalous gamma-
ray emission from the Inner Galaxy can originate from
pulsars. Furthermore, while it has been suggested that
the Galactic Center signal might result from cosmic-ray
interactions with gas [2, 4–6], the analyses of Refs. [12]
and [13] find that measured distributions of gas provide
a poor fit to the morphology of the observed signal. It
also appears implausible that such processes could ac-
count for the more spatially extended emission observed
from throughout the Inner Galaxy.
In this study, we revisit the anomalous gamma-ray
emission from the Galactic Center and the Inner Galaxy
regions and scrutinize the Fermi data in an effort to con-
strain and characterize this signal more definitively, with
the ultimate goal being to confidently determine its ori-
gin. One way in which we expand upon previous work
arXiv:1402.6703v2[astro-ph.HE]17Mar2015](https://image.slidesharecdn.com/thecharacterizationofthegammaraysignalfromthecentralmilkwayacompelingcaseforannihilatingdarkmatter-160401005304/75/The-characterization-of_the_gamma_ray_signal_from_the_central_milk_way_a_compeling_case__for_annihilating_dark_m_atter-1-2048.jpg)
![2
is by selecting photons based on the value of the Fermi
event parameter CTBCORE. Through the application of
this cut, we select only those events with more reliable
directional reconstruction, allowing us to better separate
the various gamma-ray components, and to better limit
the degree to which emission from the Galactic Disk leaks
into the regions studied in our Inner Galaxy analysis. We
produce a new and robust determination of the spectrum
and morphology of the Inner Galaxy and the Galactic
Center signals. We go on to apply a number of tests to
this data, and determine that the anomalous emission in
question agrees well with that predicted from the anni-
hilations of a 36-51 GeV WIMP annihilating mostly to b
quarks (or a somewhat lower mass WIMP if its annihila-
tions proceed to first or second generation quarks). Our
results now appear to disfavor the previously considered
7-10 GeV mass window in which the dark matter annihi-
lates significantly to tau leptons [2, 4, 6–8] (the analysis
of Ref. [6] also disfavored this scenario). The morphol-
ogy of the signal is consistent with spherical symmetry,
and strongly disfavors any significant elongation along
the Galactic Plane. The emission decreases with the dis-
tance to the Galactic Center at a rate consistent with a
dark matter halo profile which scales as ρ ∝ r−γ
, with
γ ≈ 1.1 − 1.3. The signal can be identified out to an-
gles of 10◦
from the Galactic Center, beyond which
systematic uncertainties related to the Galactic diffuse
model become significant. The annihilation cross section
required to normalize the observed signal is σv ∼ 10−26
cm3
/s, in good agreement with that predicted for dark
matter in the form of a simple thermal relic.
The remainder of this article is structured as follows.
In the following section, we review the calculation of the
spectrum and angular distribution of gamma rays pre-
dicted from annihilating dark matter. In Sec. III, we
describe the event selection used in our analysis, includ-
ing the application of cuts on the Fermi event parameter
CTBCORE. In Secs. IV and V, we describe our analyses
of the Inner Galaxy and Galactic Center regions, respec-
tively. In each of these analyses, we observe a significant
gamma-ray excess, with a spectrum and morphology in
good agreement with that predicted from annihilating
dark matter. We further investigate the angular distribu-
tion of this emission in Sec. VI, and discuss the dark mat-
ter interpretation of this signal in Sec. VII. In Sec. VIII
we discuss the implications of these observations, and of-
fer predictions for other upcoming observations. Finally,
we summarize our results and conclusions in Sec. IX. In
the paper’s appendices, we include supplemental mate-
rial intended for those interested in further details of our
analysis.
II. GAMMA RAYS FROM DARK MATTER
ANNIHILATIONS IN THE HALO OF THE
MILKY WAY
Dark matter searches using gamma-ray telescopes have
a number of advantages over other indirect detection
strategies. Unlike signals associated with cosmic rays
(electrons, positrons, antiprotons, etc), gamma rays are
not deflected by magnetic fields. Furthermore, gamma-
ray energy losses are negligible on galactic scales. As
a result, gamma-ray telescopes can potentially acquire
both spectral and spatial information, unmolested by as-
trophysical effects.
The flux of gamma rays generated by annihilating dark
matter particles, as a function of the direction observed,
ψ, is given by:
Φ(Eγ, ψ) =
σv
8πm2
X
dNγ
dEγ los
ρ2
(r) dl, (1)
where mX is the mass of the dark matter particle, σv is
the annihilation cross section (times the relative velocity
of the particles), dNγ/dEγ is the gamma-ray spectrum
produced per annihilation, and the integral of the den-
sity squared is performed over the line-of-sight (los). Al-
though N-body simulations lead us to expect dark matter
halos to exhibit some degree of triaxiality (see [14] and
references therein), the Milky Way’s dark matter distri-
bution is generally assumed to be approximately spheri-
cally symmetric, allowing us to describe the density as a
function of only the distance from the Galactic Center,
r. Throughout this study, we will consider dark matter
distributions described by a generalized Navarro-Frenk-
White (NFW) halo profile [15, 16]:
ρ(r) = ρ0
(r/rs)−γ
(1 + r/rs)3−γ
. (2)
Throughout this paper, we adopt a scale radius of rs = 20
kpc, and select ρ0 such that the local dark matter density
(at 8.5 kpc from the Galactic Center) is 0.4 GeV/cm3
,
consistent with dynamical constraints [17, 18]. Although
dark matter-only simulations generally favor inner slopes
near the canonical NFW value (γ = 1) [19, 20], baryonic
effects are expected to have a non-negligible impact on
the dark matter distribution within the inner ∼10 kilo-
parsecs of the Milky Way [21–31]. The magnitude and
direction of such baryonic effects, however, are currently
a topic of debate. With this in mind, we remain agnostic
as to the value of the inner slope, and take γ to be a free
parameter.
In the left frame of Fig. 1, we plot the density of dark
matter as a function of r for several choices of the halo
profile. Along with generalized NFW profiles using three
values of the inner slope (γ=1.0, 1.2, 1.4), we also show
for comparison the results for an Einasto profile (with
α = 0.17) [32]. In the right frame, we plot the value of
the integral in Eq. 1 for the same halo profiles, denoted](https://image.slidesharecdn.com/thecharacterizationofthegammaraysignalfromthecentralmilkwayacompelingcaseforannihilatingdarkmatter-160401005304/85/The-characterization-of_the_gamma_ray_signal_from_the_central_milk_way_a_compeling_case__for_annihilating_dark_m_atter-2-320.jpg)
![3
FIG. 1: Left frame: The dark matter density as a function of the distance to the Galactic Center, for several halo profiles,
each normalized such that ρ = 0.4 GeV/cm3
at r = 8.5 kpc. Right frame: The line-of-sight integral of the density squared, as
defined in Eq. 3, for the same set of halo profiles, as a function of the angular distance from the Galactic Center, ψ.
FIG. 2: Left frame: The spectrum of gamma rays produced per dark matter annihilation for a 30 GeV WIMP mass and a
variety of annihilation channels. Right frame: An estimate for the bremsstrahlung emission from the electrons produced in dark
matter annihilations taking place near the Galactic Center, for the case of a 30 GeV WIMP annihilating to b¯b. At |z| <∼ 0.3 kpc
(|b| <∼ 2◦
) and at energies below ∼1-2 GeV, bremsstrahlung could potentially contribute non-negligibly. See text for details.
by the quantity, J(ψ):
J(ψ) =
los
ρ2
(r) dl, (3)
where ψ is the angle observed away from the Galactic
Center. In the NFW case (with γ = 1), for example,
the value of J averaged over the inner degree around
the Galactic Center exceeds that of the most promising
dwarf spheroidal galaxies by a factor of ∼50 [33]. If the
Milky Way’s dark matter halo is contracted by baryons
or is otherwise steeper than predicted by NFW, this ratio
could easily be ∼103
or greater.
The spectrum of gamma rays produced per dark mat-
ter annihilation, dNγ/dEγ, depends on the mass of the
dark matter particle and on the types of particles pro-
duced in this process. In the left frame of Fig. 2, we
plot dNγ/dEγ for the case of a 30 GeV WIMP mass, and
for a variety of annihilation channels (as calculated using
PYTHIA [34], except for the e+
e−
case, for which the
final state radiation was calculated analytically [35, 36]).
In each case, a distinctive bump-like feature appears, al-
though at different energies and with different widths,
depending on the final state.
In addition to prompt gamma rays, dark matter an-
nihilations can produce electrons and positrons which
subsequently generate gamma rays via inverse Compton
and bremsstrahlung processes. For dark matter annihi-
lations taking place near the Galactic Plane, the low-
energy gamma-ray spectrum can receive a non-negligible
contribution from bremsstrahlung. In the right frame
of Fig. 2, we plot the gamma-ray spectrum from dark
matter (per annihilation), including an estimate for the](https://image.slidesharecdn.com/thecharacterizationofthegammaraysignalfromthecentralmilkwayacompelingcaseforannihilatingdarkmatter-160401005304/85/The-characterization-of_the_gamma_ray_signal_from_the_central_milk_way_a_compeling_case__for_annihilating_dark_m_atter-3-320.jpg)
![4
0 1 2 3
Radius (degrees)
0.001
0.010
0.100
1.000Intensity(normalized)
Eγ = 0.42 GeV
0.0 0.2 0.4 0.6 0.8 1.0
Radius (degrees)
0.001
0.010
0.100
1.000
Eγ = 1.33 GeV
0.0 0.1 0.2 0.3
Radius (degrees)
0.001
0.010
0.100
1.000
Eγ = 7.50 GeV
FIG. 3: The point spread function (PSF) of the Fermi Gamma-Ray Space Telescope, for front-converting, Ultraclean class
events. The solid lines represent the PSF for the full dataset, using the Fermi Collaboration’s default cuts on the parameter
CTBCORE. The dotted and dashed lines, in contrast, denote the PSFs for the top two quartiles (Q2) and top quartile (Q1) of
these events, respectively, as ranked by CTBCORE. See text for details.
bremsstrahlung contribution. In estimating the contribu-
tion from bremsstrahlung, we neglect diffusion, but oth-
erwise follow the calculation of Ref. [37]. In particular,
we consider representative values of B = 10 µG for the
magnetic field, and 10 eV/cm3
for the radiation density
throughout the region of the Galactic Center. For the
distribution of gas, we adopt a density of 10 particles per
cm3
near the Galactic Plane (z = 0), with a dependence
on z given by exp(−|z|/0.15 kpc). Within ∼1◦
– 2◦
of the
Galactic Plane, we find that bremsstrahlung could poten-
tially contribute non-negligibly to the low energy (<∼ 1–2
GeV) gamma-ray spectrum from annihilating dark mat-
ter.
III. MAKING HIGHER RESOLUTION
GAMMA-RAY MAPS WITH CTBCORE
In most analyses of Fermi data, one makes use of all
of the events within a given class (Transient, Source,
Clean, or Ultraclean). Each of these event classes reflects
a different trade-off between the effective area and the
efficiency of cosmic-ray rejection. Higher quality event
classes also allow for somewhat greater angular resolu-
tion (as quantified by the point spread function, PSF).
The optimal choice of event class for a given analysis
depends on the nature of the signal and background in
question. The Ultraclean event class, for example, is well
suited to the study of large angular regions, and to sit-
uations where the analysis is sensitive to spectral fea-
tures that might be caused by cosmic ray backgrounds.
The Transient event class, in contrast, is best suited for
analyses of short duration events, with little background.
Searches for dark matter annihilation products from the
Milky Way’s halo significantly benefit from the high back-
ground rejection and angular resolution of the Ultraclean
class and thus can potentially fall into the former cate-
gory.
As a part of event reconstruction, the Fermi Collabora-
tion estimates the accuracy of the reconstructed direction
of each event. Inefficiencies and inactive regions within
the detector reduce the quality of the information avail-
able for certain events. Factors such as whether an event
is front-converting or back-converting, whether there are
multiple tracks that can be combined into a vertex, and
the amount of energy deposited into the calorimeter each
impact the reliability of the reconstructed direction [38].
In their most recent public data releases, the Fermi
Collaboration has begun to include a greater body of
information about each event, including a value for the
parameter CTBCORE, which quantifies the reliability of
the directional reconstruction. By selecting only events
with a high value of CTBCORE, one can reduce the tails
of the PSF, although at the expense of effective area [38].
For this study, we have created a set of new event
classes by increasing the CTBCORE cut from the de-
fault values used by the Fermi Collaboration. To ac-
complish this, we divided all front-converting, Ultraclean
events (Pass 7, Reprocessed) into quartiles, ranked by
CTBCORE. Those events in the top quartile make up the
event class Q1, while those in the top two quartiles make
up Q2, etc. For each new event class, we calibrate the
on-orbit PSF [39, 40] using the Geminga pulsar. Taking
advantage of Geminga’s pulsation, we remove the back-
ground by taking the difference between the on-phase
and off-phase images. We fit the PSF in each energy bin
by a single King function, and smooth the overall PSF
with energy. We also rescale Fermi’s effective area ac-
cording to the fraction of events that are removed by the
CTBCORE cut, as a function of energy and incidence
angle.
These cuts on CTBCORE have a substantial impact
on Fermi’s PSF, especially at low energies. In Fig. 3,](https://image.slidesharecdn.com/thecharacterizationofthegammaraysignalfromthecentralmilkwayacompelingcaseforannihilatingdarkmatter-160401005304/85/The-characterization-of_the_gamma_ray_signal_from_the_central_milk_way_a_compeling_case__for_annihilating_dark_m_atter-4-320.jpg)
![5
180 90 0 -90 -18000
-90
-45
0
45
90
00
-5
-4
-3
-2
-1
0
-5
-4
-3
-2
-1
0
180 90 0 -90 -18000
-90
-45
0
45
90
00
-5
-4
-3
-2
-1
0
-5
-4
-3
-2
-1
0
180 90 0 -90 -18000
-90
-45
0
45
90
00
-5
-4
-3
-2
-1
0
-5
-4
-3
-2
-1
0
FIG. 4: The spatial templates (in galactic coordinates) for the Galactic diffuse model (upper left), the Fermi bubbles (upper
right), and dark matter annihilation products (lower), as used in our Inner Galaxy analysis. The scale is logarithmic (base
10), normalized to the brightest point in each map. The diffuse model template is shown as evaluated at 1 GeV, and the dark
matter template corresponds to a generalized NFW profile with an inner slope of γ = 1.18. Red dashed lines indicate the
boundaries of our standard Region of Interest (we also mask bright point sources and the region of the Galactic plane with
|b| < 1◦
).
we show the PSF for front-converting, Ultraclean events,
at three representative energies, for different cuts on
CTBCORE (all events, Q2, and Q1). Such a cut can
be used to mitigate the leakage of astrophysical emis-
sion from the Galactic Plane and point sources into our
regions of interest. This leakage is most problematic at
low energies, where the PSF is quite broad and where the
CTBCORE cut has the greatest impact. These new event
classes and their characterization are further detailed in
[41], and accompanied by a data release of all-sky maps
for each class, and the instrument response function files
necessary for use with the Fermi Science Tools.
Throughout the remainder of this study, we will em-
ploy the Q2 event class by default, corresponding to the
top 50% (by CTBCORE) of Fermi’s front-converting, Ul-
traclean photons, to maximize event quality. We select
Q2 rather than Q1 to improve statistics, since as demon-
strated in Fig. 3, the angular resolution improvement in
moving from Q2 to Q1 is minimal. In Appendix A we
demonstrate that our results are stable upon removing
the CTBCORE cut (thus doubling the dataset), or ex-
panding the dataset to include lower-quality events.1
1 An earlier version of this work found a number of apparent
peculiarities in the results without the CTBCORE cut that
were removed on applying the cut. However, we now attribute
those peculiarities to an incorrect smoothing of the diffuse back-
IV. THE INNER GALAXY
In this section, we follow the procedure previously pur-
sued in Ref. [8] (see also Refs. [42, 43]) to study the
gamma-ray emission from the Inner Galaxy. We use the
term “Inner Galaxy” to denote the region of the sky that
lies within several tens of degrees around the Galactic
Center, excepting the Galactic Plane itself (|b| < 1◦
),
which we mask in this portion of our analysis.
Throughout our analysis, we make use of the Pass 7
(V15) reprocessed data taken between August 4, 2008
and December 5, 2013, using only front-converting, Ul-
traclean class events which pass the Q2 CTBCORE cut
as described in Sec. III. We also apply standard cuts to
ensure data quality (zenith angle < 100◦
, instrumental
rocking angle < 52◦
, DATA QUAL = 1, LAT CONFIG=1).
Using this data set, we have generated a series of maps
of the gamma-ray sky binned in energy. We apply the
point source subtraction method described in Ref. [43],
ground model. When the background model is smoothed cor-
rectly, we find results that are much more stable to the choice
of CTBCORE cut, and closely resemble the results previously
obtained with Q2 events. Accordingly, the CTBCORE cut ap-
pears to be effective at separating signal from poorly-modeled
background emission, but is less necessary when the background
is well-modeled.](https://image.slidesharecdn.com/thecharacterizationofthegammaraysignalfromthecentralmilkwayacompelingcaseforannihilatingdarkmatter-160401005304/85/The-characterization-of_the_gamma_ray_signal_from_the_central_milk_way_a_compeling_case__for_annihilating_dark_m_atter-5-320.jpg)
![6
updated to employ the 2FGL catalogue, and masking out
the 300 brightest and most variable sources at a mask
radius corresponding to 95% containment. We then per-
form a pixel-based maximum likelihood analysis on the
map, fitting the data in each energy bin to a sum of spa-
tial templates. These templates consist of: 1) the Fermi
Collaboration p6v11 Galactic diffuse model (which we
refer to as the Pass 6 Diffuse Model),2
2) an isotropic
map, intended to account for the extragalactic gamma-
ray background and residual cosmic-ray contamination,
and 3) a uniform-brightness spatial template coincident
with the features known as the Fermi Bubbles, as de-
scribed in Ref. [43]. In addition to these three back-
ground templates, we include an additional dark matter
template, motivated by the hypothesis that the previ-
ously reported gamma-ray excess originates from annihi-
lating dark matter. In particular, our dark matter tem-
plate is taken to be proportional to the line-of-sight inte-
gral of the dark matter density squared, J(ψ), for a gen-
eralized NFW density profile (see Eqs. 2–3). The spatial
morphology of the Galactic diffuse model (as evaluated
at 1 GeV), Fermi Bubbles, and dark matter templates
are each shown in Fig. 4.
We smooth the Galactic diffuse model template to
match the data using the gtsrcmaps routine in the Fermi
Science Tools, to ensure that the tails of the point spread
function are properly taken into account.3
Because the
Galactic diffuse model template is much brighter than
the other contributions in the region of interest, relatively
small errors in its smoothing could potentially bias our
results. However, the other templates are much fainter,
and so we simply perform a Gaussian smoothing, with a
FWHM matched to the FWHM of the Fermi PSF at the
minimum energy for the bin (since most of the counts are
close to this minimum energy).
By default, we employ a Region of Interest (ROI) of
| | < 20◦
, 1◦
< |b| < 20◦
. An earlier version of this work
used the full sky (with the plane masked at 1 degree)
as the default ROI; we find that restricting to a smaller
ROI alleviates oversubtraction in the inner Galaxy and
improves the stability of our results.4
Thus we present
“baseline” results for the smaller region, but show the im-
pact of changing the ROI in Appendix A, and in selected
figures in the main text. Where we refer to the “full sky”
analysis the Galactic plane is masked for |b| < 1◦
unless
noted otherwise.
As found in previous studies [8, 9], the inclusion of the
2 Unlike more recently released Galactic diffuse models, the p6v11
diffuse model does not implicitly include a component corre-
sponding to the Fermi Bubbles. By using this model, we are
free to fit the Fermi Bubbles component independently. See Ap-
pendix B for a discussion of the impact of varying the diffuse
model.
3 We checked the impact of smoothing the diffuse model with a
Gaussian and found no significant impact on our results.
4 This approach was in part inspired by the work presented in
Ref. [44].
FIG. 5: The variation in the quantity −2∆ ln L (referred to
as TS) extracted from the likelihood fit, as a function of the
inner slope of the dark matter halo profile, γ. All values are
relative to the result for the best-fit (highest TS) template,
and positive values thus indicate a reduction in TS. Results
are shown using gamma-ray data from the full sky (solid line)
and only the southern sky (dashed line). Unlike in the analysis
of Ref. [8], we do not find any large north-south asymmetry
in the preferred value of γ.
dark matter template dramatically improves the qual-
ity of the fit to the Fermi data. For the best-fit spec-
trum and halo profile, we find that the inclusion of
the dark matter template improves the formal fit by
TS≡ −2∆ ln L 1100 (here TS stands for “test statis-
tic”), corresponding to a statistical preference greater
than 30σ. When considering this enormous statistical
significance, one should keep in mind that in addition
to statistical errors there is a degree of unavoidable and
unaccounted-for systematic error, in that neither model
(with or without a dark matter component) is a “good
fit” in the sense of describing the sky to the level of Pois-
son noise. That being said, the data do very strongly
prefer the presence of a gamma-ray component with a
morphology similar to that predicted from annihilating
dark matter (see Appendices A-E for further details).
As in Ref. [8], we vary the value of the inner slope of
the generalized NFW profile, γ, and compare the change
in the log-likelihood, ∆ ln L, between the resulting fits in
order to determine the preferred range for the value of γ.5
The results of this exercise are shown in Fig. 5. We find
that our default ROI has a best-fit value of γ = 1.18, con-
sistent with previous studies of the inner Galaxy (which
did not employ any additional cuts on CTBCORE) that
preferred an inner slope of γ 1.2 [8]. Fitting over the
full sky, we find a preference for a slightly steeper value
of γ 1.28. These results are quite stable to our mask
5 Throughout, we describe the improvement in −2∆ ln L induced
by inclusion of a specific template as the “test statistic” or TS
for that template.](https://image.slidesharecdn.com/thecharacterizationofthegammaraysignalfromthecentralmilkwayacompelingcaseforannihilatingdarkmatter-160401005304/85/The-characterization-of_the_gamma_ray_signal_from_the_central_milk_way_a_compeling_case__for_annihilating_dark_m_atter-6-320.jpg)
![7
FIG. 6: Left frame: The spectrum of the dark matter component, extracted from a fit in our standard ROI (1◦
< |b| < 20◦
,
|l| < 20◦
) for a template corresponding to a generalized NFW halo profile with an inner slope of γ = 1.18 (normalized to the
flux at an angle of 5◦
from the Galactic Center). Shown for comparison (solid line) is the spectrum predicted from a 43.0 GeV
dark matter particle annihilating to b¯b with a cross section of σv = 2.25×10⁻²⁶
cm3
/s × [(0.4 GeV/cm3
)/ρlocal]2
. Right frame:
as left frame, but for a full-sky ROI (|b| > 1◦
), with γ = 1.28; shown for comparison (solid line) is the spectrum predicted from
a 36.6 GeV dark matter particle annihilating to b¯b with a cross section of σv = 0.75 × 10⁻²⁶
cm3
/s × [(0.4 GeV/cm3
)/ρlocal]2
.
of the Galactic plane; masking the region with |b| < 2◦
changes the preferred value to γ = 1.25 in our default
ROI, and γ = 1.29 over the whole sky. In contrast to
Ref. [8], we find no significant difference in the slope pre-
ferred by the fit over the standard ROI, and by a fit only
over the southern half (b < 0) of the ROI (we also find
no significant difference between the fit over the full sky
and the southern half of the full sky). This can be seen
directly from Fig. 5, where the full-sky and southern-
sky fits for the same level of masking are found to favor
quite similar values of γ (the southern sky distribution
is broader than that for the full sky simply due to the
difference in the number of photons). The best-fit values
for gamma, from fits in the southern half of the standard
ROI and the southern half of the full sky, are 1.13 and
1.26 respectively.
In Fig. 6, we show the spectrum of the emission cor-
related with the dark matter template in the default
ROI and full-sky analysis, for their respective best-fit
values of γ = 1.18 and 1.28.6
We restrict to energies
50 GeV and lower to ensure numerical stability of the
fit in the smaller ROI. While no significant emission is
absorbed by this template at energies above ∼10 GeV,
a bright and robust component is present at lower en-
ergies, peaking near ∼1-3 GeV. Relative to the analy-
sis of Ref. [8] (which used an incorrectly smoothed dif-
fuse model), our spectrum is in both cases significantly
harder at energies below 1 GeV, rendering it more con-
6 A comparison between the two ROIs with γ held constant is
presented in Appendix A.
sistent with that extracted at higher latitudes (see Ap-
pendix A).7
Shown for comparison (as a solid line) is the
spectrum predicted from (left panel) a 43.0 GeV dark
matter particle annihilating to b¯b with a cross section
of σv = 2.25 × 10⁻²⁶
cm3
/s × [(0.4 GeV/cm3
)/ρlocal]2
,
and (right panel) a 36.6 GeV dark matter particle anni-
hilating to b¯b with a cross section of σv = 0.75 × 10⁻²⁶
cm3
/s × [(0.4 GeV/cm3
)/ρlocal]2
. The spectra extracted
for this component are in moderately good agreement
with the predictions of the dark matter models, yielding
fits of χ2
= 44 and 64 over the 22 error bars between 0.3
and 50 GeV. We emphasize that these uncertainties (and
the resulting χ2
values) are purely statistical, and there
are significant systematic uncertainties which are not ac-
counted for here (see the discussion in the appendices).
We also note that the spectral shape of the dark matter
template is quite robust to variations in γ, within the
range where good fits are obtained (see Appendix A).
In Fig. 7, we plot the maps of the gamma-ray sky
in four energy ranges after subtracting the best-fit dif-
fuse model, Fermi Bubbles, and isotropic templates. In
the 0.5-1 GeV, 1-3 GeV, and 3-10 GeV maps, the dark-
matter-like emission is clearly visible in the region sur-
rounding the Galactic Center. Much less central emission
is visible at 10-50 GeV, where the dark matter compo-
nent is absent, or at least significantly less bright.
7 An earlier version of this work found this improvement only in
the presence of the CTBCORE cut; we now find this hardening
independent of the CTBCORE cut.](https://image.slidesharecdn.com/thecharacterizationofthegammaraysignalfromthecentralmilkwayacompelingcaseforannihilatingdarkmatter-160401005304/85/The-characterization-of_the_gamma_ray_signal_from_the_central_milk_way_a_compeling_case__for_annihilating_dark_m_atter-7-320.jpg)
![8
0.5-1 GeV residual
-20-1001020 00
-20
-10
0
10
20
00
0
5
10
15
20
0
5
10
15
20
10-6
counts/cm2
/s/sr
1-3 GeV residual
-20-1001020 00
-20
-10
0
10
20
00
-2
0
2
4
6
8
10
12
-2
0
2
4
6
8
10
12
10-6
counts/cm2
/s/sr
3-10 GeV residual
-20-1001020 00
-20
-10
0
10
20
00
0
1
2
3
4
0
1
2
3
4
10-6
counts/cm2
/s/sr 10-50 GeV residual
-20-1001020 00
-20
-10
0
10
20
00
0.0
0.5
1.0
1.5
0.0
0.5
1.0
1.5
10-6
counts/cm2
/s/sr
FIG. 7: Intensity maps (in galactic coordinates) after subtracting the point source model and best-fit Galactic diffuse model,
Fermi bubbles, and isotropic templates. Template coefficients are obtained from the fit including these three templates and
a γ = 1.3 DM-like template. Masked pixels are indicated in black. All maps have been smoothed to a common PSF of 2
degrees for display, before masking (the corresponding masks have not been smoothed; they reflect the actual masks used in
the analysis). At energies between ∼0.5-10 GeV (i.e. in the first three frames), the dark-matter-like emission is clearly visible
around the Galactic Center.
V. THE GALACTIC CENTER
In this section, we describe our analysis of the Fermi
data from the region of the Galactic Center, defined as
|b| < 5◦
, |l| < 5◦
. We make use of the same Pass 7 data
set, with Q2 cuts on CTBCORE, as described in the pre-
vious section. We performed a binned likelihood analysis
to this data set using the Fermi tool gtlike, dividing
the region into 200×200 spatial bins (each 0.05◦
×0.05◦
),
and 12 logarithmically-spaced energy bins between 0.316-
10.0 GeV. Included in the fit is a model for the Galac-
tic diffuse emission, supplemented by a model spatially
tracing the observed 20 cm emission [45], a model for
the isotropic gamma-ray background, and all gamma-ray
sources listed in the 2FGL catalog [46], as well as the
two additional point sources described in Ref. [47]. We
allow the flux and spectral shape of all high-significance
(
√
TS > 25) 2FGL sources located within 7◦
of the
Galactic Center to vary. For somewhat more distant or
lower significance sources (ψ = 7◦
− 8◦
and
√
TS > 25,](https://image.slidesharecdn.com/thecharacterizationofthegammaraysignalfromthecentralmilkwayacompelingcaseforannihilatingdarkmatter-160401005304/85/The-characterization-of_the_gamma_ray_signal_from_the_central_milk_way_a_compeling_case__for_annihilating_dark_m_atter-8-320.jpg)
![9
FIG. 8: The spectrum of the dark matter component derived in our Galactic Center analysis, for a template corresponding to an
NFW halo profile with an inner slope of γ = 1.2 (left) or 1.3 (right), normalized to the flux at an angle of 5◦
from the Galactic
Center. We caution that significant and difficult to estimate systematic uncertainties exist in this determination, especially at
energies below ∼1 GeV. Shown for comparison (solid line) is the spectrum predicted from a 35.25 GeV dark matter particle
annihilating to b¯b with a cross section of σv = 1.21 × 10⁻²⁶
cm3
/s × [(0.4 GeV/cm3
)/ρlocal]2
(left) or σv = 0.56 × 10⁻²⁶
cm3
/s
× [(0.4 GeV/cm3
)/ρlocal]2
(right). The dot-dash and dotted curves include an estimated contribution from bremsstrahlung, as
shown in the right frame of Fig. 2.
FIG. 9: The change in TS for the dark matter template as a
function of the inner slope of the dark matter halo profile, γ,
as found in our Galactic Center likelihood analysis. All values
are relative to the result for the best-fit (highest TS) template,
and positive values thus indicate a reduction in TS. The best-
fit value is very similar to that found in our analysis of the
larger Inner Galaxy region (in the default ROI), favoring γ ∼
1.17 (compared to γ 1.18 in the Inner Galaxy analysis).
ψ = 2◦
− 7◦
and
√
TS = 10 − 25, or ψ < 2◦
and any
TS), we adopt the best-fit spectral shape as presented in
the 2FGL catalog, but allow the overall normalization to
float. We additionally allow the spectrum and normal-
ization of the two new sources from Ref. [47], the 20 cm
template, and the extended sources W28 and W30 [46]
to float. We fix the emission from all other sources to the
best-fit 2FGL values. For the Galactic diffuse emission,
we adopt the model gal 2yearp7v6 v0. Although an up-
dated Galactic diffuse model has recently been released
by the Fermi Collaboration, that model includes addi-
tional empirically fitted features at scales greater than 2◦
,
and therefore is not recommended for studies of extended
gamma-ray emission. For the isotropic component, we
adopt the model of Ref. [48]. We allow the overall nor-
malization of the Galactic diffuse and isotropic emission
to freely vary. In our fits, we found that the isotropic
component prefers a normalization that is considerably
brighter than the extragalactic gamma-ray background.
In order to account for this additional isotropic emission
in our region of interest, we attempted simulations in
which we allowed the spectrum of the isotropic compo-
nent to vary, but found this to have a negligible impact
on the fit.
In addition to these astrophysical components, we in-
clude a spatially extended model in our fits motivated by
the possibility of annihilating dark matter. The morphol-
ogy of this component is again taken to follow the line-of-
sight integral of the square of the dark matter density, as
described in Sec. II. We adopt a generalized NFW profile
centered around the location of Sgr A∗
(b = −0.04608◦
,
l = −0.05578◦
[49]), and allow the inner slope (γ) and
overall normalization (set by the annihilation cross sec-
tion) to freely float.
In Figs. 8 and 9, we show the main results of our Galac-
tic Center likelihood analysis. In Fig. 9, we plot the
change of the log-likelihood of our fit as a function of the
inner slope of the halo profile, γ. For our best-fit value
of γ = 1.17, the inclusion of the dark matter component
can improve the overall fit with TS 300, correspond-](https://image.slidesharecdn.com/thecharacterizationofthegammaraysignalfromthecentralmilkwayacompelingcaseforannihilatingdarkmatter-160401005304/85/The-characterization-of_the_gamma_ray_signal_from_the_central_milk_way_a_compeling_case__for_annihilating_dark_m_atter-9-320.jpg)
![11
nents. In order to make a model-independent determina-
tion of the dark matter component’s spectrum, we adopt
the following procedure. First, assuming a seed spectrum
for the dark matter component, the normalization and
spectral shape of the various astrophysical components
are each varied and set to their best-fit values. Then,
the fit is performed again, allowing the spectrum of the
dark matter component to vary in each energy bin. The
resultant dark matter spectrum is then taken to be the
new seed, and this procedure is repeated iteratively until
convergence is reached.
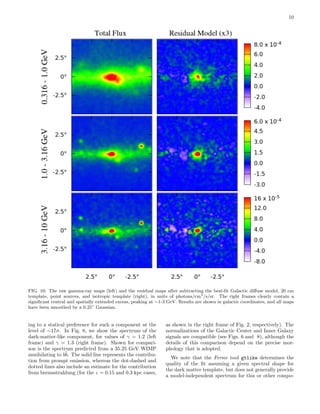
In Fig. 10, we plot the gamma-ray count maps of the
Galactic Center region. In the left frames, we show the
raw maps, while in the right frames we have subtracted
the best-fit contributions from each component in the fit
except for that corresponding to the dark matter tem-
plate (the Galactic diffuse model, 20 cm template, point
sources, and isotropic template). In each frame, the map
has been smoothed by a 0.25◦
Gaussian (0.59◦
full-width-
half-maximum). The excess emission is clearly present in
the right frames, and most evidently in the 1.0-3.16 GeV
range, where the signal is most significant.
The slope favored by our Galactic Center analysis
(γ 1.04–1.24) is very similar to that found in the In-
ner Galaxy analysis (γ 1.15-1.22). Our results are
also broadly consistent with those of the recent anal-
ysis of Ref. [7], which studied a smaller region of the
sky (|b| < 3.5◦
, |l| < 3.5◦
), and found a preference for
γ 1.12 ± 0.05. We discuss this question further in
Sec. VI.
As mentioned above, in addition to the Galactic dif-
fuse model, we include a spatial template in our Galac-
tic Center fit with a morphology tracing the 20 cm (1.5
GHz) map of Ref. [45]. This map is dominated by syn-
chrotron emission, and thus traces a convolution of the
distribution of cosmic-ray electrons and magnetic fields in
the region. As cosmic-ray electrons also generate gamma
rays via bremsstrahlung and inverse Compton processes,
the inclusion of the 20 cm template in our fit is in-
tended to better account for these sources of gamma rays.
And although the Galactic diffuse model already includes
contributions from bremsstrahlung and inverse Compton
emission, the inclusion of this additional template allows
for more flexibility in the fit. In actuality, however, we
find that this template has only a marginal impact on
the results of our fit, absorbing some of the low energy
emission that (without the 20 cm template) would have
been associated with our dark matter template.
VI. FURTHER CONSTRAINING THE
MORPHOLOGY OF THE ANOMALOUS
GAMMA-RAY EMISSION
In the previous two sections, we showed that the
gamma-ray emission observed from the regions of the
Inner Galaxy and Galactic Center is significantly bet-
ter fit when we include an additional component with
an angular distribution that follows that predicted from
annihilating dark matter. In particular, our fits favor a
morphology for this component that follows the square
of a generalized NFW halo profile with an inner slope of
γ 1.1 − 1.3. Implicit in those fits, however, was the
assumption that the angular distribution of the anoma-
lous emission is spherically symmetric with respect to the
dynamical center of the Milky Way. In this section, we
challenge this assumption and test whether other mor-
phologies might provide a better fit to the observed emis-
sion.
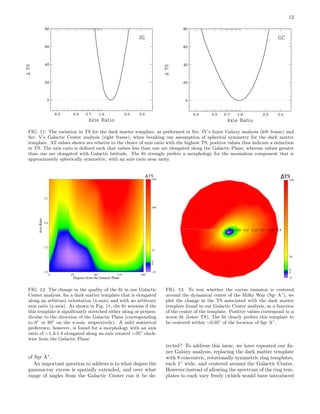
We begin by considering templates which are elon-
gated either along or perpendicular to the direction of
the Galactic Plane. In Fig. 11, we plot the change in
the TS of the Inner Galaxy (left) and Galactic Center
(right) fits with such an asymmetric template, relative
to the case of spherical symmetry. The axis ratio is de-
fined such that values less than unity are elongated in
the direction of the Galactic Plane, while values greater
than one are preferentially extended perpendicular to the
plane. The profile slope averaged over all orientations is
taken to be γ = 1.2 in both cases. From this figure, it
is clear that the gamma-ray excess in the GC prefers to
be fit by an approximately spherically symmetric distri-
bution, and disfavors any axis ratio which departs from
unity by more than approximately 20%. In the Inner
Galaxy there is a preference for a stretch perpendicular
to the plane, with an axis ratio of ∼ 1.3. As we will
discuss in Appendix A, however, there are reasons to be-
lieve this may be due to the oversubtraction of the diffuse
model along the plane, and this result is especially sen-
sitive to the choice of ROI.
In Fig. 12, we generalize this approach within our
Galactic Center analysis to test morphologies that are
not only elongated along or perpendicular to the Galac-
tic Plane, but along any arbitrary orientation. Again,
we find that that the quality of the fit worsens if the the
template is significantly elongated either along or per-
pendicular to the direction of the Galactic Plane. A mild
statistical preference is found, however, for a morphology
with an axis ratio of ∼1.3-1.4 elongated along an axis ro-
tated ∼35◦
clockwise from the Galactic Plane in galactic
coordinates.8
While this may be a statistical fluctua-
tion, or the product of imperfect background templates,
it could also potentially reflect a degree of triaxiality in
the underlying dark matter distribution.
We have also tested whether the excess emission is, in
fact, centered around the dynamical center of the Milky
Way (Sgr A∗
), as we have thus far assumed. In Fig. 13,
we plot the change in TS of the dark-matter-motivated
template, as found in our Galactic Center analysis, when
we vary the center of the template. The fit clearly prefers
this template to be centered within ∼0.05◦
of the location
8 We define a “clockwise” rotation such that a 90◦ rotation turns
+l into +b.](https://image.slidesharecdn.com/thecharacterizationofthegammaraysignalfromthecentralmilkwayacompelingcaseforannihilatingdarkmatter-160401005304/85/The-characterization-of_the_gamma_ray_signal_from_the_central_milk_way_a_compeling_case__for_annihilating_dark_m_atter-11-320.jpg)
![13
FIG. 14: To constrain the degree to which the gamma-ray ex-
cess is spatially extended, we have repeated our Inner Galaxy
analysis, replacing the dark matter template with a series of
concentric ring templates centered around the Galactic Cen-
ter. The dark-matter-like emission is clearly and consistently
present in each ring template out to ∼10◦
, beyond which sys-
tematic and statistical limitations make such determinations
difficult. For comparison, we also show the predictions for a
generalized NFW profile with γ = 1.3. The spectrum of the
rings is held fixed at that of Fig. 6, and the fluxes displayed
in the plot correspond to an energy of 2.67 GeV.
an untenable number of free parameters), we fix their
spectral shape between 0.3 GeV - 30 GeV to that found
for the dark matter component in the single template
fit. By floating the ring coefficients with a fixed spec-
tral dependence, we obtain another handle on the spatial
extent and morphology of the excess. In order to be self-
consistent we inherit the background modeling and ROI
from the Inner Galaxy analysis (except that we mask the
plane for |b| < 2◦
rather than |b| < 1◦
) and fix the spectra
of all the other templates to the best fit values from the
Inner Galaxy fit. We also break the template associated
with the Fermi Bubbles into two sub-templates, in 10◦
latitude slices (each with the same spectrum, but with
independent normalizations). We smooth the templates
to the Fermi PSF.
The results of this fit are shown in Fig. 14. The dark-
matter-like emission is clearly and consistently present in
each ring template out to ∼ 10◦
, beyond which system-
atic and statistical limitations make such determinations
difficult. In order to compare the radial dependence with
that expected from a generalized NFW profile, we weight
the properly smoothed NFW squared/projected template
with each ring to obtain ring coefficients expected from
an ideal NFW distribution. We then perform a minimum
χ2
fit on the data-driven ring coefficients taking as the
template the coefficients obtained from an NFW profile
with γ = 1.3. We exclude the two outermost outlier ring
coefficients from this fit in order to avoid systematic bias
on the preferred γ value. Since the ring templates spa-
tially overlap upon smoothing, we take into account the
correlated errors of the maximum likelihood fit, which
add to the spectral errors in quadrature. We show an
interpolation of the best fit NFW ring coefficients with
the solid line on the same figure.
We caution that systematic uncertainties associated
with the diffuse model template may be biasing this fit
toward somewhat steeper values of γ (we discuss this
question further in Appendix A, in the context of the
increased values of γ found for larger ROIs). It is also
plausible that the dark matter slope could vary with dis-
tance from the Galactic Center, for example as exhibited
by an Einasto profile [32].
To address the same question within the context of
our Galactic Center analysis, we have re-performed our
fit using dark matter templates which are based on den-
sity profiles which are set to zero beyond a given radius.
We find that templates corresponding to density profiles
set to zero outside of 800 pc (600 pc, 400 pc) provide
a fit that is worse relative to that found using an un-
truncated template at the level of ∆ TS=10.7 (57.6,108,
respectively).
We have also tested our Galactic Center fit to see if
a cored dark matter profile could also provide a good
fit to the data. We find, however, that the inclusion
of even a fairly small core is disfavored. Marginalizing
over the inner slope of the dark matter profile, we find
that flattening the density profile within a radius of 10
pc (30 pc, 50 pc, 70 pc, 90 pc) worsens the overall fit
by ∆ TS=3.6 (12.2, 22.4, 30.6, 39.2, respectively). The
fit thus strongly disfavors any dark matter profile with a
core larger than a few tens of parsecs.
Lastly, we confirm that the morphology of the anoma-
lous emission does not significantly vary with energy. If
we fit the inner slope of the dark matter template in
our Inner Galaxy analysis one energy bin at a time, we
find a similar value of γ ∼1.1-1.3 for all bins between 0.7
and 13 GeV. At energies ∼ 0.5 GeV and lower, the fit
prefers somewhat steeper slopes (γ ∼ 1.6 or higher) and
a corresponding spectrum with a very soft spectral in-
dex, probably reflecting contamination from the Galactic
Plane. At energies above ∼ 13 GeV, the fit again tends
to prefers a steeper profile.
The results of this section indicate that the gamma-
ray excess exhibits a morphology which is both approxi-
mately spherically symmetric and steeply falling (yet de-
tectable) over two orders of magnitude in galactocentric
distance (between ∼20 pc and ∼2 kpc from Sgr A*). This
result is to be expected if the emission is produced by
annihilating dark matter particles, but is not anticipated
for any proposed astrophysical mechanisms or sources of
this emission.](https://image.slidesharecdn.com/thecharacterizationofthegammaraysignalfromthecentralmilkwayacompelingcaseforannihilatingdarkmatter-160401005304/85/The-characterization-of_the_gamma_ray_signal_from_the_central_milk_way_a_compeling_case__for_annihilating_dark_m_atter-13-320.jpg)

![15
tion cross section. Given that this fit is performed over
22-1 degrees-of-freedom, a goodness-of-fit with a p-value
of 0.05 (95% CL) corresponds to a χ2
of approximately
36.8. Given the systematic uncertainties associated with
the choice of background templates, we take any value
of χ2 <∼ 50 to constitute a reasonably “good fit” to the
Inner Galaxy spectrum. Good fits are found for dark
matter that annihilates to bottom, strange, or charm
quarks. The fits are slightly worse for annihilations to
light quarks, or to combinations of fermions proportional
to the square of the mass of the final state, the square of
the charge of the final state, or equally to all fermonic de-
grees of freedom (democratic). In the light mass region
(mX∼7-10 GeV) motivated by various direct detection
anomalies [50–55], the best fit we find is for annihilations
which proceed mostly to τ+
τ−
, with an additional small
fraction to quarks, such as b¯b. Even this scenario, how-
ever, provides a somewhat poor fit, significantly worse
that that found for heavier (mX ∼ 20 − 60 GeV) dark
matter particles annihilating mostly to quarks.
In Fig. 16, we show the regions of the dark matter
mass-annihilation cross section plane that are best fit by
the gamma-ray spectrum shown in Fig. 6. For each an-
nihilation channel (or combination of channels), the 1,
2 and 3σ contours are shown around the best-fit point
(corresponding to ∆χ2
= 2.30, 6.18, and 11.83, respec-
tively). Again, in the left frame we show results for dark
matter particles which annihilate entirely to a single fi-
nal state, while the right frame considers instead combi-
nations of final states. Generally speaking, the best-fit
models are those in which the dark matter annihilates to
second or third generation quarks with a cross section of
σv ∼ 10−26
cm3
/s.9
This range of values favored for the dark matter’s an-
nihilation cross section is quite interesting from the per-
spective of early universe cosmology. For the mass range
being considered here, a WIMP with an annihilation
cross section of σv 2.2 × 10⁻²⁶
cm3
/s (as evaluated
at the temperature of freeze-out) will freeze-out in the
early universe with a relic abundance equal to the mea-
sured cosmological dark matter density (assuming the
standard thermal history) [56]. The dark matter anni-
hilation cross section evaluated in the low-velocity limit
(as is relevant for indirect searches), however, is slightly
lower than the value at freeze-out in many models. For
a generic s-wave annihilation process, for example, one
generally expects dark matter in the form of a thermal
relic to annihilate at low-velocities with a cross section
9 The cross sections shown in Fig. 16 were normalized assuming a
local dark matter density of 0.4 GeV/cm3. Although this value
is near the center of the range preferred by the combination of
dynamical and microlensing data (for γ = 1.18), there are non-
negligible uncertainties in this quantity. The analysis of Ref. [17],
for example, finds a range of ρlocal = 0.26 − 0.49 GeV/cm3 at
the 2σ level. This range of densities corresponds to a potential
rescaling of the y-axis of Fig. 16 by up to a factor of 0.7-2.4.
FIG. 17: A comparison of the dark matter mass determination
using the spectrum derived from our Inner Galaxy analysis
(solid line) and using the spectrum derived from our Galac-
tic Center analysis (dashed and dotted lines). For each case
shown, we have considered a profile with an inner slope of
γ =1.2 and annihilations to b¯b.
near σvv=0 (1 − 2) × 10−26
cm3
/s, in good agreement
with the range of values favored by the observed gamma-
ray excess.
Thus far in this section, we have fit the predictions
of various dark matter models to the gamma-ray spec-
trum derived from our Inner Galaxy analysis. In Fig. 17,
we compare the mass range best fit to the Inner Galaxy
spectrum to that favored by our Galactic Center analy-
sis. Overall, these two analyses favor a similar range of
dark matter masses and annihilation channels, although
the Galactic Center spectrum does appear to be slightly
softer, and thus prefers WIMP masses that are a few GeV
lower than favored by the Inner Galaxy analysis. This
could, however, be the result of bremsstrahlung, which
can soften the gamma-ray spectrum from dark matter in
regions near the Galactic Plane (see Fig. 8 and the right
frame of Fig. 2). Such emission could plausibly cause a
∼40-45 GeV WIMP, for example, to produce a gamma-
ray spectrum along the Galactic Plane that resembles the
prompt emission predicted from a ∼35-40 GeV WIMP.
VIII. DISCUSSION
In this paper (and in previous studies [1, 2, 4–9]),
it has been shown that the gamma-ray excess observed
from the Inner Galaxy and Galactic Center is compat-
ible with that anticipated from annihilating dark mat-
ter particles. This is not, however, the first time that
an observational anomaly has been attributed to dark
matter. Signals observed by numerous experiments, in-
cluding INTEGRAL [57], PAMELA [58], ATIC [59],
Fermi [60, 61], WMAP [62, 63], DAMA/LIBRA [54, 55],](https://image.slidesharecdn.com/thecharacterizationofthegammaraysignalfromthecentralmilkwayacompelingcaseforannihilatingdarkmatter-160401005304/85/The-characterization-of_the_gamma_ray_signal_from_the_central_milk_way_a_compeling_case__for_annihilating_dark_m_atter-15-320.jpg)
![16
CoGeNT [50, 51], CDMS [52], and CRESST [53], among
others, have received a great deal of attention as possi-
ble detections of dark matter particles. Most, if not all,
of these signals, have nothing to do with dark matter,
but instead result from some combination of astrophys-
ical, environmental, and instrumental backgrounds (see
e.g. [64–71]). Given the frequency of such false alarms,
we would be wise to apply a very high standard before
concluding that any new signal is, in fact, the result of
annihilating dark matter.
There are significant reasons to conclude, however,
that the gamma-ray signal described in this paper is far
more likely to be a detection of dark matter than any
of the previously reported anomalies. Firstly, this signal
consists of a very large number of events, and has been
detected with overwhelming statistical significance. The
the excess consists of ∼104
gamma rays per square meter,
per year above 1 GeV (from within 10◦
of the Galactic
Center). Not only does this large number of events en-
able us to conclude with confidence that the signal is
present, but it also allows us to determine its spectrum
and morphology in some detail. And as shown, the mea-
sured spectrum, angular distribution, and normalization
of this emission does indeed match well with that ex-
pected from annihilating dark matter particles.
Secondly, the gamma-ray signal from annihilating dark
matter can be calculated straightforwardly, and generally
depends on only a few unknown parameters. The mor-
phology of this signal, in particular, depends only on the
distribution of dark matter in the Inner Galaxy (as pa-
rameterized in our study by the inner slope, γ). The
spectral shape of the signal depends only on the mass of
the dark matter particle and on what Standard Model
particles are produced in its annihilations. The Galac-
tic gamma-ray signal from dark matter can thus be pre-
dicted relatively simply, in contrast to, e.g., dark matter
searches using cosmic rays, where putative signals are
affected by poorly constrained diffusion and energy-loss
processes. In other words, for the gamma-ray signal at
hand, there are relatively few “knobs to turn”, making
it less likely that one would be able to mistakenly fit a
well-measured astrophysical signal with that of an anni-
hilating dark matter model.
Thirdly, we once again note that the signal described in
this study can be explained by a very simple dark matter
candidate, without any baroque or otherwise unexpected
features. After accounting for uncertainties in the overall
mass of the Milky Way’s dark matter halo profile [17],
our results favor dark matter particles with an annihi-
lation cross section of σv = (0.4 − 6.6) × 10−26
cm3
/s
(for annihilations to b¯b, see Fig. 16). This range covers
the long predicted value that is required of a thermal
relic that freezes-out in the early universe with an abun-
dance equal to the measured cosmological dark matter
density (2.2 × 10⁻²⁶
cm3
/s). No substructure boost fac-
tors, Sommerfeld enhancements, or non-thermal histories
are required. Furthermore, it is not difficult to construct
simple models in which a ∼30-50 GeV particle annihi-
lates to quarks with the required cross section without
violating constraints from direct detection experiments,
colliders, or other indirect searches (for work related to
particle physics models capable of accommodating this
signal, see Refs. [72–85]).
And lastly, the dark matter interpretation of this signal
is strengthened by the absence of plausible or well moti-
vated alternatives. There is no reason to expect that any
diffuse astrophysical emission processes would exhibit ei-
ther the spectrum or the morphology of the observed
signal. In particular, the spherical symmetry of the ob-
served emission with respect to the Galactic Center does
not trace any combination of astrophysical components
(i.e. radiation, gas, dust, star formation, etc.), but does
follow the square of the anticipated dark matter density.
The astrophysical interpretation most often discussed
within the context of this signal is that it might originate
from a large population of unresolved millisecond pul-
sars. The millisecond pulsars observed within the Milky
Way are largely located either within globular clusters
or in or around the Galactic Disk (with an exponential
scale height of zs ∼ 1 kpc [11, 86]). This pulsar popu-
lation would lead to a diffuse gamma-ray signal that is
highly elongated along the disk, and would be highly in-
compatible with the constraints described in Sec. VI. For
example, the best-fit model of Ref. [86], which is based
on the population of presently resolved gamma-ray mil-
lisecond pulsars, predicts a morphology for the diffuse
gamma-ray emission exhibiting an axis ratio of ∼1-to-6.
Within 10◦
of the Galactic Center, this model predicts
that millisecond pulsars should account for ∼1% of the
observed diffuse emission, and less than ∼5-10% of the
signal described in this paper.
To evade this conclusion, however, one could contem-
plate an additional (and less constrained) millisecond
pulsar population associated with the Milky Way’s cen-
tral stellar cluster. This scenario can be motivated by
the fact that globular clusters are known to contain large
numbers of millisecond pulsars, presumably as a conse-
quence of their very high stellar densities. If our galaxy’s
central stellar cluster contains a large number of mil-
lisecond pulsars with an extremely concentrated distribu-
tion (with a number density that scales approximately as
nMSP ∝ r−2.4
), those sources could plausibly account for
much of the gamma-ray excess observed within the inner
∼1◦
around the Galactic Center [2, 4–7, 10]. It is much
more challenging, however, to imagine that millisecond
pulsars could account for the more extended component
of this excess, which we have shown to be present out
to at least ∼10◦
from the Galactic Center. Expecta-
tions for the Inner Galaxy’s pulsar population are not
consistent with such an extended distribution. Further-
more, if the required number of millisecond pulsars were
present ∼10◦
(∼1.5 kpc) north or south of the Galactic
Center, a significant number of these sources would have
been resolved by Fermi and appeared within the 2FGL
catalog (assuming that the pulsars in question have a
similar luminosity function to other observed millisecond](https://image.slidesharecdn.com/thecharacterizationofthegammaraysignalfromthecentralmilkwayacompelingcaseforannihilatingdarkmatter-160401005304/85/The-characterization-of_the_gamma_ray_signal_from_the_central_milk_way_a_compeling_case__for_annihilating_dark_m_atter-16-320.jpg)
![17
FIG. 18: A comparison of the spectral shape of the gamma-
ray excess described in this paper (error bars) to that mea-
sured from a number of high-significance globular clusters
(NGC 6266, 47 Tuc, and Terzan 5), and from the sum of
all millisecond pulsars detected as individual point sources by
Fermi. The gamma-ray spectrum measured from millisecond
pulsars and from globular clusters (whose emission is believed
to be dominated by millisecond pulsars) is consistently softer
than that of the observed excess at energies below ∼1 GeV.
See text for details.
pulsars) [11, 46, 86]. The lack of such resolved sources
strongly limits the abundance of millisecond pulsars in
the region of the Inner Galaxy. Furthermore, the shape
of the gamma-ray spectrum observed from resolved mil-
lisecond pulsars and from globular clusters (whose emis-
sion is believed to be dominated by millisecond pulsars)
appears to be not-insignificantly softer than that of the
gamma-ray excess observed from the Inner Galaxy. In
Fig. 18, we compare the spectral shape of the gamma-
ray excess to that measured from a number of globular
clusters, and from the sum of all resolved millisecond pul-
sars. Here, we have selected the three highest significance
globular clusters (NGC 6266, 47 Tuc, and Terzan 5), and
plotted their best fit spectra as reported by the Fermi
Collaboration [87]. For the emission from resolved mil-
lisecond pulsars, we include the 37 sources as described
in Ref. [11]. Although each of these spectral shapes pro-
vides a reasonably good fit to the high-energy spectrum,
they also each significantly exceed the amount of emis-
sion that is observed at energies below ∼1 GeV. This
comparison further disfavors millisecond pulsars as the
source of the observed gamma-ray excess.
The near future offers encouraging prospects for de-
tecting further evidence in support of a dark matter in-
terpretation of this signal. The dark matter mass and
annihilation cross section implied by the gamma-ray ex-
cess is similar to Fermi’s sensitivity from observations of
dwarf spheroidal galaxies. In fact, the Fermi Collabora-
tion has reported a modestly statistically significant ex-
cess (∼2-3σ) in their search for annihilating dark matter
particles in dwarf galaxies. If interpreted as a detection of
dark matter, this observation would imply a similar mass
and cross section to that favored by our analysis [33]. A
similar (∼3σ) excess has also been reported from the di-
rection of the Virgo Cluster [88, 89]. With the full dataset
anticipated from Fermi’s 10 year mission, it may be pos-
sible to make statistically significant detections of dark
matter annihilation products from a few of the brightest
dwarf galaxies, galaxy clusters, and perhaps nearby dark
matter subhalos [90]. Anticipated measurements of the
cosmic-ray antiproton-to-proton ratio by AMS may also
be sensitive to annihilating dark matter with the charac-
teristics implied by our analysis [91, 92].
IX. SUMMARY AND CONCLUSIONS
In this study, we have revisited and scrutinized the
gamma-ray emission from the central regions of the Milky
Way, as measured by the Fermi Gamma-Ray Space Tele-
scope. In doing so, we have confirmed a robust and
highly statistically significant excess, with a spectrum
and angular distribution that is in excellent agreement
with that expected from annihilating dark matter. The
signal is distributed with approximate spherical symme-
try around the Galactic Center, with a flux that falls
off as Fγ ∝ r−(2.2−2.6)
, implying a dark matter distri-
bution of ρ ∝ r−γ
, with γ 1.1 − 1.3. The spectrum
of the excess peaks at ∼1-3 GeV, and is well fit by 36-
51 GeV dark matter particles annihilating to b¯b. The
annihilation cross section required to normalize this sig-
nal is σv = (1.9 − 2.8) × 10−26
cm3
/s (for a local dark
matter density of 0.4 GeV/cm3
), in good agreement with
the value predicted for a simple thermal relic. In partic-
ular, a dark matter particle with this cross section will
freeze-out of thermal equilibrium in the early universe
to yield an abundance approximately equal to the mea-
sured cosmological dark matter density (for the range of
masses and cross sections favored for other annihilation
channels, see Sec. VII).
In addition to carrying out two different analyses (as
described in Secs. IV and V), subject to different sys-
tematic uncertainties, we have applied a number of tests
to our results in order to more stringently determine
whether the characteristics of the observed excess are in
fact robust and consistent with the signal predicted from
annihilating dark matter. These tests uniformly confirm
that the signal is present throughout the Galactic Center
and Inner Galaxy (extending out to angles of at least 10◦
from the Galactic Center), without discernible spectral
variation or significant departures from spherical sym-
metry. No known, anticipated, or proposed astrophysical
diffuse emission mechanisms can account for this excess.
And while a population of several thousand millisecond
pulsars could have plausibly been responsible for much of
the anomalous emission observed from within the inner-
most ∼ 1◦
−2◦
around the Galactic Center, the extension
of this signal into regions well beyond the confines of the](https://image.slidesharecdn.com/thecharacterizationofthegammaraysignalfromthecentralmilkwayacompelingcaseforannihilatingdarkmatter-160401005304/85/The-characterization-of_the_gamma_ray_signal_from_the_central_milk_way_a_compeling_case__for_annihilating_dark_m_atter-17-320.jpg)
![18
central stellar cluster strongly disfavors such objects as
the primary source of this signal. In light of these consid-
erations, we consider annihilating dark matter particles
to be the leading explanation for the origin of this signal,
with potentially profound implications for cosmology and
particle physics.
Acknowledgements: We would like to thank Keith
Bechtol, Eric Charles and Alex Drlica-Wagner for their
help with the Fermi-LAT likelihood analysis, Oscar
Macias-Ramirez and Farhad Yusef-Zadeh for providing
the 20 cm templates, and Simona Murgia, Jesse Thaler
and Neal Weiner for helpful discussions. We particu-
larly thank Francesca Calore, Ilias Cholis and Christoph
Weniger for providing an independent cross-check of
some of our sphericity results. We acknowledge the Uni-
versity of Chicago Research Computing Center for pro-
viding support for this work. DPF is supported in part
by the NASA Fermi Guest Investigator Program, DH is
supported by the Department of Energy, and TL is sup-
ported by NASA through Einstein Postdoctoral Award
Number PF3-140110. TRS is supported by the U.S. De-
partment of Energy under cooperative research agree-
ment Contract Number DE-FG02-05ER41360.
[1] L. Goodenough and D. Hooper (2009), 0910.2998.
[2] D. Hooper and L. Goodenough, Phys.Lett. B697, 412
(2011), 1010.2752.
[3] A. Boyarsky, D. Malyshev, and O. Ruchayskiy,
Phys.Lett. B705, 165 (2011), 1012.5839.
[4] D. Hooper and T. Linden, Phys.Rev. D84, 123005
(2011), 1110.0006.
[5] K. N. Abazajian and M. Kaplinghat, Phys.Rev. D86,
083511 (2012), 1207.6047.
[6] C. Gordon and O. Macias, Phys.Rev. D88, 083521
(2013), 1306.5725.
[7] K. N. Abazajian, N. Canac, S. Horiuchi, and M. Kapling-
hat (2014), 1402.4090.
[8] D. Hooper and T. R. Slatyer, Phys.Dark Univ. 2, 118
(2013), 1302.6589.
[9] W.-C. Huang, A. Urbano, and W. Xue (2013), 1307.6862.
[10] K. N. Abazajian, JCAP 1103, 010 (2011), 1011.4275.
[11] D. Hooper, I. Cholis, T. Linden, J. Siegal-Gaskins, and
T. R. Slatyer, Phys.Rev. D88, 083009 (2013), 1305.0830.
[12] T. Linden, E. Lovegrove, and S. Profumo, Astrophys.J.
753, 41 (2012), 1203.3539.
[13] O. Macias and C. Gordon (2013), 1312.6671.
[14] M. Kuhlen, J. Diemand, and P. Madau (2007),
0705.2037.
[15] J. F. Navarro, C. S. Frenk, and S. D. M. White, Astro-
phys. J. 462, 563 (1996), astro-ph/9508025.
[16] J. F. Navarro, C. S. Frenk, and S. D. M. White, Astro-
phys. J. 490, 493 (1997), astro-ph/9611107.
[17] F. Iocco, M. Pato, G. Bertone, and P. Jetzer, JCAP
1111, 029 (2011), 1107.5810.
[18] R. Catena and P. Ullio (2009), 0907.0018.
[19] J. F. Navarro et al. (2008), 0810.1522.
[20] J. Diemand et al. (2008), arXiv: 0805.1244 [astro-ph].
[21] G. R. Blumenthal, S. M. Faber, R. Flores, and J. R.
Primack, Astrophys. J. 301, 27 (1986).
[22] B. S. Ryden and J. E. Gunn, Astrophys. J. 318, 15
(1987).
[23] O. Y. Gnedin, D. Ceverino, N. Y. Gnedin, A. A. Klypin,
A. V. Kravtsov, et al. (2011), 1108.5736.
[24] O. Y. Gnedin, A. V. Kravtsov, A. A. Klypin, and
D. Nagai, Astrophys. J. 616, 16 (2004), arXiv:astro-
ph/0406247.
[25] F. Governato, A. Zolotov, A. Pontzen, C. Christensen,
S. H. Oh, A. M. Brooks, T. Quinn, S. Shen, and
J. Wadsley, Mon. Not. R. Astron. Soc. 422, 1231 (2012),
1202.0554.
[26] M. Kuhlen, J. Guedes, A. Pillepich, P. Madau, and
L. Mayer, Astrophys.J. 765, 10 (2013), 1208.4844.
[27] M. D. Weinberg and N. Katz, Astrophys.J. 580, 627
(2002), astro-ph/0110632.
[28] M. D. Weinberg and N. Katz, Mon.Not.Roy.Astron.Soc.
375, 460 (2007), astro-ph/0601138.
[29] J. Sellwood, Astrophys.J. 587, 638 (2003), astro-
ph/0210079.
[30] O. Valenzuela and A. Klypin, Mon.Not.Roy.Astron.Soc.
345, 406 (2003), astro-ph/0204028.
[31] P. Colin, O. Valenzuela, and A. Klypin, Astrophys.J.
644, 687 (2006), astro-ph/0506627.
[32] V. Springel et al., Mon. Not. Roy. Astron. Soc. 391, 1685
(2008), 0809.0898.
[33] M. Ackermann et al. (Fermi-LAT Collaboration) (2013),
1310.0828.
[34] T. Sjostrand, S. Mrenna, and P. Z. Skands, JHEP 0605,
026 (2006), hep-ph/0603175.
[35] L. Bergstrom, T. Bringmann, M. Eriksson, and
M. Gustafsson, Phys.Rev.Lett. 94, 131301 (2005), astro-
ph/0410359.
[36] A. Birkedal, K. T. Matchev, M. Perelstein, and A. Spray
(2005), hep-ph/0507194.
[37] M. Cirelli, P. D. Serpico, and G. Zaharijas, JCAP 1311,
035 (2013), 1307.7152.
[38] W. Atwood et al. (LAT Collaboration), Astrophys.J.
697, 1071 (2009), 0902.1089.
[39] M. Ackermann et al. (Fermi-LAT Collaboration), Astro-
phys.J.Suppl. 203, 4 (2012), 1206.1896.
[40] M. Ackermann, M. Ajello, A. Allafort, K. Asano, W. B.
Atwood, L. Baldini, J. Ballet, G. Barbiellini, D. Bastieri,
K. Bechtol, et al., Astrophys. J. 765, 54 (2013).
[41] S. K. N. Portillo and D. P. Finkbeiner, Astrophys. J.
796, 54 (2014), 1406.0507.
[42] G. Dobler, D. P. Finkbeiner, I. Cholis, T. R. Slatyer, and
N. Weiner, Astrophys.J. 717, 825 (2010), 0910.4583.
[43] M. Su, T. R. Slatyer, and D. P. Finkbeiner, Astrophys.J.
724, 1044 (2010), 1005.5480.
[44] F. Calore, I. Cholis, and C. Weniger (2014), 1409.0042.
[45] C. Law, F. Yusef-Zadeh, W. Cotton, and R. Maddalena
(2008), 0801.4294.
[46] P. Nolan et al. (Fermi-LAT Collaboration), Astro-
phys.J.Suppl. 199, 31 (2012), 1108.1435.
[47] F. Yusef-Zadeh, J. Hewitt, M. Wardle, V. Tatis-](https://image.slidesharecdn.com/thecharacterizationofthegammaraysignalfromthecentralmilkwayacompelingcaseforannihilatingdarkmatter-160401005304/85/The-characterization-of_the_gamma_ray_signal_from_the_central_milk_way_a_compeling_case__for_annihilating_dark_m_atter-18-320.jpg)
![19
cheff, D. Roberts, et al., Astrophys.J. 762, 33 (2013),
1206.6882.
[48] A. Abdo et al. (Fermi-LAT collaboration),
Phys. Rev. Lett. 104, 101101 (2010), 1002.3603.
[49] F. Yusef-Zadeh, D. Choate, and W. Cotton, Astro-
phys. J. Lett. 518, L33 (1999), astro-ph/9904142.
[50] C. Aalseth et al. (CoGeNT collaboration),
Phys. Rev. Lett. 106, 131301 (2011), 1002.4703.
[51] C. E. Aalseth et al. (2011), 1106.0650.
[52] R. Agnese et al. (CDMS Collaboration), Phys.Rev.Lett.
(2013), 1304.4279.
[53] G. Angloher, M. Bauer, I. Bavykina, A. Bento, C. Bucci,
et al., Eur.Phys.J. C72, 1971 (2012), 1109.0702.
[54] R. Bernabei et al. (DAMA), Eur. Phys. J. C56, 333
(2008), 0804.2741.
[55] R. Bernabei et al. (2010), 1002.1028.
[56] G. Steigman, B. Dasgupta, and J. F. Beacom, Phys.Rev.
D86, 023506 (2012), 1204.3622.
[57] C. Boehm, D. Hooper, J. Silk, M. Casse, and J. Paul,
Phys. Rev. Lett. 92, 101301 (2004), astro-ph/0309686.
[58] O. Adriani et al. (PAMELA), Nature 458, 607 (2009),
0810.4995.
[59] J. Chang et al., Nature 456, 362 (2008).
[60] C. Weniger, JCAP 1208, 007 (2012), 1204.2797.
[61] M. Su and D. P. Finkbeiner (2012), 1206.1616.
[62] D. P. Finkbeiner (2004), astro-ph/0409027.
[63] D. Hooper, D. P. Finkbeiner, and G. Dobler, Phys. Rev.
D76, 083012 (2007), arXiv:0705.3655 [astro-ph].
[64] D. Hooper, P. Blasi, and P. D. Serpico, JCAP 0901, 025
(2009), 0810.1527.
[65] S. Profumo, Central Eur.J.Phys. 10, 1 (2011), 0812.4457.
[66] G. Dobler, Astrophys.J. 750, 17 (2012), 1109.4418.
[67] G. Dobler (2012), 1208.2690.
[68] M. Ackermann et al. (Fermi-LAT Collaboration),
Phys.Rev. D88, 082002 (2013), 1305.5597.
[69] C. Aalseth et al. (CoGeNT Collaboration), Phys.Rev.
D88, 012002 (2013), 1208.5737.
[70] E. Aprile et al. (XENON100 Collaboration),
Phys.Rev.Lett. 109, 181301 (2012), 1207.5988.
[71] D. Akerib et al. (LUX Collaboration) (2013), 1310.8214.
[72] C. Boehm, M. J. Dolan, C. McCabe, M. Spannowsky,
and C. J. Wallace (2014), 1401.6458.
[73] E. Hardy, R. Lasenby, and J. Unwin (2014), 1402.4500.
[74] K. P. Modak, D. Majumdar, and S. Rakshit (2013),
1312.7488.
[75] W.-C. Huang, A. Urbano, and W. Xue (2013), 1310.7609.
[76] N. Okada and O. Seto (2013), 1310.5991.
[77] K. Hagiwara, S. Mukhopadhyay, and J. Nakamura,
Phys.Rev. D89, 015023 (2014), 1308.6738.
[78] M. R. Buckley, D. Hooper, and J. Kumar, Phys.Rev.
D88, 063532 (2013), 1307.3561.
[79] L. A. Anchordoqui and B. J. Vlcek, Phys.Rev. D88,
043513 (2013), 1305.4625.
[80] M. R. Buckley, D. Hooper, and J. L. Rosner, Phys.Lett.
B703, 343 (2011), 1106.3583.
[81] M. Boucenna and S. Profumo, Phys.Rev. D84, 055011
(2011), 1106.3368.
[82] G. Marshall and R. Primulando, JHEP 1105, 026 (2011),
1102.0492.
[83] G. Zhu, Phys.Rev. D83, 076011 (2011), 1101.4387.
[84] M. R. Buckley, D. Hooper, and T. M. Tait, Phys.Lett.
B702, 216 (2011), 1011.1499.
[85] H. E. Logan, Phys.Rev. D83, 035022 (2011), 1010.4214.
[86] T. Grgoire and J. Kndlseder (2013), 1305.1584.
[87] A. Abdo et al. (Fermi-LAT Collaboration) (2010),
1003.3588.
[88] J. Han, C. S. Frenk, V. R. Eke, L. Gao, S. D. White,
et al., Mon.Not.Roy.Astron.Soc. 427, 1651 (2012),
1207.6749.
[89] O. Macias-Ramirez, C. Gordon, A. M. Brown, and
J. Adams, Phys.Rev. D86, 076004 (2012), 1207.6257.
[90] A. Berlin and D. Hooper, Phys.Rev. D89, 016014 (2014),
1309.0525.
[91] M. Cirelli and G. Giesen, JCAP 1304, 015 (2013),
1301.7079.
[92] N. Fornengo, L. Maccione, and A. Vittino (2013),
1312.3579.
[93] D. J. Schlegel, D. P. Finkbeiner, and M. Davis, Astro-
phys. J. 500, 525 (1998), astro-ph/9710327.](https://image.slidesharecdn.com/thecharacterizationofthegammaraysignalfromthecentralmilkwayacompelingcaseforannihilatingdarkmatter-160401005304/85/The-characterization-of_the_gamma_ray_signal_from_the_central_milk_way_a_compeling_case__for_annihilating_dark_m_atter-19-320.jpg)
![20
Appendix A: Stability Under Modifications to the
Analysis
1. Changing the Region of Interest
In Fig. 19, we compare the spectrum correlated with
the dark matter template (with γ = 1.2) for variations
of the ROI. In the left panel, we study different degrees
of masking the Galactic Plane (|b| > 1◦
and |b| > 4◦
),
and the impact of performing the fit only in the southern
sky (where the diffuse backgrounds are somewhat fainter)
rather than in the full ROI. In the right panel, we show
the impact of expanding or shrinking the ROI.
There is no evidence of asymmetry between the south-
ern sky and the overall signal. Masking at 4◦
gives rise to
a similar spectral shape but a lower overall normalization
than obtained with the 1◦
mask, albeit with large error
bars. As discussed in Sec. VI, this may reflect a steep-
ening of the spatial profile at larger distances from the
GC, although the fainter emission at these larger radii is
likely also more sensitive to mismodeling of the diffuse
gamma-ray background.
Shrinking or expanding the size of the ROI also changes
the height of the peak, while preserving a “bump”-like
spectrum that rises steeply at low energies and peaks
around ∼ 2 GeV. In general, larger ROIs give rise to
lower normalizations for the signal. This effect appears
to be driven by a higher normalization of the diffuse back-
ground model for larger ROIs; when the fit is confined to
the inner Galaxy, the diffuse model prefers a lower coef-
ficient than when fitted over the full sky, suggesting that
the Pass 6 model has a tendency to overpredict the data
in this region. This may also explain why larger ROIs
prefer a somewhat steeper slope for the profile (higher
γ); subtracting a larger background will lead to a greater
relative decrease in the signal at large radii, where it is
fainter. We also find evidence for substantial oversub-
traction of the Galactic plane in larger ROIs, consistent
with this hypothesis, as we will discuss in Appendix A 3.
In Fig. 20, we show the regions of the dark matter
mass-annihilation cross section plane favored by our fit,
for several choices of the ROI (for annihilations to b¯b and
an inner slope of 1.18). The degree of variation shown
in this figure provides a measure of the systematic un-
certainties involved in this determination; we see that
the cross section is always very close to the thermal relic
value, but the best-fit mass can shift substantially (from
∼ 35 − 60 GeV). As previously, the contours are based
on statistical errors only.
2. Varying the Event Selection
By default, we employ cuts on the CTBCORE param-
eter to improve angular resolution and minimize cross-
leakage between the background and the signal. In an
earlier version of this work, this resulted in a pronounced
improvement in the consistency of the spectrum between
different regions (in particular, in the hardness of the low-
energy spectrum); however, this appears to have been
due to a mismodeling of the background emission.10
We
now find that when the backgrounds are treated cor-
rectly, the spectrum has a consistent shape independent
of the CTBCORE cut, and the significant changes in the
tails of the point spread function (PSF) associated with a
CTBCORE cut do not materially affect our results. Sim-
ilarly, we find that our results are robust to the choice of
ULTRACLEAN or CLEAN event selection, and to the in-
clusion or exclusion of back-converting events. We show
the spectra extracted for several different event selections
in Fig. 21. Systematics associated with these choices are
therefore unlikely to affect the observed excess.
3. A Simplified Test of Elongation
Probing the morphology of the Inner Galaxy excess is
complicated by the bright emission correlated with the
Galactic Plane. In Ref. [8], it proved difficult to ro-
bustly determine whether any signal was present outside
of the regions occupied by the Fermi Bubbles, as the re-
gions both close to the Galactic Center and outside of
the Bubbles were dominated by the bright emission from
the Galactic Plane. The improved analysis presented in
this paper mitigates this issue.
In addition to the detailed study of morphology de-
scribed in Sec. VI, we perform here a fit dividing the sig-
nal template into two independent templates, one with
|l| > |b| and the other with |b| > |l|. The former template
favors the Galactic Plane, while the latter contains the
Fermi Bubbles. As previously, the fit also includes a sin-
gle template for the Bubbles in addition to the Fermi dif-
fuse model and an isotropic offset. The extracted spectra
of the signal templates are shown in Fig. 22. Both regions
exhibit a clear spectral feature with broadly consistent
shape and normalization, although the best-fit spectrum
for the region with |l| > |b| is generally slightly lower and
has larger uncertainties. A lower normalization in these
quadrants is expected, from the preference for a slight
stretch perpendicular to the Galactic plane noted for the
inner Galaxy in Sec. VI.
As shown in Appendix A 1, the impact of the choice
of ROI on the overall shape of the spectrum is mod-
est. However, upon repeating this analysis in each of the
ROIs, we find that the spectrum extracted from the quad-
rants lying along the Galactic plane (|l| > |b|) is much
more sensitive to this choice. While a spectral “bump”
peaked at ∼ 2 GeV is always present, it appears to be
superimposed on a negative offset which grows larger as
10 We suggested in that earlier work that the soft low-energy spec-
trum observed in the absence of a CTBCORE cut was likely
due to contamination by mismodeled diffuse emission from the
Galactic plane; our current results support that interpretation.](https://image.slidesharecdn.com/thecharacterizationofthegammaraysignalfromthecentralmilkwayacompelingcaseforannihilatingdarkmatter-160401005304/85/The-characterization-of_the_gamma_ray_signal_from_the_central_milk_way_a_compeling_case__for_annihilating_dark_m_atter-20-320.jpg)


![23
1 10
Eγ (GeV)
-2•10-6
0
2•10-6
4•10-6
6•10-6E2
dN/dE(GeV/cm2
/s/sr)
NFW profile, γ =1.0
NFW profile, γ =1.1
NFW profile, γ =1.2
NFW profile, γ =1.3
NFW profile, γ =1.4
NFW profile, γ =1.5
NFW profile, γ =1.6
FIG. 24: The central values of the spectra of the dark mat-
ter templates for different values of the dark matter profile’s
inner slope, γ. To better facilitate comparison, each curve
has been rescaled to match the γ = 1.0 curve at 1 GeV. All
fits have been performed with the p6v11 Fermi diffuse model,
a single flat template for the Bubbles, and the dark matter
signal template. The region between the γ = 1.1 and γ = 1.3
lines, preferred by the fit, is cross-hatched. Error bars are not
shown to avoid cluttering the plot. In this preferred range,
the spectra are remarkably consistent. Allowing very high
values of γ seems to pick up a much softer spectrum, likely
due to contamination by the Galactic plane, but these high
values of γ provide commensurately worse fits to the data.
constraint on the normalization of the diffuse background
is relaxed; the Galactic Center analysis, which includes
the peak of the excess and the region where the signal-
to-background ratio is largest, also prefers a spherical
excess.
We also performed the additional test of not includ-
ing any model for the point sources in the fit, allowing
their flux to be absorbed by the NFW template. Since
many point sources are clustered along the plane, over-
subtracting them could bias the extracted morphology
of the signal and hide an elongation along the plane.
However, we found that even when no sources were sub-
tracted, there was no ROI in which the spectrum ex-
tracted from the |l| > |b| quadrants exceeded that for the
|b| > |l| quadrants.
4. Sensitivity of the Spectral Shape to the
Assumed Morphology
In our main analyses, we have derived spectra for the
component associated with the dark matter template as-
suming a dark matter density profile with a given inner
slope, γ. One might ask, however, to what degree uncer-
tainties in the morphology of the template might bias the
spectral shape extracted from our analysis. In Fig. 24,
we plot the (central values of the) spectrum found for
the dark matter template in our Inner Galaxy analysis,
for a number of values of γ. The shapes of the spectra
are quite consistent, within the range of slopes favored
by our fits (γ = 1.1 − 1.3); the extracted spectrum is not
highly sensitive to the specified signal morphology. How-
ever, for γ 1.5 this statement is no longer true: higher
values of γ pick up a much softer spectrum, which we
ascribe to contamination from the Galactic plane at the
edge of the mask. Of course, such high values of γ also
have much worse TS.
Appendix B: Modeling of Background Diffuse
Emission in the Inner Galaxy
1. The Fermi Bubbles
The fit described in Sec. IV is a simplified version of
the analysis performed in Ref. [8], where the spectrum
of the Bubbles was allowed to vary with latitude. From
the results in Ref. [8], it appears that this freedom is
not necessary – the spectrum and normalization of the
Bubbles varies only slightly with Galactic latitude.
It is straightforward to reintroduce this freedom, and
we show in Fig. 25 the spectrum correlated with the dark
matter template if this is done. Above 0.5 GeV, the spec-
trum of the excess is not significantly altered by fixing
the Bubbles to have a single spectrum; at low energies,
reintroducing this freedom slightly raises the extracted
spectrum for the dark matter template.
2. The Choice of Diffuse Model
Throughout our Inner Galaxy analysis, we employed
the p6v11 diffuse model released by the Fermi Collab-
oration, rather than the more up-to-date p7v6 model.
As noted earlier, this choice was made because the p7v6
model contains artificial templates for the Fermi Bub-
bles and other large-scale features (with fixed spectra),
making it more difficult to interpret any residuals.
Having shown that a single flat-luminosity template
for the Bubbles is sufficient to capture their contribution
without biasing the spectrum of the signal template, one
might also employ the p7v6 model in addition to an in-
dependent template for the Bubbles, in order to absorb
any deviations between the true spectrum of the Bub-
bles and their description in the model. Unfortunately,
the template for the Fermi Bubbles employed in con-
structing the p7v6 diffuse model (which is not separately
characterized from the overall Galactic diffuse emission)
is different to the one employed in our analysis, especially
in the regions close to the Galactic plane. Consequently,
this approach gives rise to residuals correlated with the
spatial differences between these templates. For this rea-
son, we employ the p6v11 diffuse model for our principal
analysis. However, using the p7v6 model does not quan-
titatively change our results, although the peak of the
spectrum is somewhat lower (yielding results more com-
parable to that obtained from the full-sky ROI with the](https://image.slidesharecdn.com/thecharacterizationofthegammaraysignalfromthecentralmilkwayacompelingcaseforannihilatingdarkmatter-160401005304/85/The-characterization-of_the_gamma_ray_signal_from_the_central_milk_way_a_compeling_case__for_annihilating_dark_m_atter-23-320.jpg)
![24
1 10
Eγ (GeV)
0
1•10-6
2•10-6
3•10-6
4•10-6
E2
dN/dE(GeV/cm2
/s/sr)
Single Bubbles template
Two Bubbles templates
FIG. 25: The spectrum of the emission correlated with a dark matter template, corresponding to a generalized NFW profile
with an inner slope of γ = 1.2, obtained by a fit containing either a single template for the Fermi Bubbles (black diamonds) or
two templates for 10-degree-wide slices in Galactic latitude through the Bubbles (blue stars). The latter allows the spectrum
of the Fermi Bubbles to vary somewhat with Galactic latitude (there are only two templates, in contrast to the five employed
in [8], because the ROI only extends to ±20 degrees).
p6v11 model). A direct comparison of these two results
is shown in Fig. 26.
In Fig. 27, we compare the regions of the dark matter
mass-annihilation cross section plane (for annihilations to
b¯b) that are best fit by the spectrum found in our default
Inner Galaxy analysis (using the Pass 6 Galactic diffuse
model, and fit over the |l| < 20◦
, 20◦
> |b| > 1◦
ROI), to
that found for the spectra shown in Figs. 22 and 26. The
excess is still clearly present and consistent with a dark
matter interpretation, and the qualitative results do not
change with choice of diffuse model.
3. Variation in the π0
Contribution to the Galactic
Diffuse Emission
Although the spectrum of the observed excess does not
appear to be consistent with gamma rays produced by in-
teractions of proton cosmic rays with gas, one might won-
der whether the difference between the true spectrum
and the model might give rise to an artificially peaked
spectrum. While we fit the spectrum of emission corre-
lated with the Fermi diffuse model from the data, the
model contains at least two principal emission compo-
nents with quite different spectra (the gamma rays from
the inverse Compton scattering of cosmic-ray electrons,
and those from the interactions between cosmic-ray pro-
tons and gas), and their ratio is essentially fixed by our
choice to use a single template for the diffuse Galactic
emission (although we do allow for an arbitrary isotropic
offset). Mismodeling of the cosmic-ray spectrum or den-
sity in the inner Galaxy could also give rise to residual
differences between the data and model.
As a first step in exploring such issues, we consider
relaxing the constraints on the background model by
adding the Schlegel-Finkbeiner-Davis (SFD) map of in-
terstellar dust [93] as an additional template. This dust
map has previously been used effectively as a template
for the gas-correlated gamma-ray emission [42, 43]. By
allowing its spectrum to vary independently of the Fermi
diffuse model, we hope to absorb systematic differences
between the model and the data correlated with the gas.
While the approximately spherical nature of the observed
excess (see Sec. VI) makes the dust template unlikely to
absorb the majority of this signal, if the spectrum of the
excess were to change drastically as a result of this new
component, that could indicate a systematic uncertainty
associated with the background modeling.
In Fig. 28, we show the results of a template fit using
the three background templates described in Sec. IV, as
well as the SFD dust map. The additional template im-
proves the fit markedly, and absorbs significant emission
across a broad range of energies. However, when the dark
matter template is added, the fit still strongly prefers its
presence and recovers the familiar spectrum with power
peaked at ∼1-3 GeV.](https://image.slidesharecdn.com/thecharacterizationofthegammaraysignalfromthecentralmilkwayacompelingcaseforannihilatingdarkmatter-160401005304/85/The-characterization-of_the_gamma_ray_signal_from_the_central_milk_way_a_compeling_case__for_annihilating_dark_m_atter-24-320.jpg)


![29
1 10
Eγ (GeV)
-1•10-6
0
1•10-6
2•10-6
3•10-6
E2
dN/dE(GeV/cm2
/s/sr)
Galactic center
Centered at l=30°
FIG. 33: Red stars indicate the Galactic Center spectrum,
whereas blue diamonds indicate the spectrum correlated with
a DM-annihilation-like template (corresponding to an NFW
profile with an inner slope γ = 1.3) centered at b = 0◦
, l =
30◦
, instead of at the Galactic Center. The band of horizontal
lines indicates the spread of the best-fit spectra correlated
with DM-annihilation-like templates shifted in 30◦
increments
along the Galactic plane: for the ten other cases sampled
(l = 60◦
, 90◦
, ..., 330◦
), the emission correlated with the DM-
annihilation-like template was nearly an order of magnitude
below the Galactic Center excess at its peak, with no evidence
of spectral similarity. In this case we perform the fit over the
full-sky ROI (with an appropriate best-fit γ), rather than our
standard ROI, to ensure stability of the fit and keep the fitted
normalizations of the background templates similar over the
different runs.
in the Galactic Center, could favor astrophysical expla-
nations for the signal. To test this possibility, we shift the
DM-annihilation-like spatial template along the Galactic
plane in 30◦
increments; as usual, the other templates in
the fit are the Fermi Bubbles, the diffuse model and an
isotropic offset. For numerical stability and consistency
of the background modeling, we perform these fits over
the full sky rather than the standard ROI. All templates
are normalized so that their spectra reflect the flux five
degrees from their centers. For ten of the twelve points
sampled, the emission correlated with this template is
very small; the cross-hatched band in Fig. 33 shows the
full range of the central values for these ten cases. For the
point centered at l = 30◦
, there is substantial emission
correlated with the template at energies below 1 GeV,
but its spectrum is very soft, resembling the Galactic
plane more than the excess at the Galactic Center. The
last point is the Galactic Center.
We have performed the same test shifting the center of
the DM-annihilation-like template in 5◦
increments from
l = −30◦
to l = 30◦
. The templates centered at l =
±5◦
absorb emission associated with the Galactic Center
excess, albeit with lower amplitude; none of the other
cases detect any excess of comparable size with a similar
spectrum.
5x10⁻⁷
1x10
-6
0.5 1 5 10
E
2
dN/dE(GeVcm
-2
s
-1
)
E (GeV)
Default
No 20 cm, no new PS
5x10
-7
1x10⁻⁶
0.5 1 5 10
E2
dN/dE(GeVcm-2
s-1
sr-1
)
E (GeV)
Default
Spectral Variations Allowed
FIG. 34: Top frame: A comparison of the spectrum of the
dark matter template found in our default Galactic Center
analysis to that found when the 20 cm template and two ad-
ditional point sources are not included in the fit (for γ = 1.3).
The exclusion of these additional components from the fit
leads to a softer spectrum at energies below ∼1 GeV, but
does not influence the spectrum or intensity of the dark mat-
ter residual at higher energies. Bottom frame: The spectrum
of the dark matter template found in our Galactic Center
analysis under our default assumptions, and when the flux
in each energy bin is allowed to float freely for each of the
isotropic, 20 cm, and Galactic diffuse components. Although
the error bars become larger when this additional freedom is
allowed, the residual excess remains and is robust across a
wide range of energies. See text for details.
Appendix E: Variations to the Galactic Center
Analysis
In the default set of templates used in our Galactic
Center analysis, we have employed astrophysical emis-
sion models which include several additional components
that are not included within the official Fermi diffuse
models or source catalogs. These include the two point
sources described in Ref. [47] and a model tracing the
20 cm synchrotron emission. In models without a dark
matter contribution, these structures are extremely sig-
nificant; the addition of the 20 cm template is preferred
with TS=130, and the inclusion of the additional two
point sources is favored with TS=15.9 and 59.3, respec-](https://image.slidesharecdn.com/thecharacterizationofthegammaraysignalfromthecentralmilkwayacompelingcaseforannihilatingdarkmatter-160401005304/85/The-characterization-of_the_gamma_ray_signal_from_the_central_milk_way_a_compeling_case__for_annihilating_dark_m_atter-29-320.jpg)

This document analyzes the gamma-ray signal from the central Milky Way that is consistent with emission from annihilating dark matter particles. The authors re-examine Fermi data using cuts on an event parameter to improve gamma-ray maps and more easily separate components. They find the GeV excess is robust and well-fit by a 36-51 GeV dark matter particle annihilating to bottom quarks with a cross section of 1-3×10⁻²⁶ cm3/s. The signal extends over 10 degrees from the Galactic Center and is spherically symmetric, disfavoring explanations from millisecond pulsars or gas interactions.


![ANIMAL_CELL_,_TISSUE_AND_ORGAN_CULTURE[1].pptx](https://cdn.slidesharecdn.com/ss_thumbnails/animalcelltissueandorganculture1-260204172026-4462b440-thumbnail.jpg?width=640&height=640&fit=bounds)


