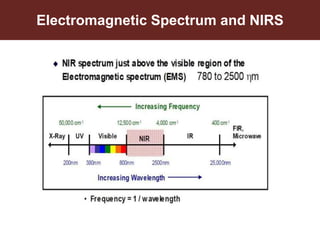
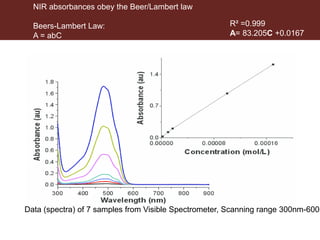
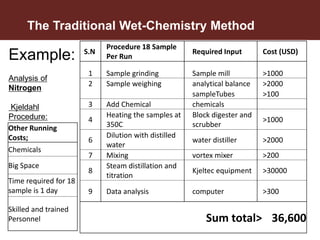
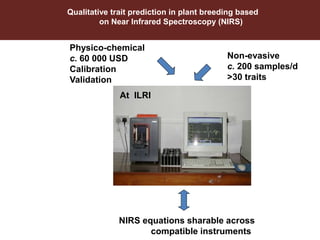
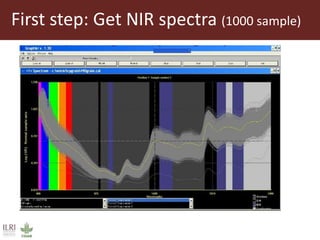
Chemical Analysis via NIR Spectroscopy
Yonas Asmare, ILRI
Identifying Investment Opportunities for Livestock Feed Resources Development in
the Eastern Africa Sub-Region, ILRI Addis, 13–15 December 2017
Purpose
• Introduce Near-infrared Spectroscopy (NIRS)
• Describe:
– Benefits to use NIRS
– How NIRS can be used for feed/Food
Nutrient content analysis
– Advances on NIRS instrumentation
Spectroscopy
Spectroscopy is the study of the interaction
between matter and electromagnetic radiation.
Historically, spectroscopy originated through
the study of visible light dispersed according
to its wavelength, by a prism.
Electromagnetic Spectrum and NIRS
Organic compounds absorb NIR energy
To have an absorption in the near infrared region, the
constituent of interest must have covalent bonds such
as:
O-H, C-H, C=0 C-N, S=O, P-O N-H and S-H.
Inorganic measurements are indirect measurement.
Interaction, Absorption and Measurement
Pre-Dispersive
Monochrometer:
Grating
PbS Detector
Polychromatic
Light
Monochromatic
Light
R² =0.999
A= 83.205C +0.0167
NIR absorbances obey the Beer/Lambert law
Beers-Lambert Law:
A = abC
Data (spectra) of 7 samples from Visible Spectrometer, Scanning range 300nm-600n
0
0.1
0.2
0.3
0.4
0.5
0.6
0.7
0.8
0.9
1
1100 1300 1500 1700 1900 2100 2300
Wavelength, nm
Log1/R
15 % Fat
10 % Fat
6 % Fat
Effect of Constituent Concentration
On NIR Spectra:
Fat Content in Fishmeal
Advantages of NIRS
The Traditional Wet-Chemistry Method
Example:
Analysis of
Nitrogen
Kjeldahl
Procedure:
Other Running
Costs;
Chemicals
Big Space
Time required for 18
sample is 1 day
Skilled and trained
Personnel
S.N
Procedure 18 Sample
Per Run
Required Input Cost (USD)
1 Sample grinding Sample mill >1000
2 Sample weighing analytical balance >2000
sampleTubes >100
3 Add Chemical chemicals
4
Heating the samples at
350C
Block digester and
scrubber
>1000
6
Dilution with distilled
water
water distiller >2000
7 Mixing vortex mixer >200
8
Steam distillation and
titration
Kjeltec equipment >30000
9 Data analysis computer >300
Sum total> 36,600
Qualitative trait prediction in plant breeding based
on Near Infrared Spectroscopy (NIRS)
Non-evasive
c. 200 samples/d
>30 traits
Physico-chemical
c. 60 000 USD
Calibration
Validation
NIRS equations sharable across
compatible instruments
At ILRI
Disadvantages of Wet-chemistry and Advantages of NIRS
Wet Chemistry NIRS
Slow =Time delay 200sample per
month per 8 component
Fast 200sample per day for
>30component
Destructive Non Destructive
Costly
Only initial investment and
calibration development is costly
Personal health and safely Issue No issue
Environmental issues No issue
Single component per day per
person per 18 sample
Multi component per day per
person per 200 sample
Real time data-on site
Equation Sharable across similar platforms
How can NIRS work for you?
Model Development and Prediction
Software for Chemo-metrics
• WinISI,
• ISI scan,
• Matlab
First step: Get NIR spectra (1000 sample)
Second step: Sample selection
Objective: Sample selection for wet-chemistry
NIRS can be used to select sample sets from a
large group of samples which:
Retain a maximum representation of overall
sample population variability
Samples selected better than random because:
Greater recovery of range
Higher variance
Better Kurtosis (more even distribution)
• Do Wet chemistry only on those selected
sample set
• Calibrations are developed by combining Wet-
chemistry data and NIRS Spectra(Data)
• These calibrations can be used to predict the
remaining samples.
Requires large sample sets
ncalibration :100 samples recommended
Third step: Model development
Methionine prediction by NIRS
ILRI-Lab-ID DM% ASH% N(%) NDF% ADF% ADL%
ME(MJ/k
g) IVOMD%
83708 96.09 11.82 0.82 77.18 51.70 6.53 6.64 46.42
83709 95.91 12.58 0.84 74.86 50.59 6.14 6.76 47.26
83710 96.22 11.81 0.79 77.89 52.36 6.65 6.66 46.45
83711 96.19 12.23 0.81 75.85 50.79 6.27 6.67 46.71
83712 96.18 10.35 0.76 77.44 51.06 6.43 6.69 46.46
83713 95.52 12.35 1.03 74.52 49.44 6.36 6.59 46.50
83714 96.14 12.19 0.92 75.09 49.74 6.18 6.69 47.06
83715 96.53 12.22 0.87 76.33 51.40 6.50 6.67 46.83
83716 95.91 12.26 1.04 73.52 48.49 6.09 6.70 47.39
83717 96.04 12.03 0.86 75.94 51.37 6.38 6.63 46.46
83718 96.10 11.29 0.84 76.97 51.13 6.53 6.62 46.31
83719 96.11 11.68 0.80 77.14 52.24 6.67 6.70 46.80
83720 96.35 11.02 0.74 78.81 52.78 6.68 6.61 46.07
NIRS prediction result
NIRS
-Up to 30
parameter in
1minutes;
-200 samples per
day.
-3USD per sample
Traditional wet-
chemistry
-it takes 1month to
analyze 200
sample.
-USD68 per sample
for 8 parameters
Tools
The Tools
Foss NIRS system model 5000 & 6500
Stationary
NIRS
Mobile handheld NIRS
• About USD 40 000 but price
decreasing
• Application currently developed and validated
at ILRI India and Ethiopia
Brimrose
Luminar 5030
Phazir
Mobile NIRS medium size
Real time application of mobile-NIRS
Miniaturized NIRS
• Scio, Pocket
Molecular Sensor
startup company
o 900nm -1052
nm
o Need internet
connection
o Data saved on
the cloud
• NIR Scan Nano;
Texa Instruments
o 900-1700nm
Limitations of NIR Technology
• The most important limitation of the technology lies in the
development of calibrations.
• Different calibrations apply to
different products such as:
o corn leaf vs. sugarcane leaf.
• At present NIRS is not practical for small sample groups
This presentation is licensed for use under the Creative Commons Attribution 4.0 International Licence.
better lives through livestock
ilri.org
ILRI thanks all donors and organizations who globally supported its work through their contributions
to the CGIAR system

Chemical analysis via NIR spectroscopy

  • 1.
    Chemical Analysis viaNIR Spectroscopy Yonas Asmare, ILRI Identifying Investment Opportunities for Livestock Feed Resources Development in the Eastern Africa Sub-Region, ILRI Addis, 13–15 December 2017
  • 2.
    Purpose • Introduce Near-infraredSpectroscopy (NIRS) • Describe: – Benefits to use NIRS – How NIRS can be used for feed/Food Nutrient content analysis – Advances on NIRS instrumentation
  • 3.
    Spectroscopy Spectroscopy is thestudy of the interaction between matter and electromagnetic radiation. Historically, spectroscopy originated through the study of visible light dispersed according to its wavelength, by a prism.
  • 4.
  • 5.
    Organic compounds absorbNIR energy To have an absorption in the near infrared region, the constituent of interest must have covalent bonds such as: O-H, C-H, C=0 C-N, S=O, P-O N-H and S-H. Inorganic measurements are indirect measurement. Interaction, Absorption and Measurement
  • 6.
  • 7.
    R² =0.999 A= 83.205C+0.0167 NIR absorbances obey the Beer/Lambert law Beers-Lambert Law: A = abC Data (spectra) of 7 samples from Visible Spectrometer, Scanning range 300nm-600n
  • 8.
    0 0.1 0.2 0.3 0.4 0.5 0.6 0.7 0.8 0.9 1 1100 1300 15001700 1900 2100 2300 Wavelength, nm Log1/R 15 % Fat 10 % Fat 6 % Fat Effect of Constituent Concentration On NIR Spectra: Fat Content in Fishmeal
  • 9.
  • 10.
    The Traditional Wet-ChemistryMethod Example: Analysis of Nitrogen Kjeldahl Procedure: Other Running Costs; Chemicals Big Space Time required for 18 sample is 1 day Skilled and trained Personnel S.N Procedure 18 Sample Per Run Required Input Cost (USD) 1 Sample grinding Sample mill >1000 2 Sample weighing analytical balance >2000 sampleTubes >100 3 Add Chemical chemicals 4 Heating the samples at 350C Block digester and scrubber >1000 6 Dilution with distilled water water distiller >2000 7 Mixing vortex mixer >200 8 Steam distillation and titration Kjeltec equipment >30000 9 Data analysis computer >300 Sum total> 36,600
  • 11.
    Qualitative trait predictionin plant breeding based on Near Infrared Spectroscopy (NIRS) Non-evasive c. 200 samples/d >30 traits Physico-chemical c. 60 000 USD Calibration Validation NIRS equations sharable across compatible instruments At ILRI
  • 12.
    Disadvantages of Wet-chemistryand Advantages of NIRS Wet Chemistry NIRS Slow =Time delay 200sample per month per 8 component Fast 200sample per day for >30component Destructive Non Destructive Costly Only initial investment and calibration development is costly Personal health and safely Issue No issue Environmental issues No issue Single component per day per person per 18 sample Multi component per day per person per 200 sample Real time data-on site Equation Sharable across similar platforms
  • 13.
    How can NIRSwork for you?
  • 14.
    Model Development andPrediction Software for Chemo-metrics • WinISI, • ISI scan, • Matlab
  • 15.
    First step: GetNIR spectra (1000 sample)
  • 16.
    Second step: Sampleselection Objective: Sample selection for wet-chemistry NIRS can be used to select sample sets from a large group of samples which: Retain a maximum representation of overall sample population variability Samples selected better than random because: Greater recovery of range Higher variance Better Kurtosis (more even distribution)
  • 17.
    • Do Wetchemistry only on those selected sample set • Calibrations are developed by combining Wet- chemistry data and NIRS Spectra(Data) • These calibrations can be used to predict the remaining samples. Requires large sample sets ncalibration :100 samples recommended Third step: Model development
  • 18.
  • 19.
    ILRI-Lab-ID DM% ASH%N(%) NDF% ADF% ADL% ME(MJ/k g) IVOMD% 83708 96.09 11.82 0.82 77.18 51.70 6.53 6.64 46.42 83709 95.91 12.58 0.84 74.86 50.59 6.14 6.76 47.26 83710 96.22 11.81 0.79 77.89 52.36 6.65 6.66 46.45 83711 96.19 12.23 0.81 75.85 50.79 6.27 6.67 46.71 83712 96.18 10.35 0.76 77.44 51.06 6.43 6.69 46.46 83713 95.52 12.35 1.03 74.52 49.44 6.36 6.59 46.50 83714 96.14 12.19 0.92 75.09 49.74 6.18 6.69 47.06 83715 96.53 12.22 0.87 76.33 51.40 6.50 6.67 46.83 83716 95.91 12.26 1.04 73.52 48.49 6.09 6.70 47.39 83717 96.04 12.03 0.86 75.94 51.37 6.38 6.63 46.46 83718 96.10 11.29 0.84 76.97 51.13 6.53 6.62 46.31 83719 96.11 11.68 0.80 77.14 52.24 6.67 6.70 46.80 83720 96.35 11.02 0.74 78.81 52.78 6.68 6.61 46.07 NIRS prediction result NIRS -Up to 30 parameter in 1minutes; -200 samples per day. -3USD per sample Traditional wet- chemistry -it takes 1month to analyze 200 sample. -USD68 per sample for 8 parameters
  • 20.
  • 21.
    The Tools Foss NIRSsystem model 5000 & 6500 Stationary NIRS
  • 22.
    Mobile handheld NIRS •About USD 40 000 but price decreasing • Application currently developed and validated at ILRI India and Ethiopia Brimrose Luminar 5030 Phazir Mobile NIRS medium size
  • 23.
    Real time applicationof mobile-NIRS
  • 24.
    Miniaturized NIRS • Scio,Pocket Molecular Sensor startup company o 900nm -1052 nm o Need internet connection o Data saved on the cloud • NIR Scan Nano; Texa Instruments o 900-1700nm
  • 25.
    Limitations of NIRTechnology • The most important limitation of the technology lies in the development of calibrations. • Different calibrations apply to different products such as: o corn leaf vs. sugarcane leaf. • At present NIRS is not practical for small sample groups
  • 26.
    This presentation islicensed for use under the Creative Commons Attribution 4.0 International Licence. better lives through livestock ilri.org ILRI thanks all donors and organizations who globally supported its work through their contributions to the CGIAR system