Download as PDF, PPTX
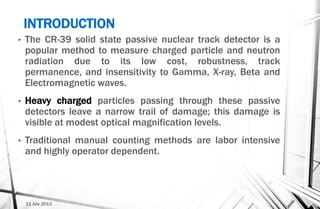
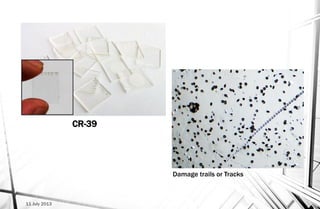
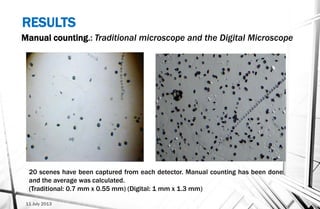
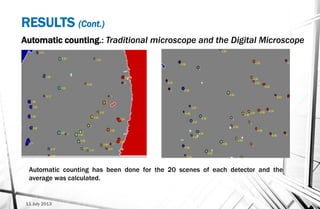
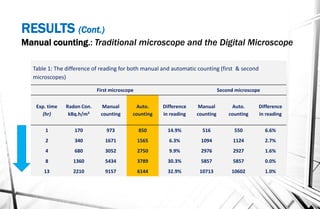
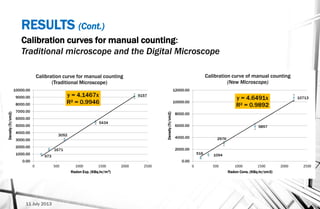
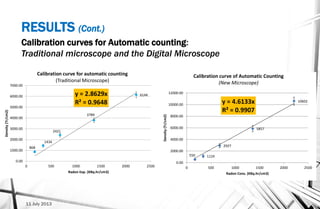
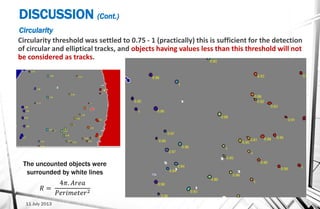


The document describes the development and implementation of an automatic track counting system for CR-39 solid state nuclear track detectors. The system uses a MATLAB software program to automatically count tracks from microscope images of etched CR-39 detectors. CR-39 detectors were exposed to different radiation levels and counted manually and automatically. Results found the automatic counts had up to 30% difference from manual counts, with the new digital microscope providing more accurate automatic counts than the traditional microscope. The system takes less than one minute to count tracks per detector. Future work aims to improve counting of overlapping tracks and develop an automatic thresholding algorithm.