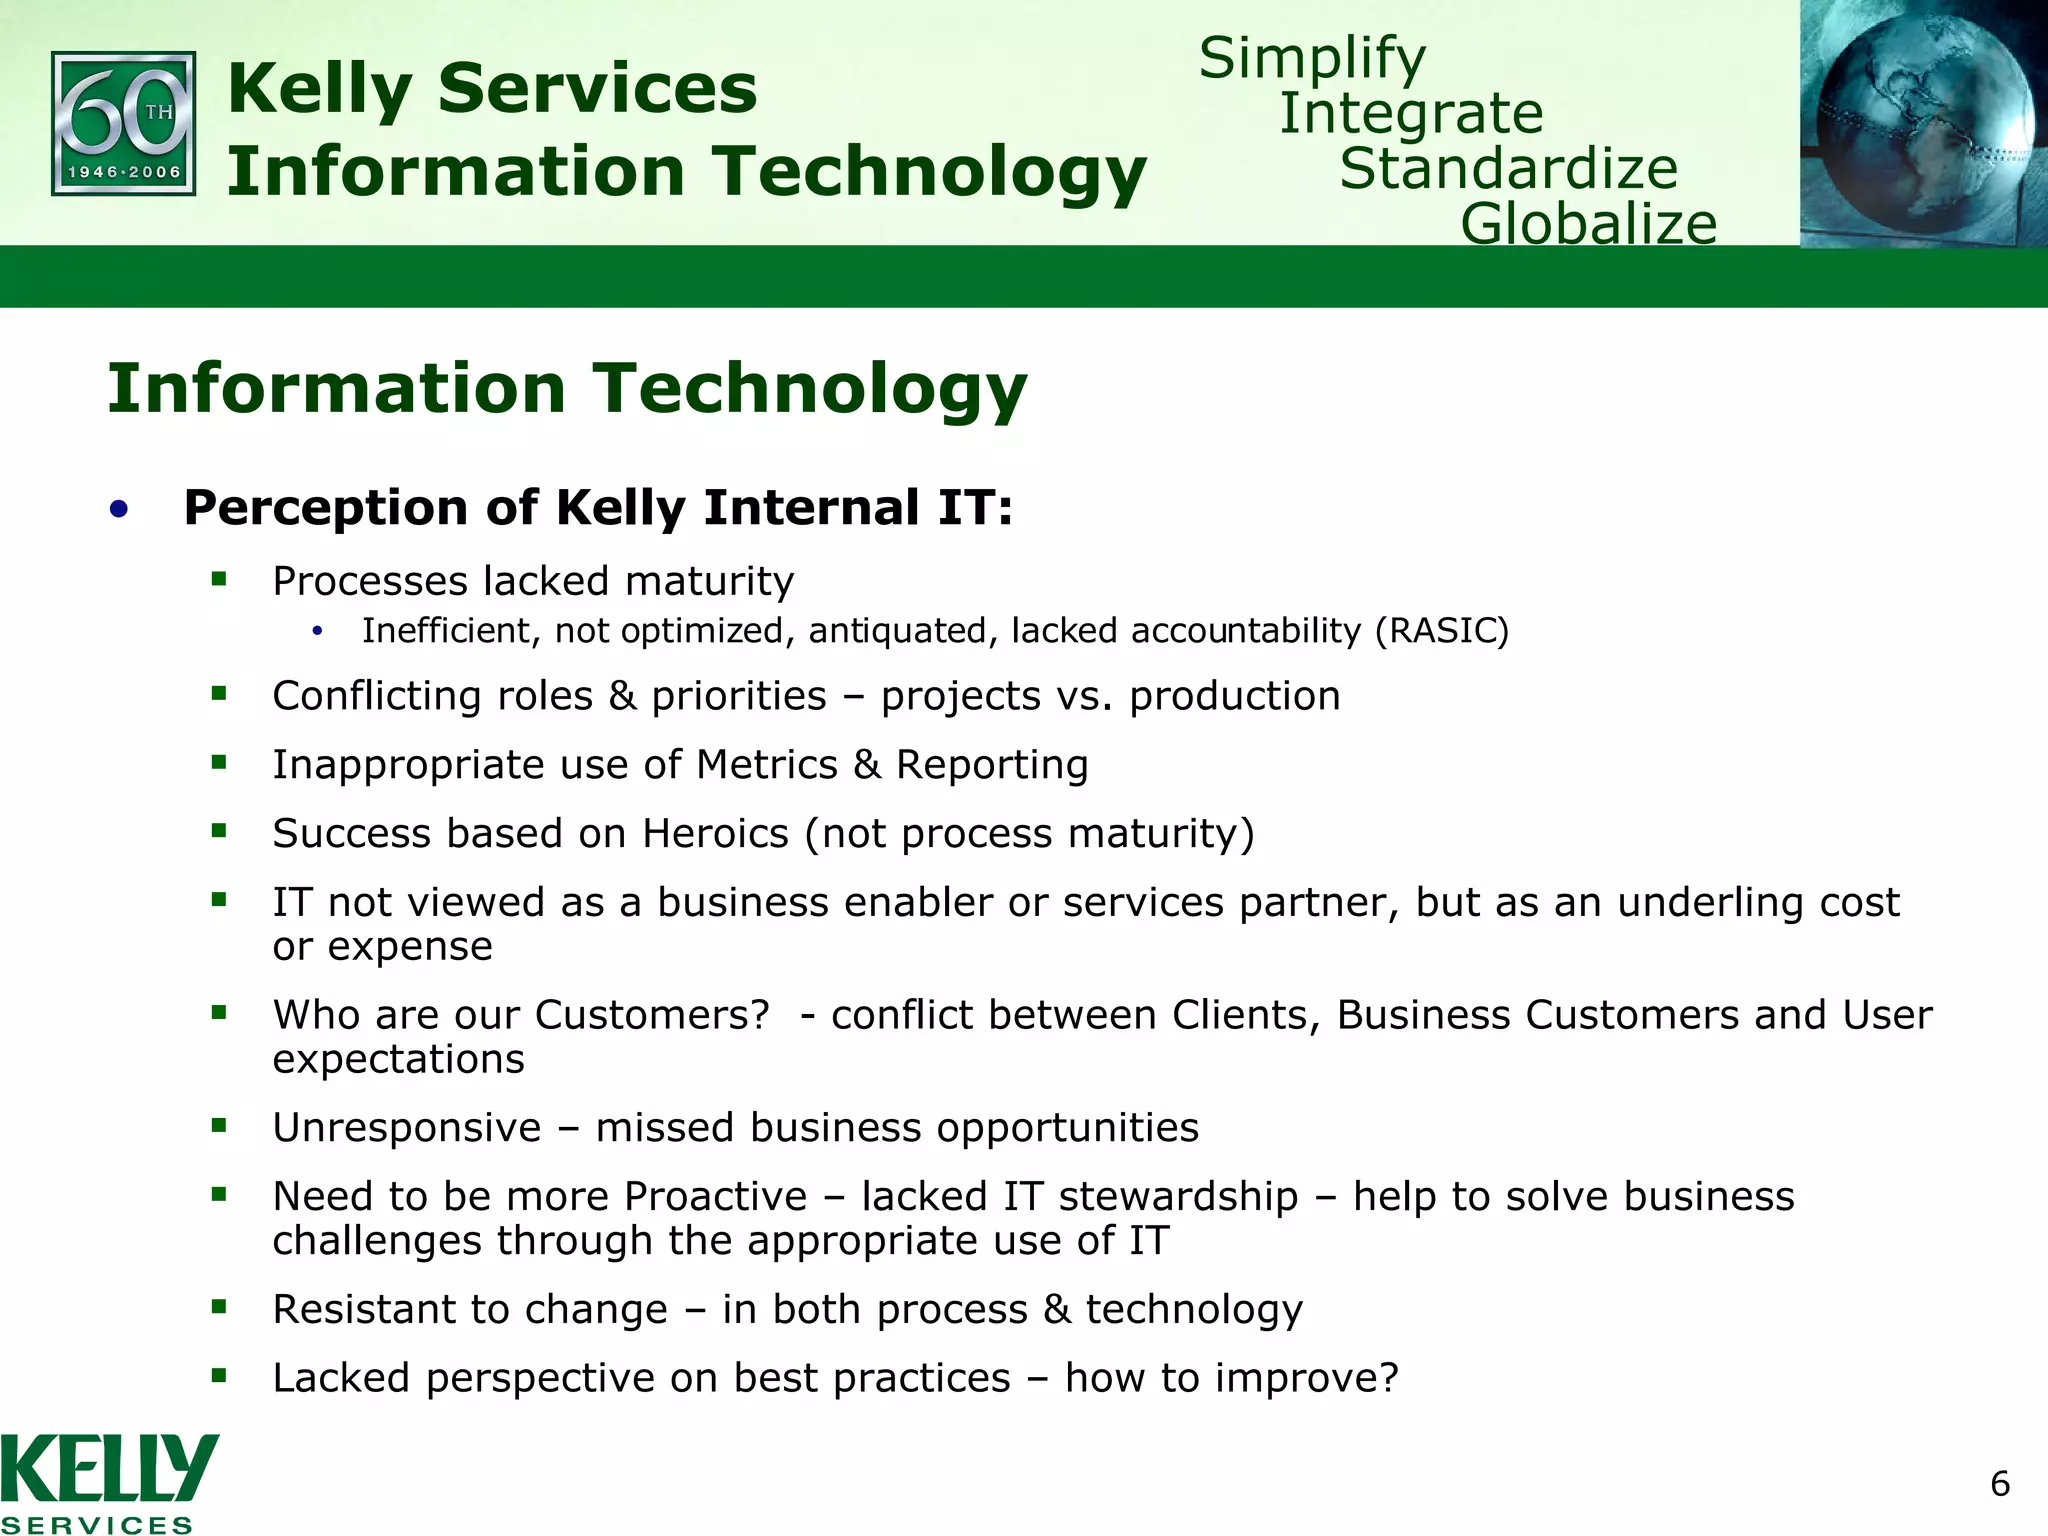
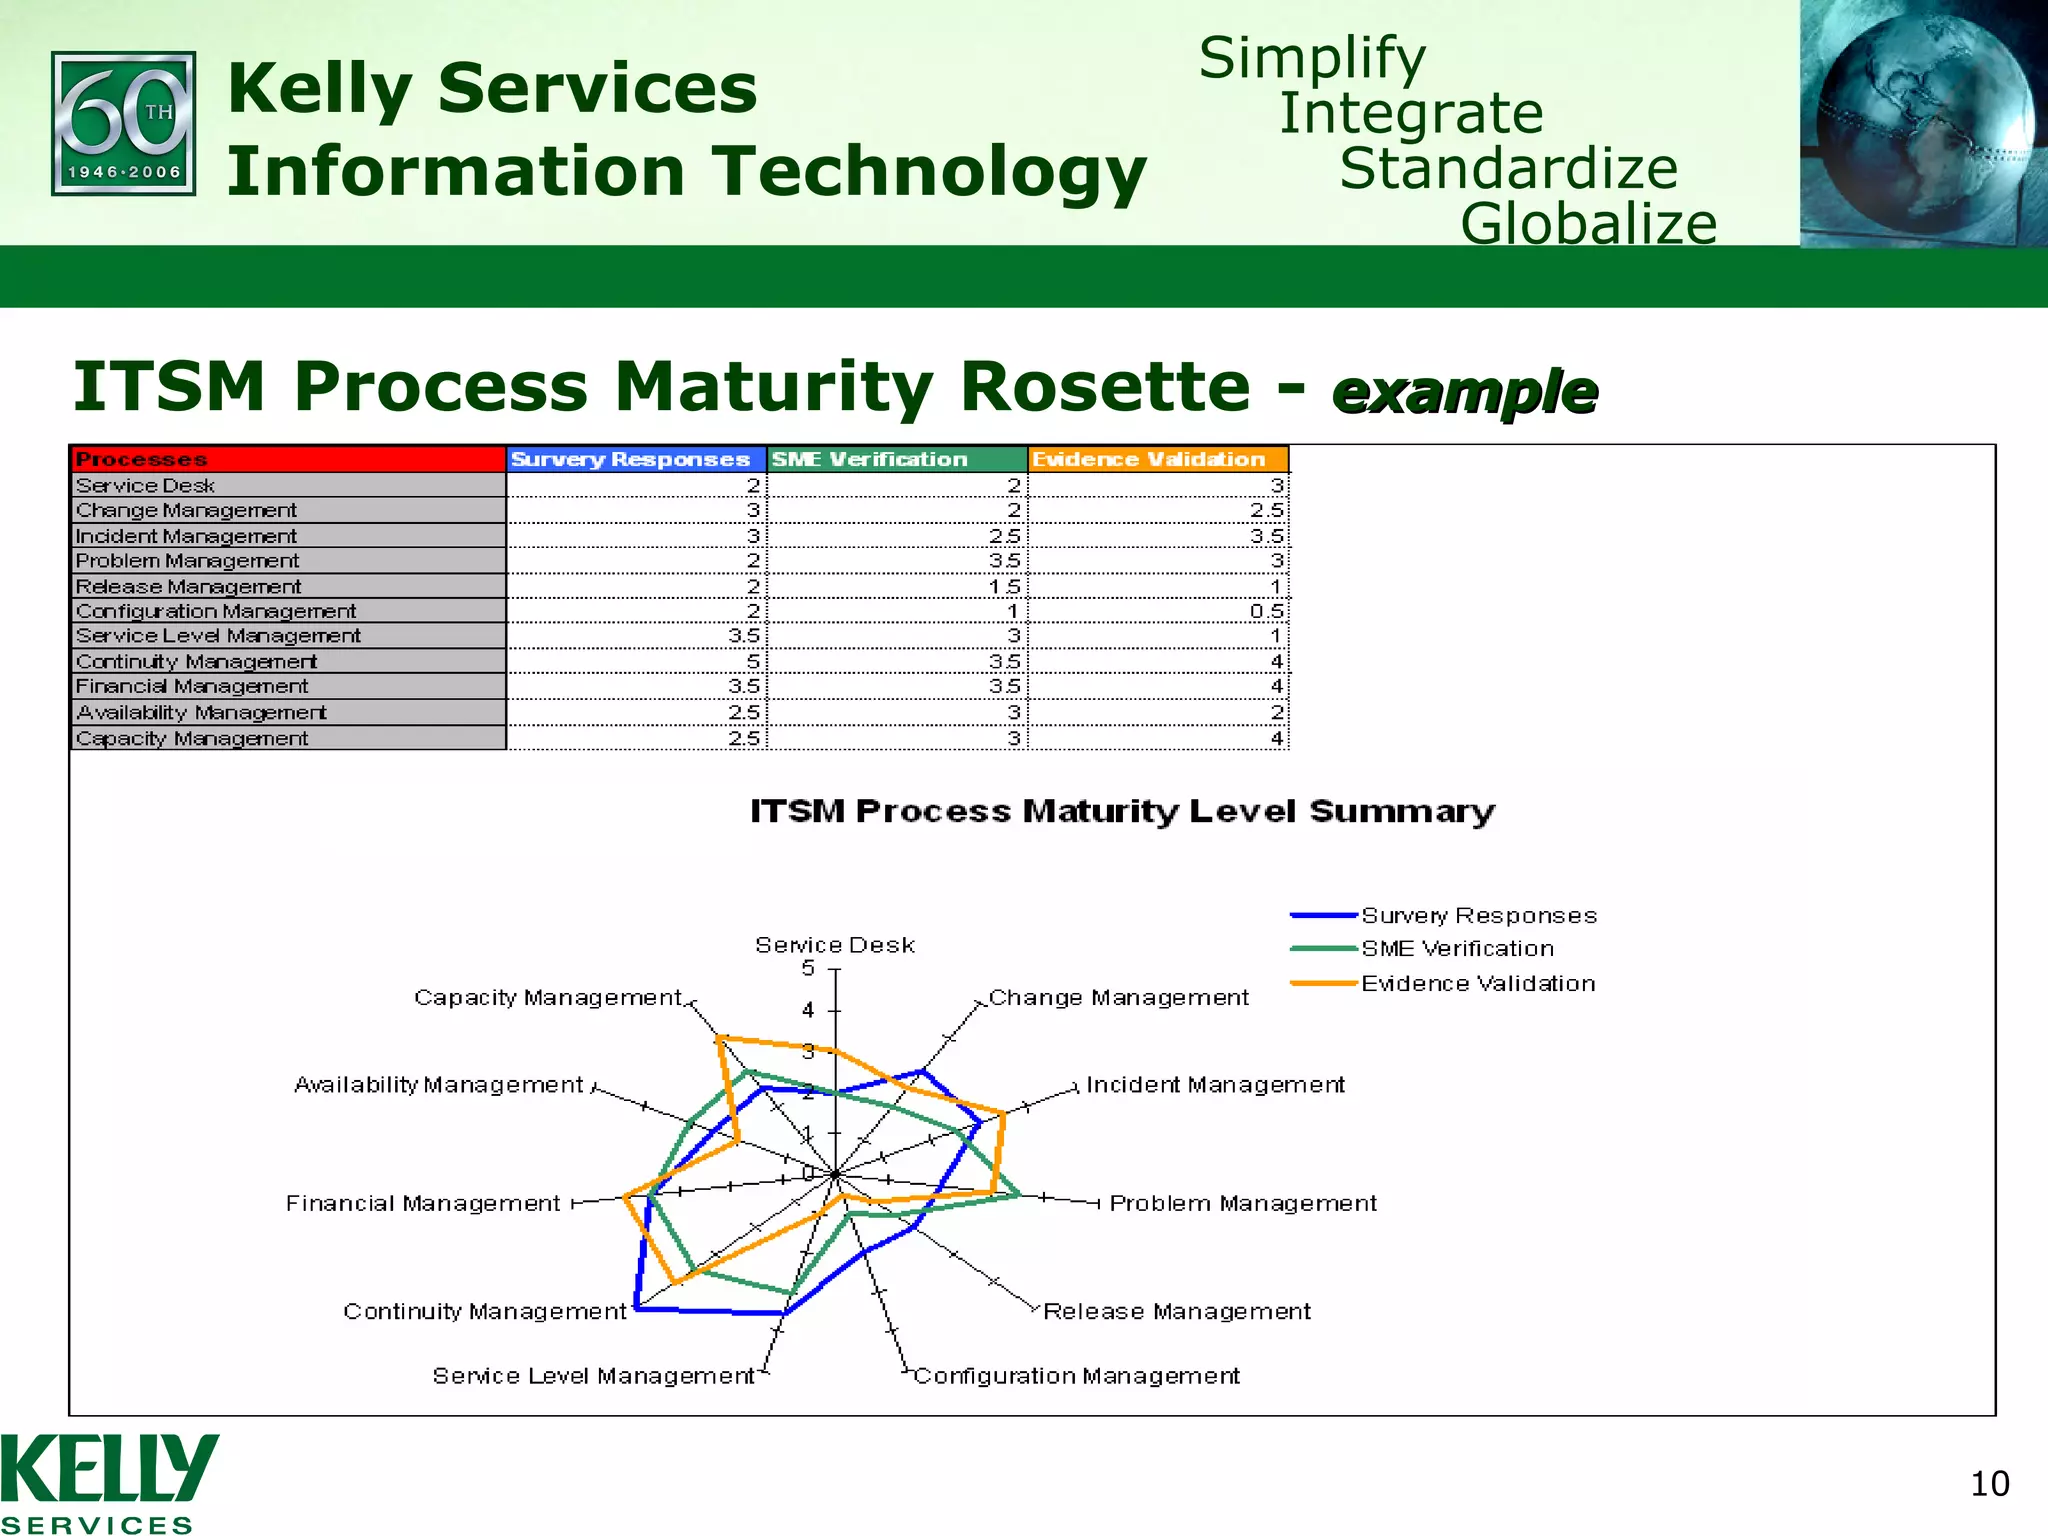
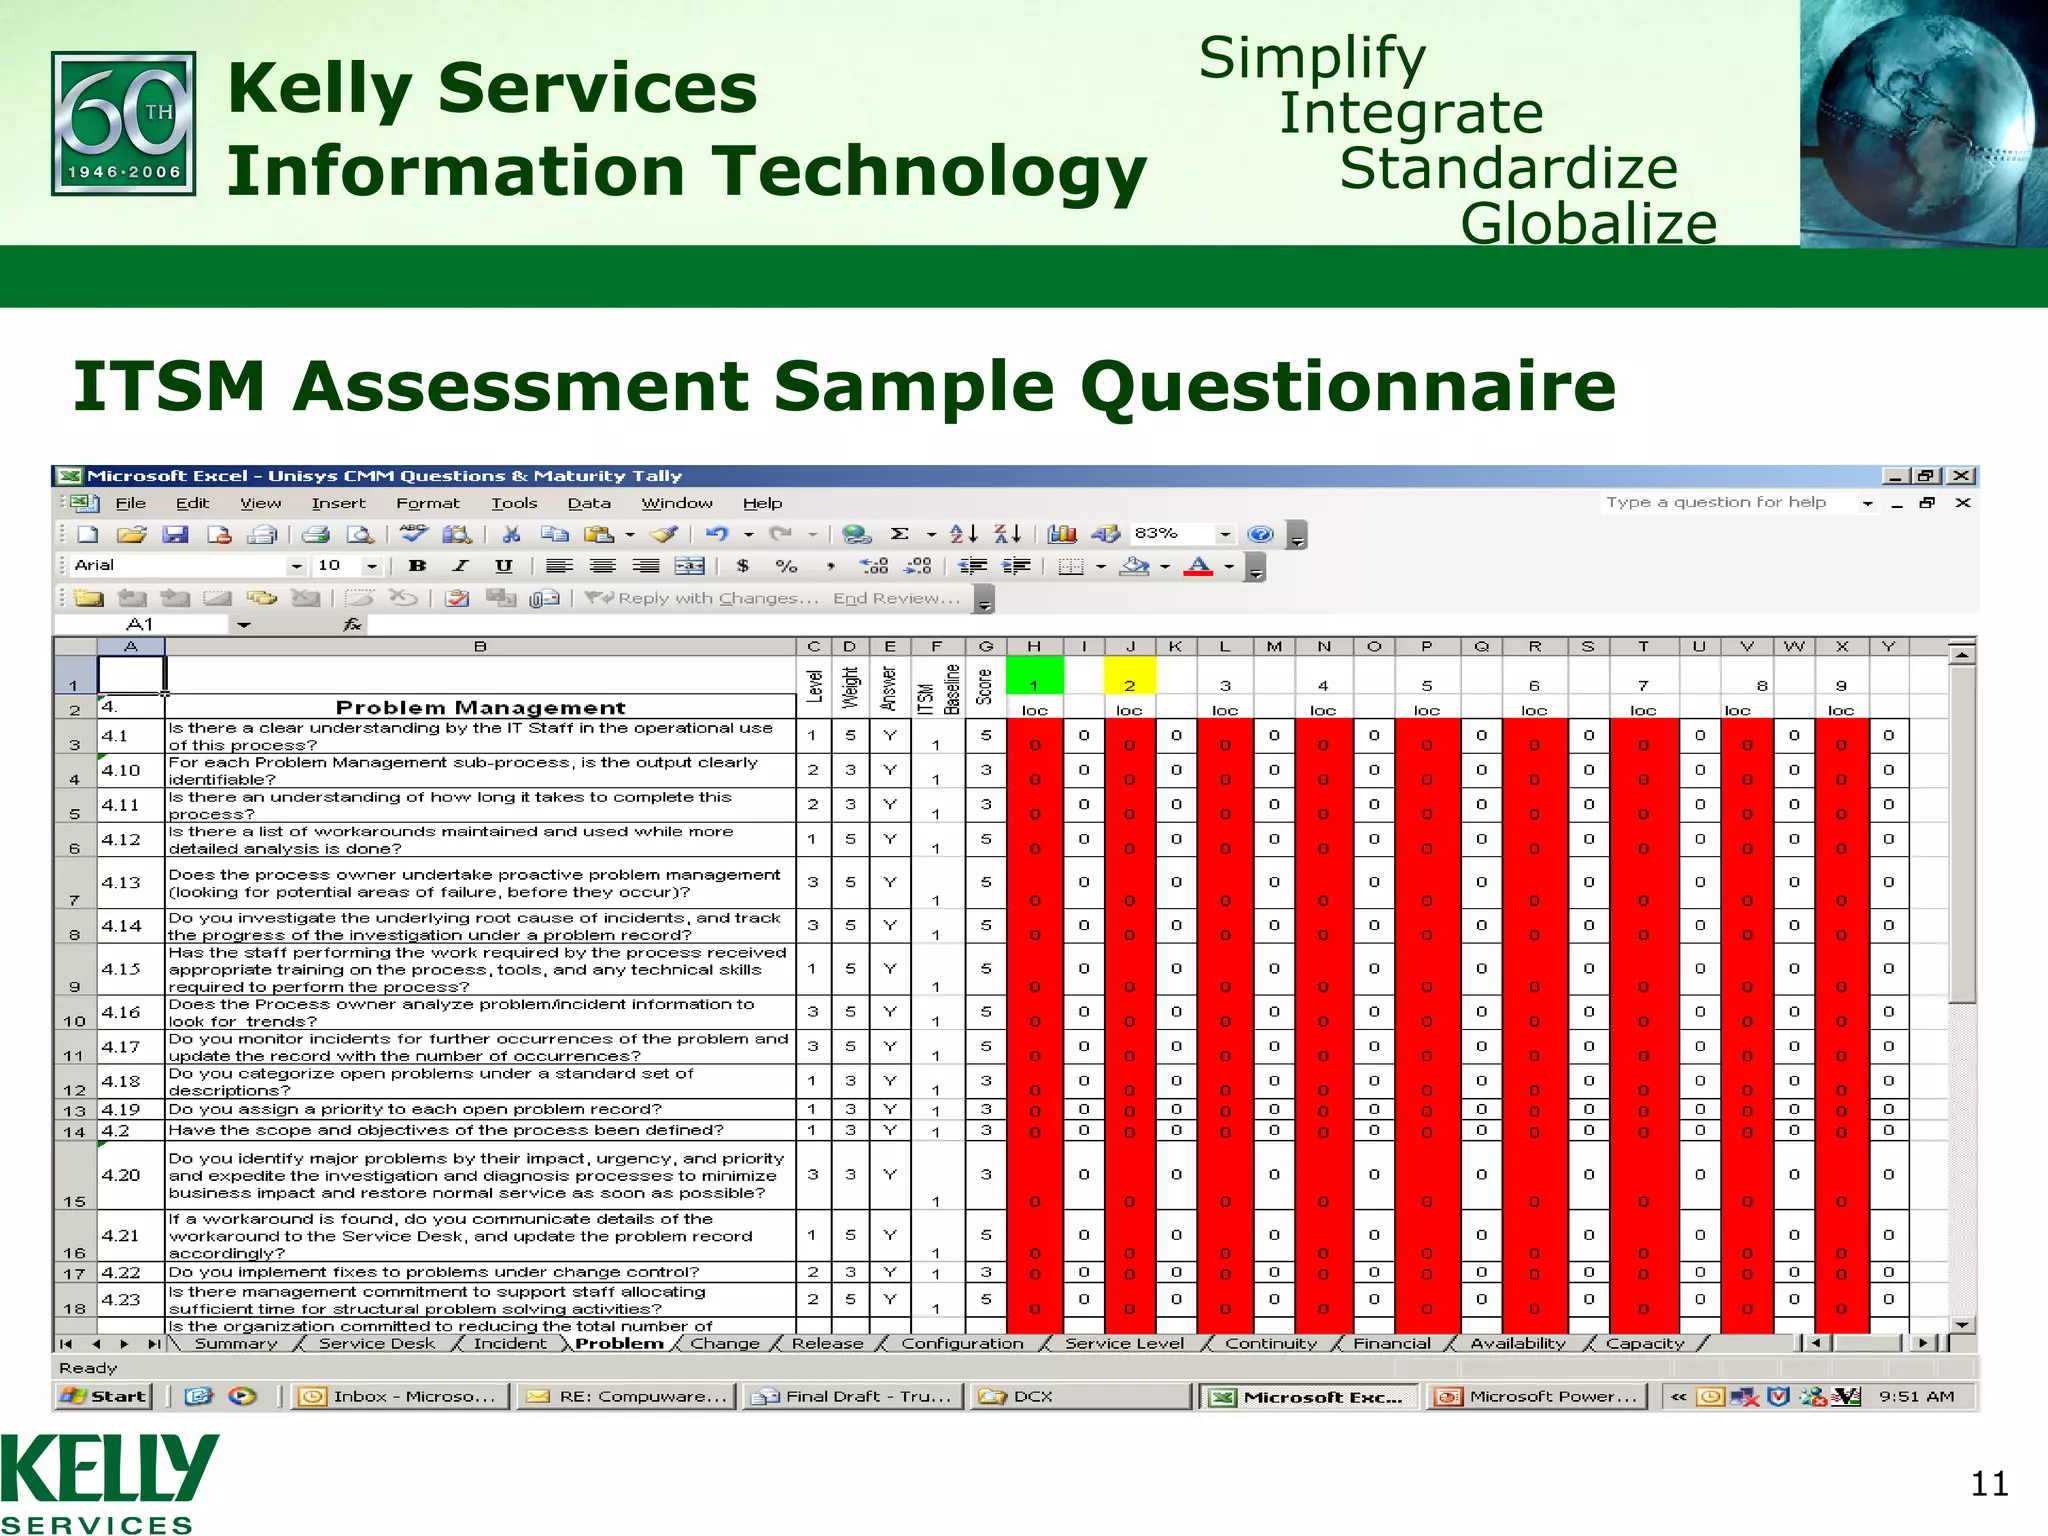
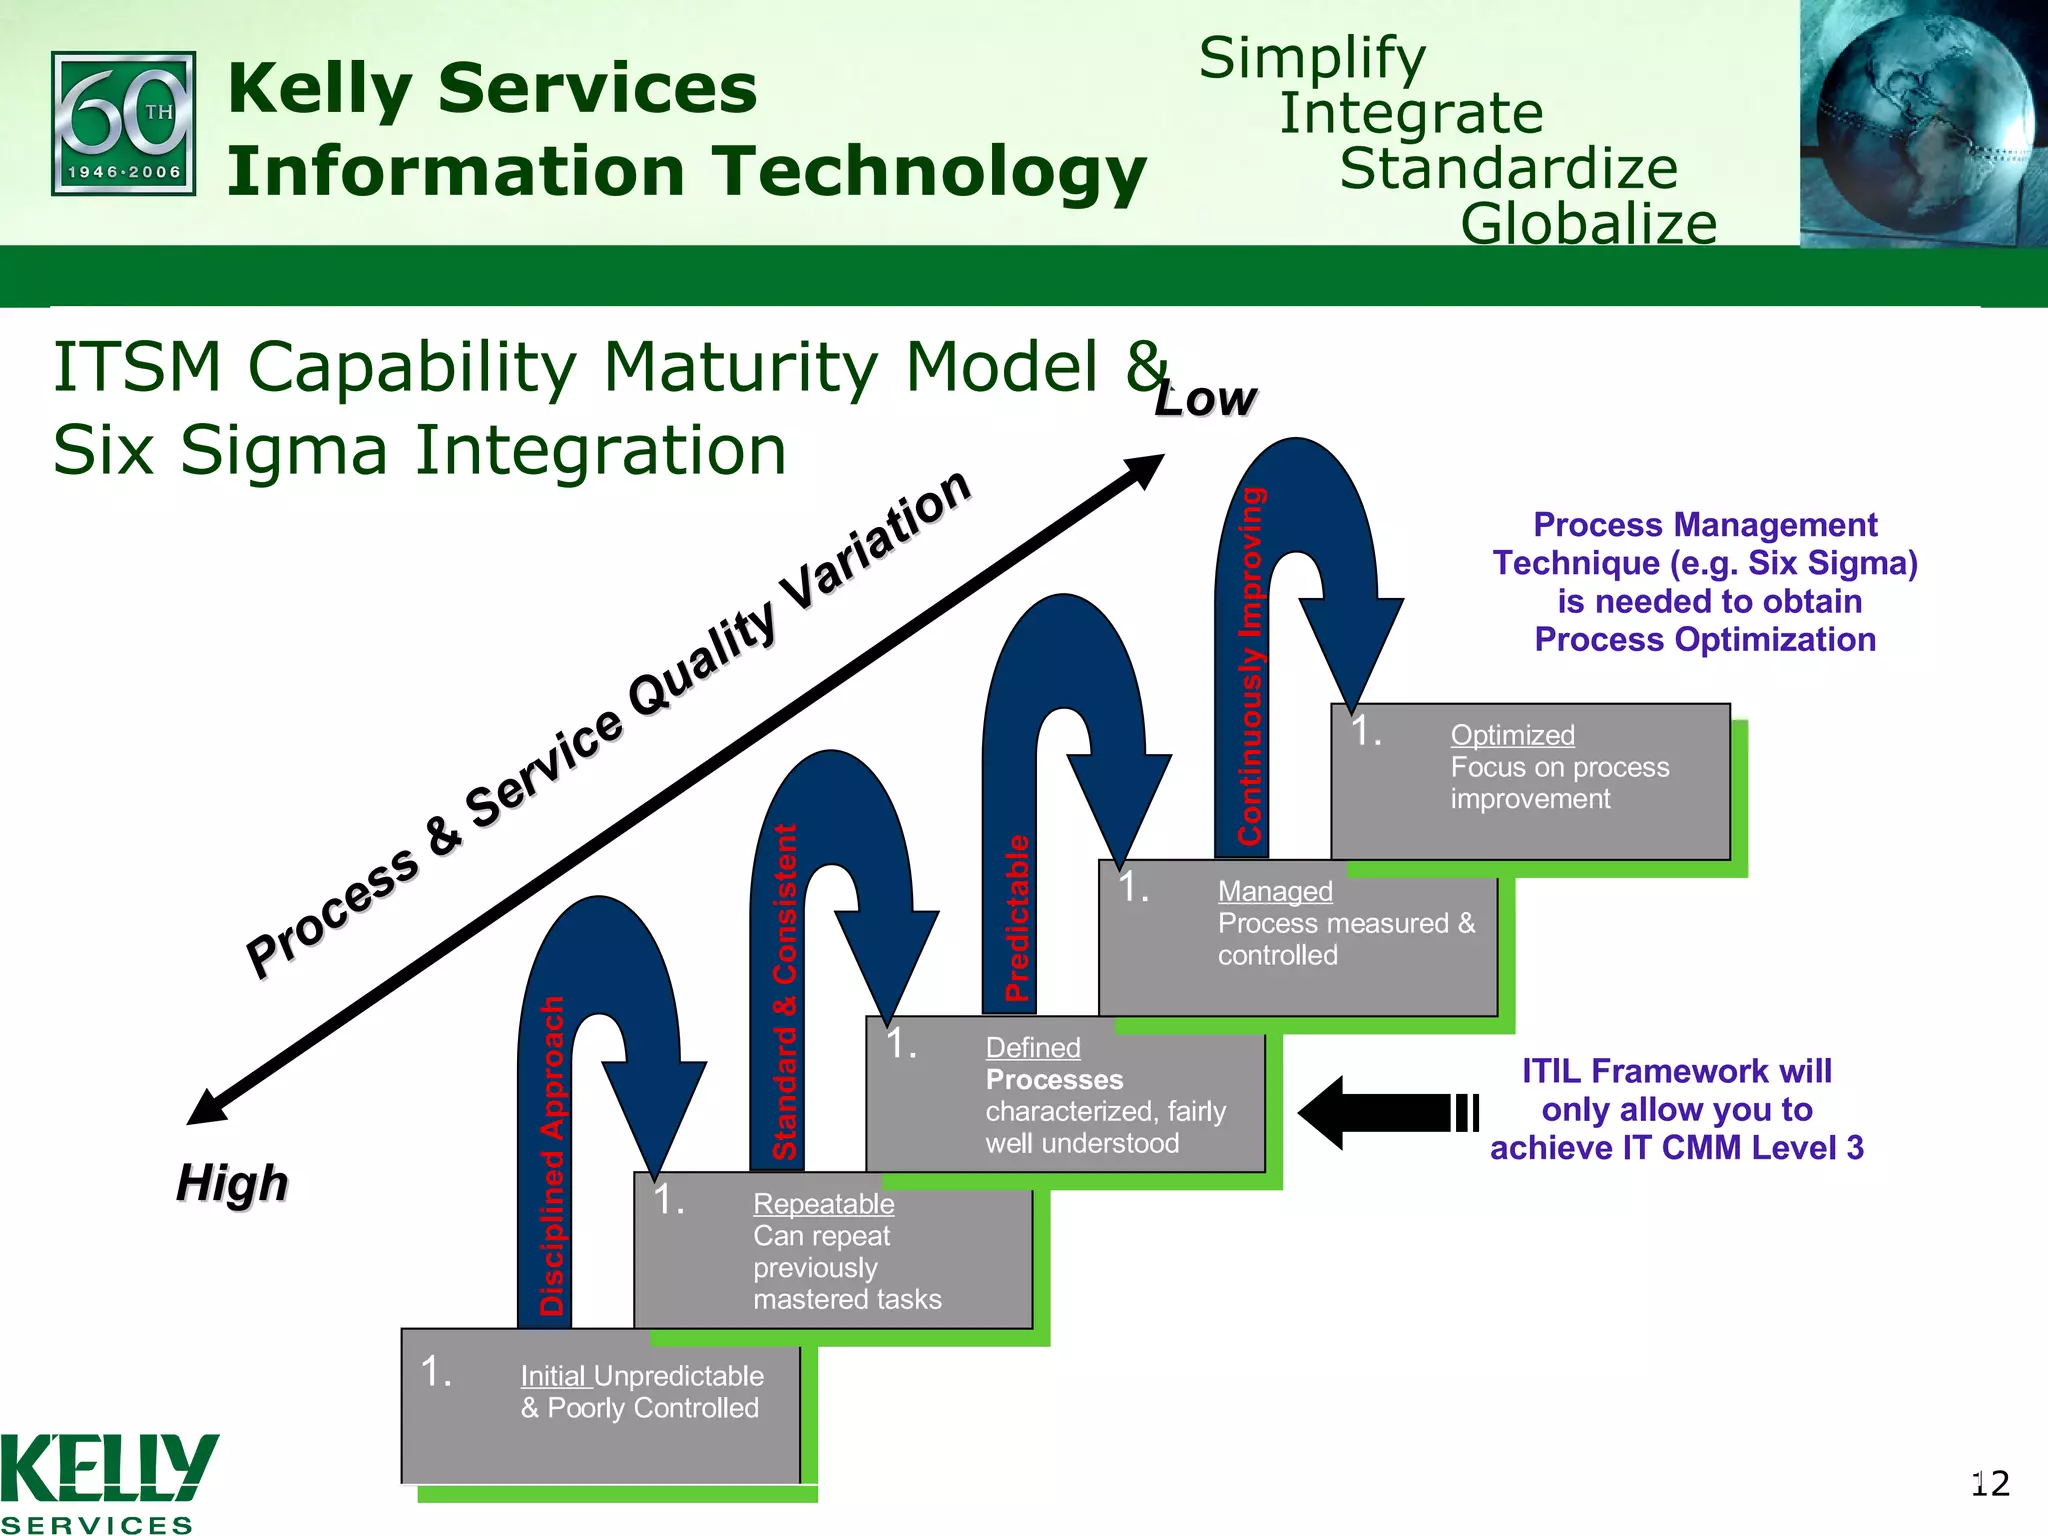
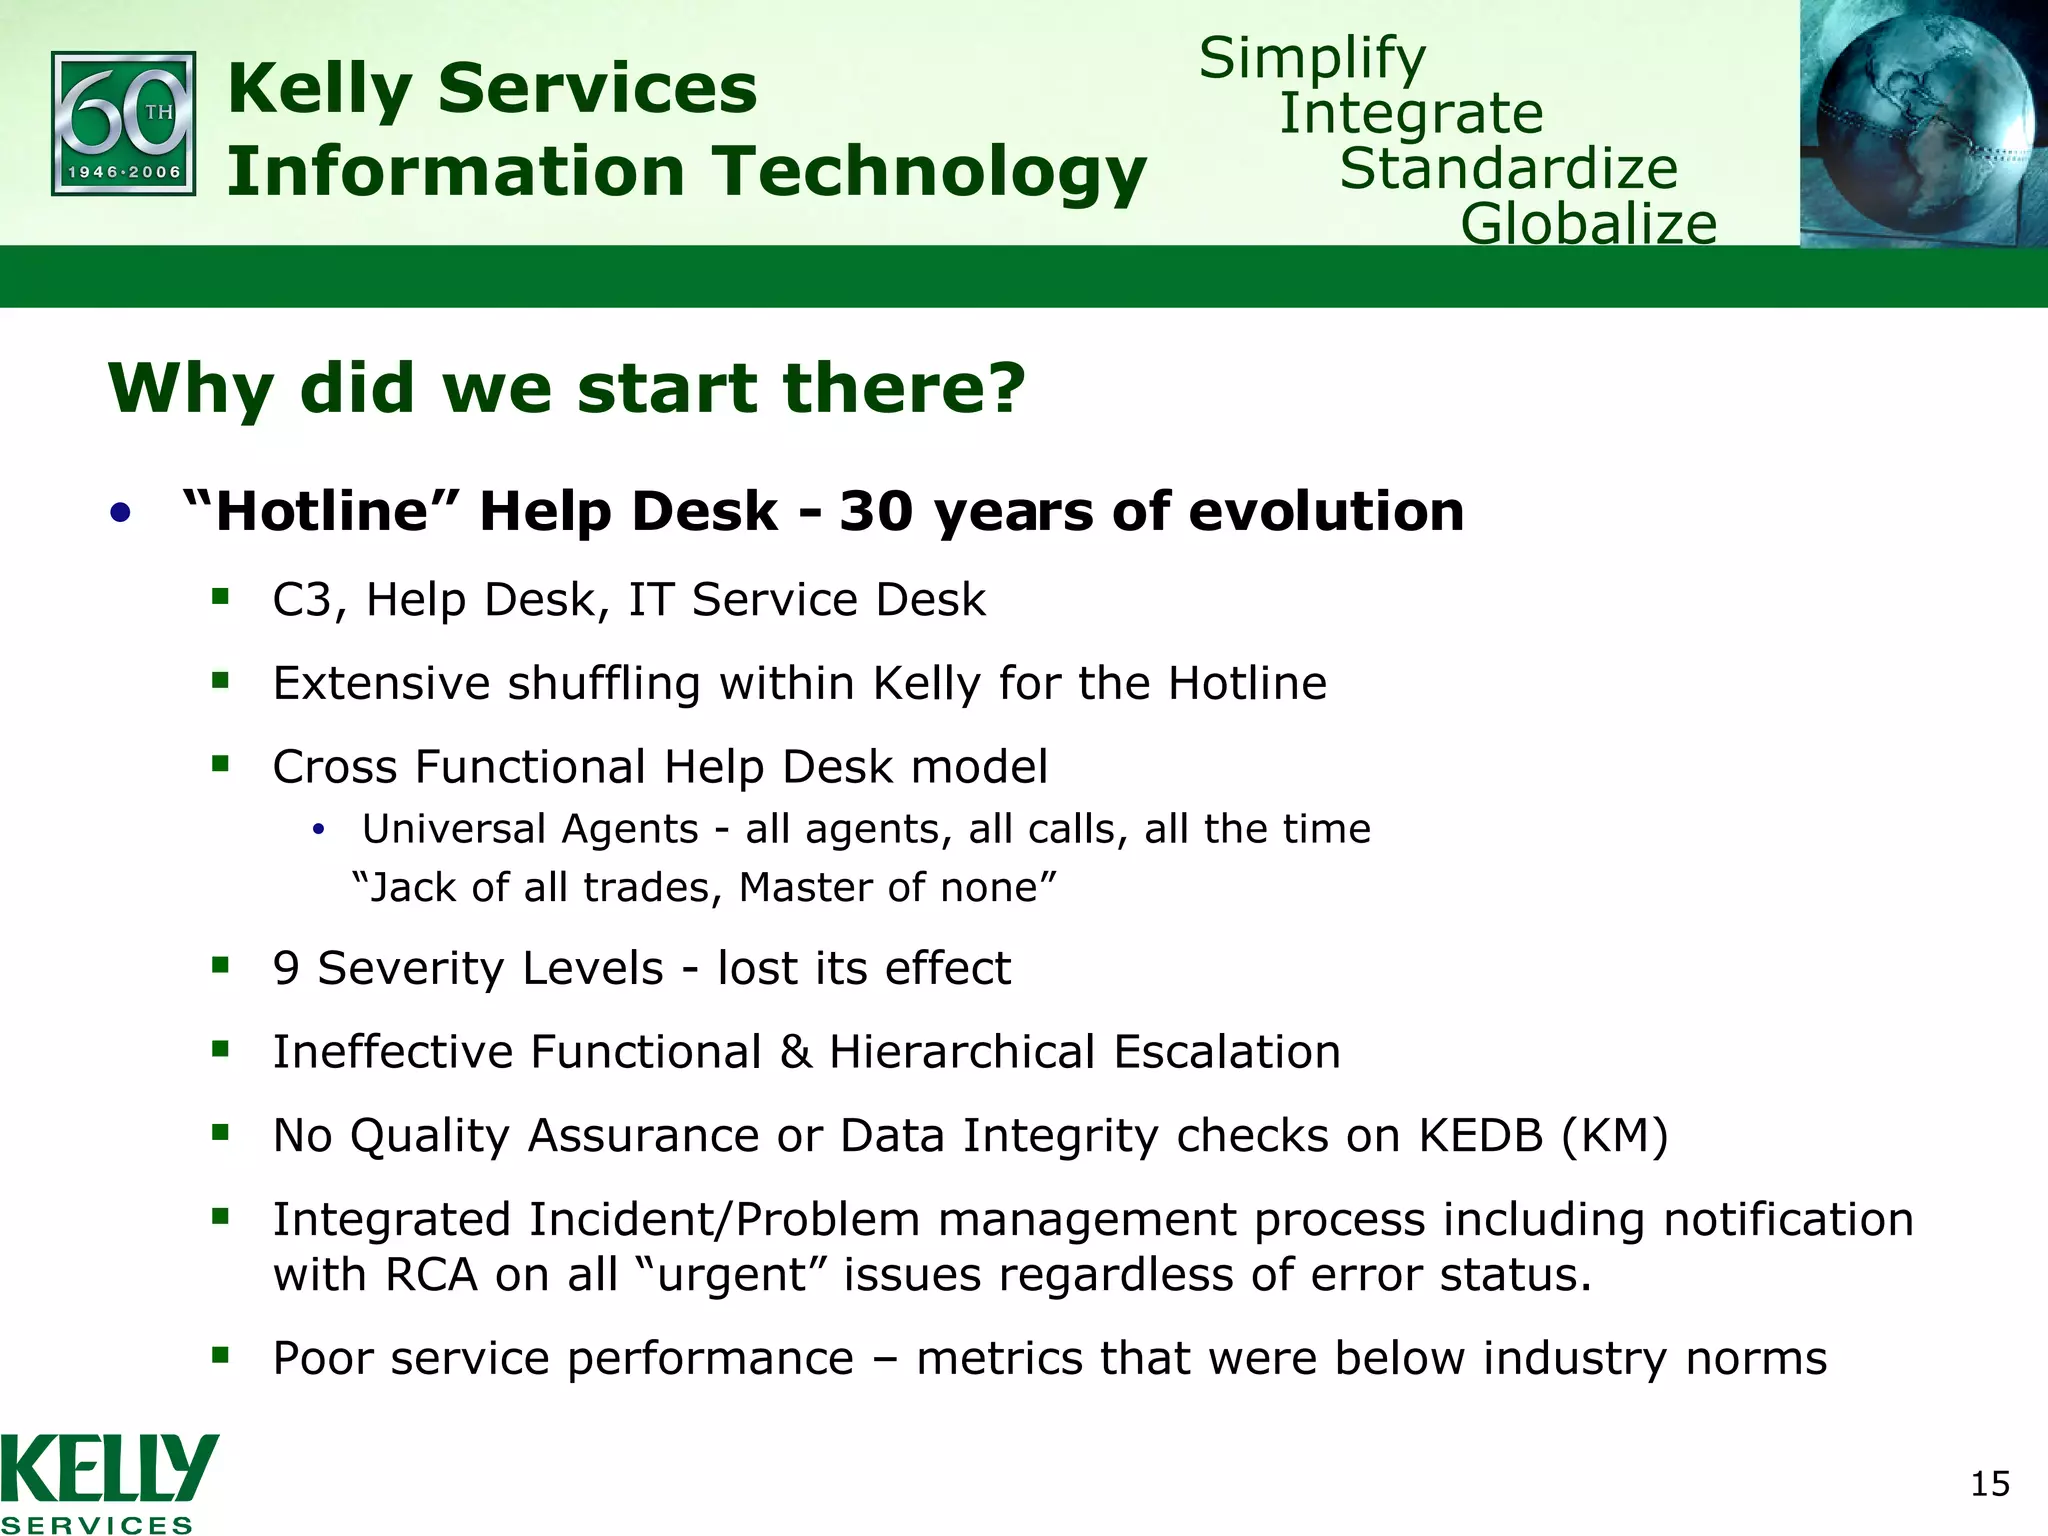
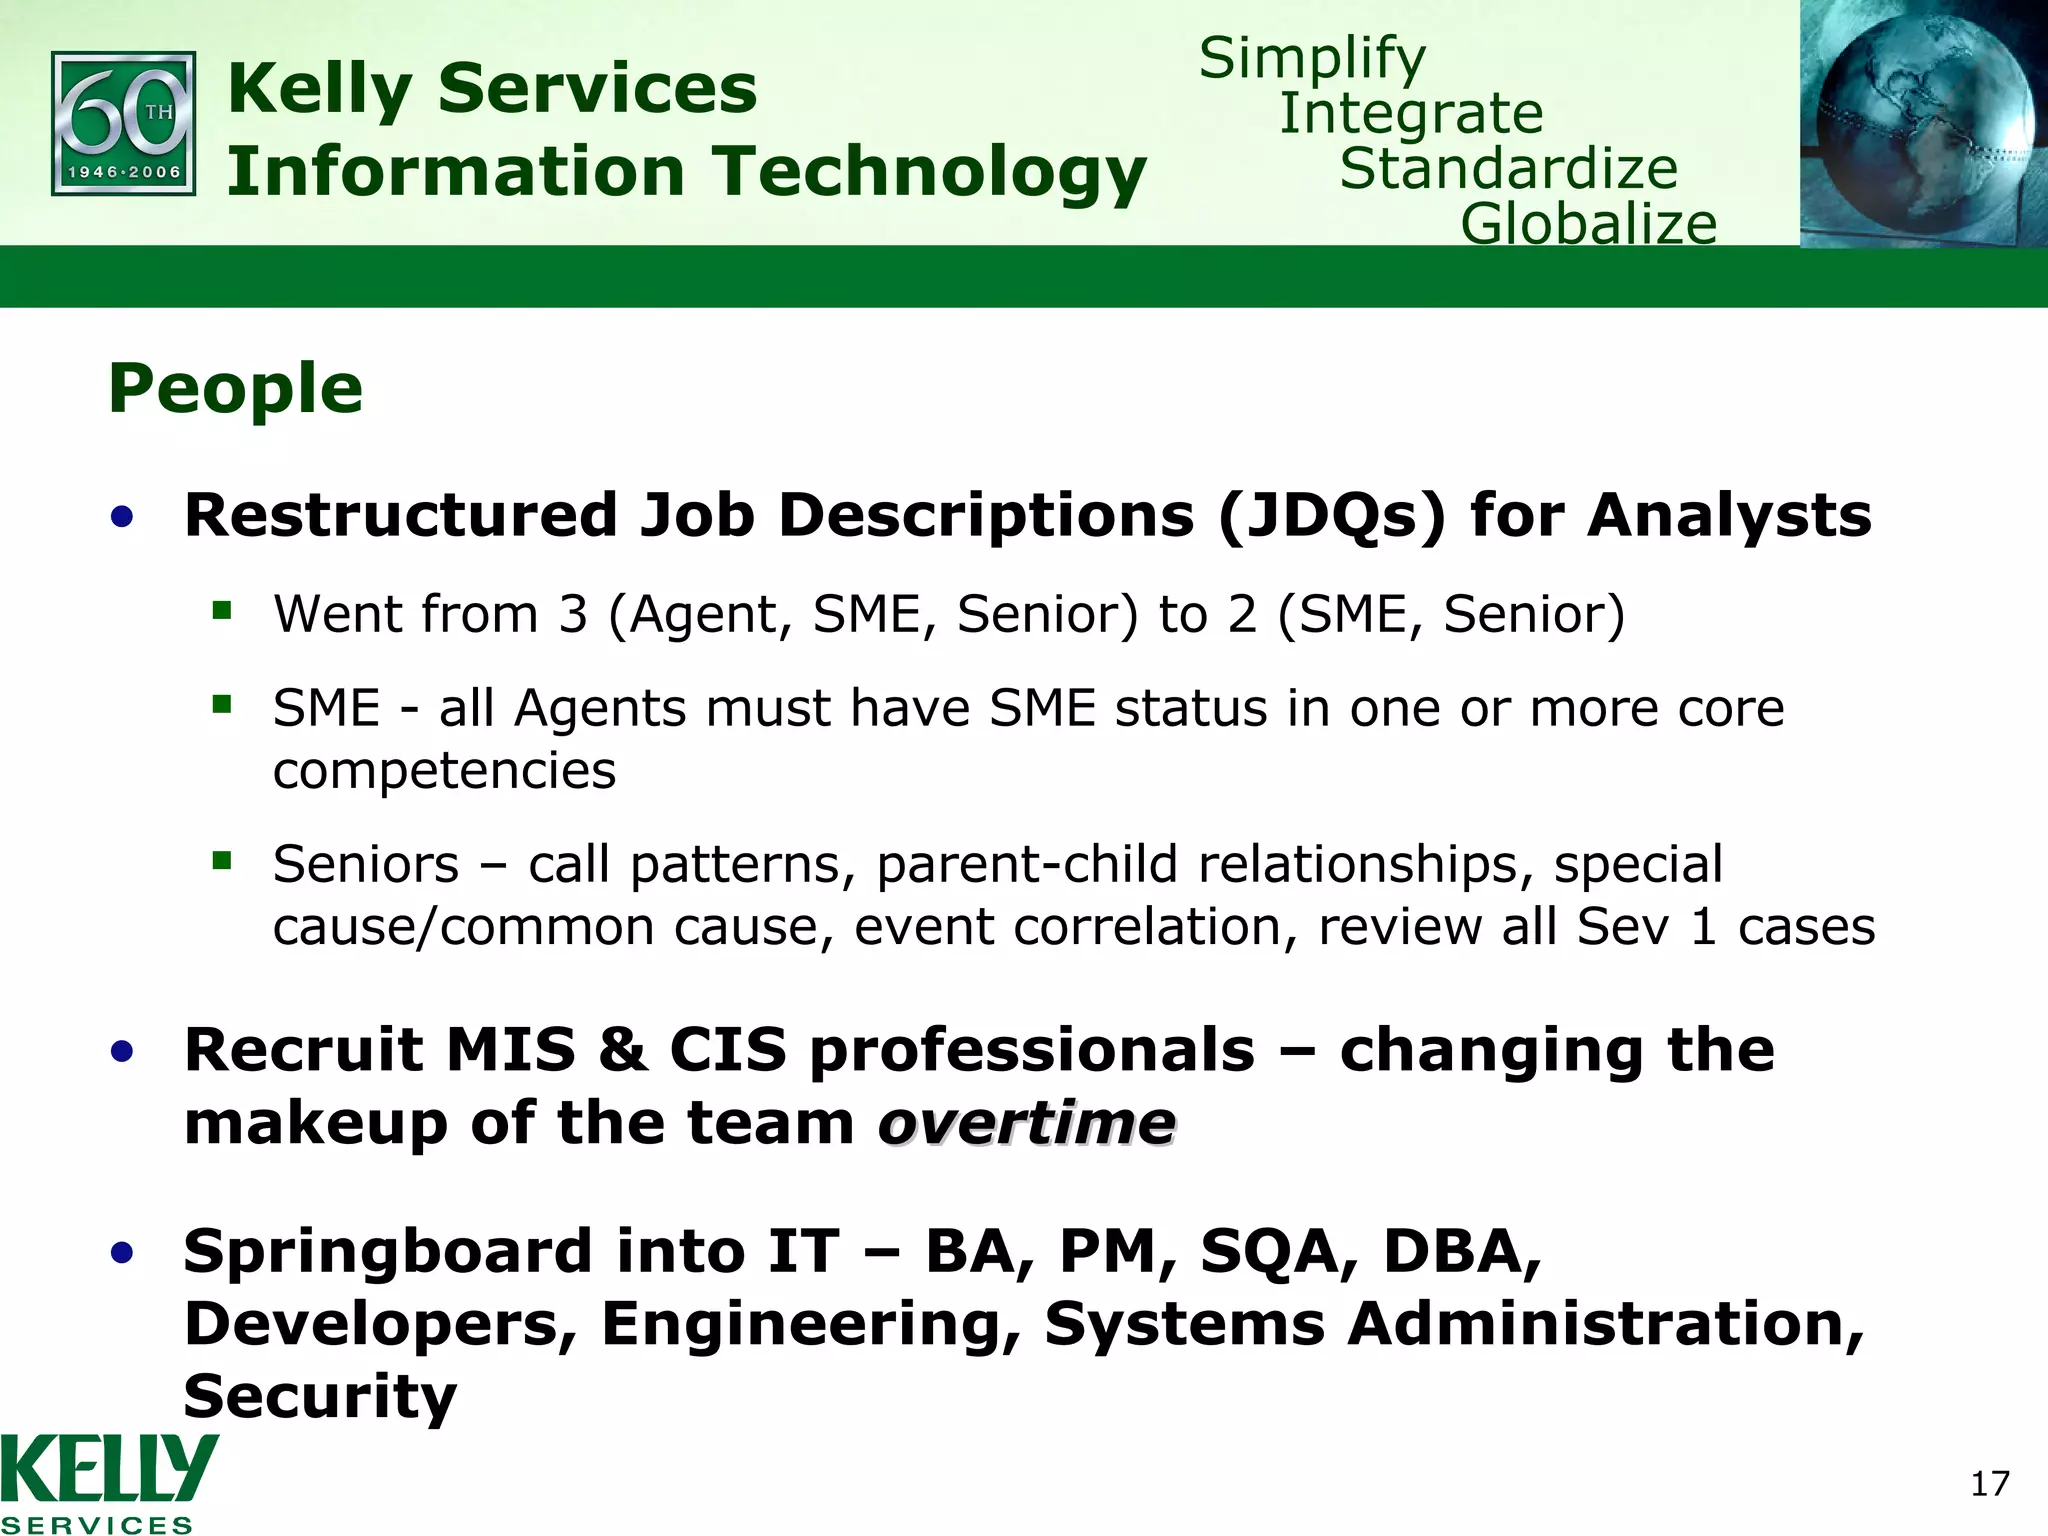
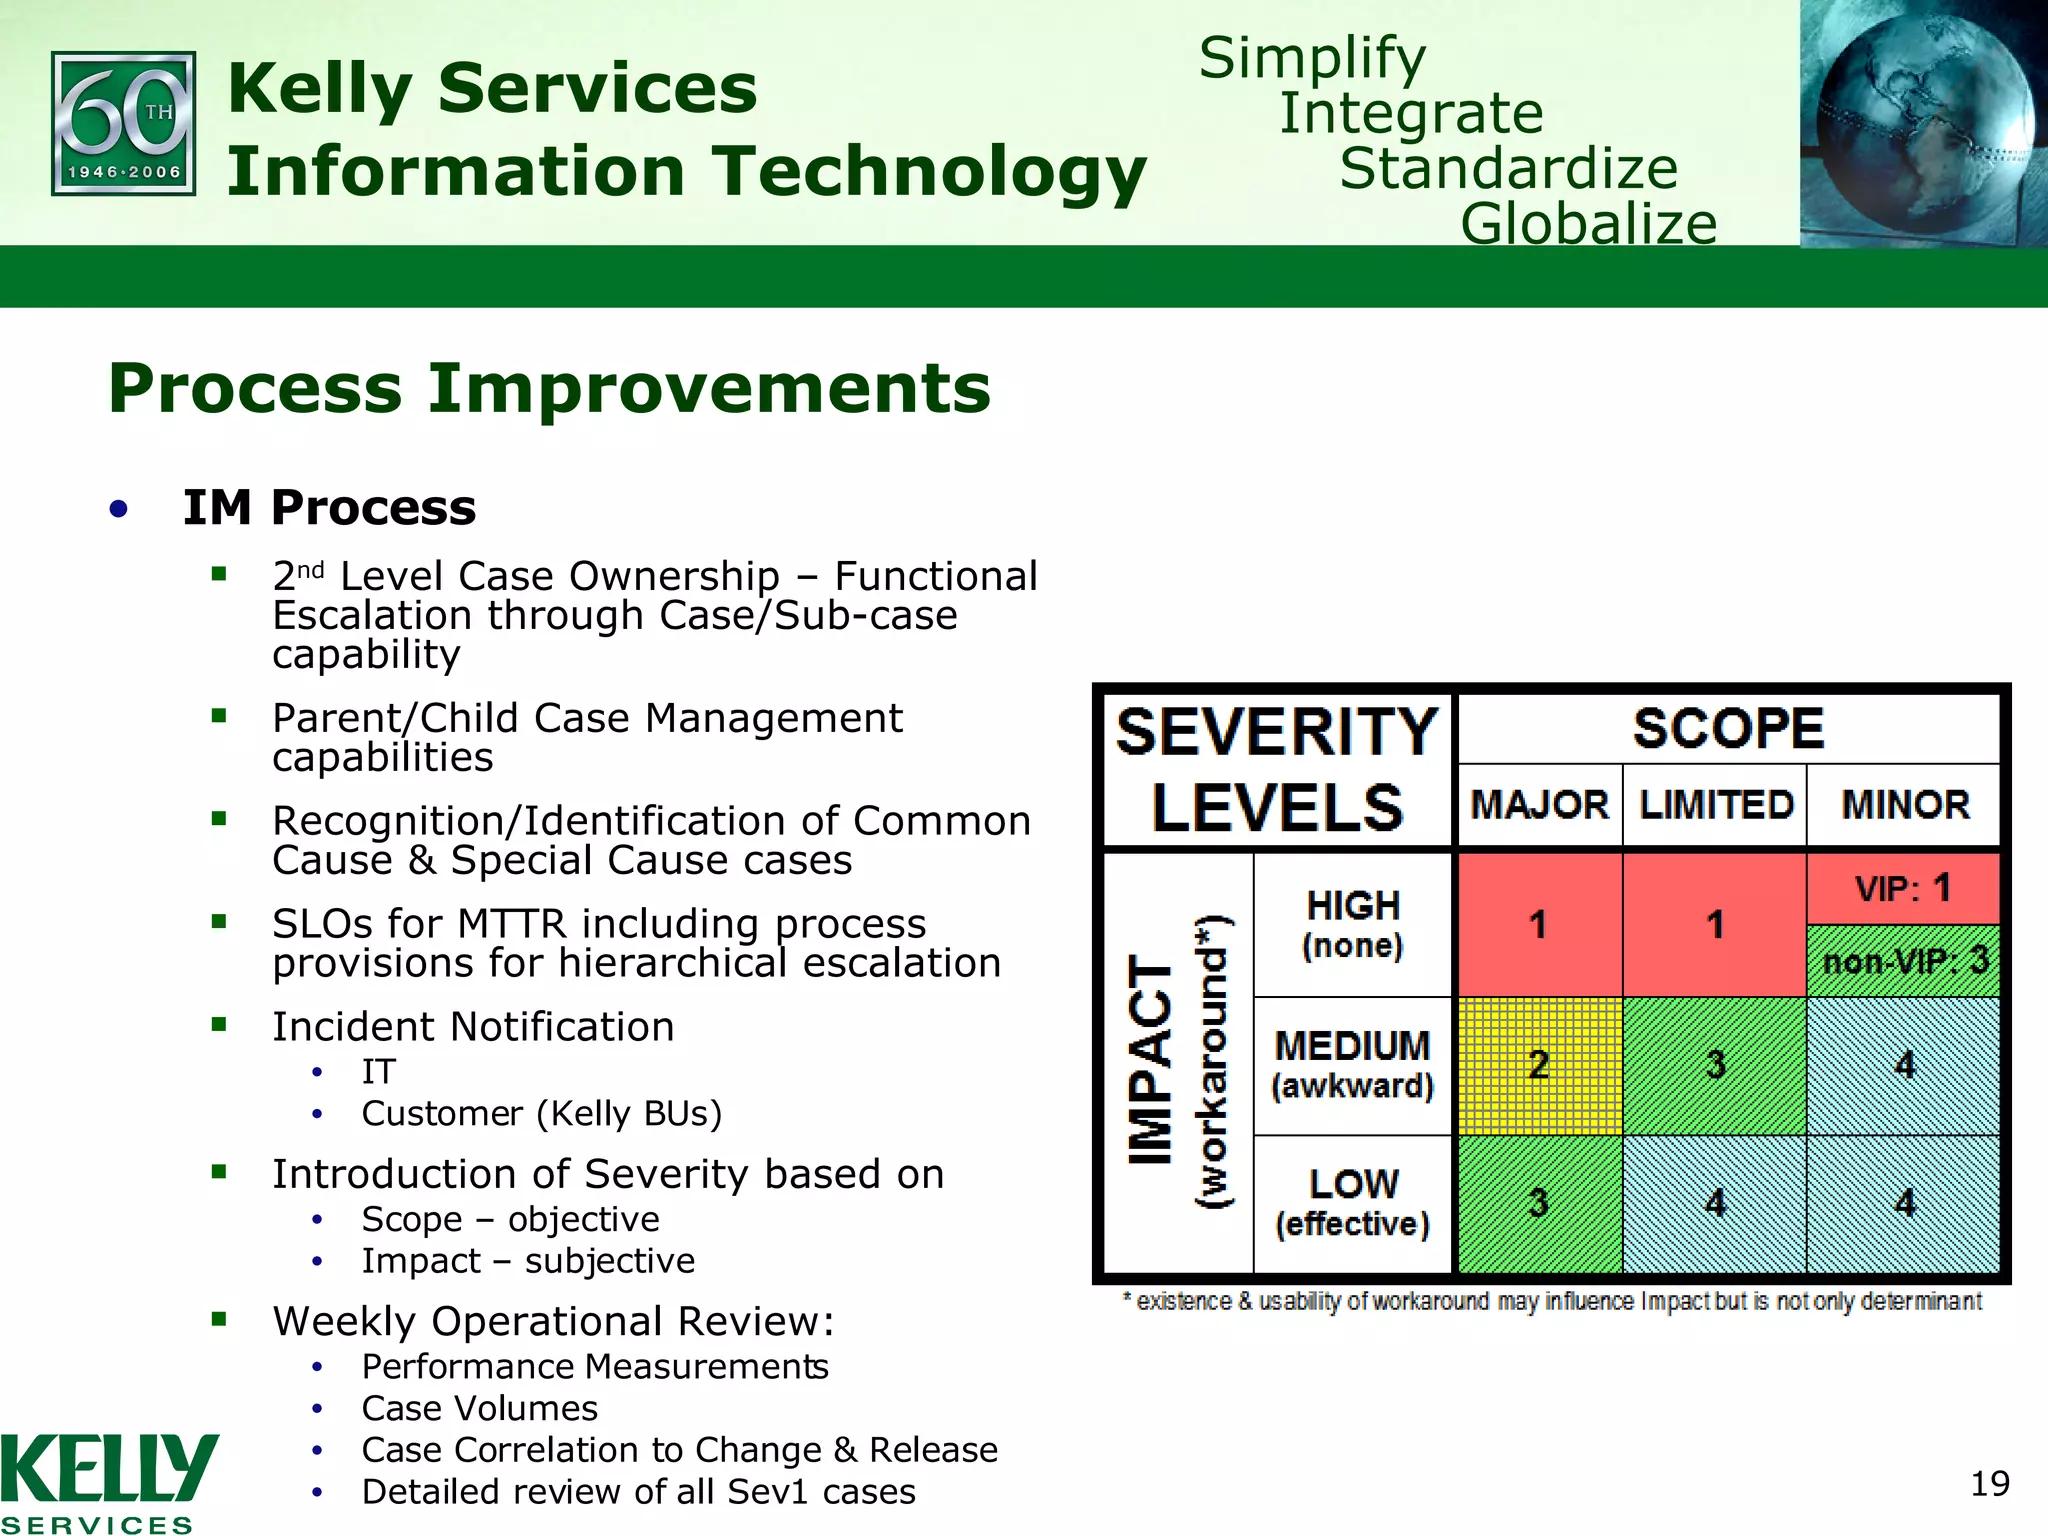
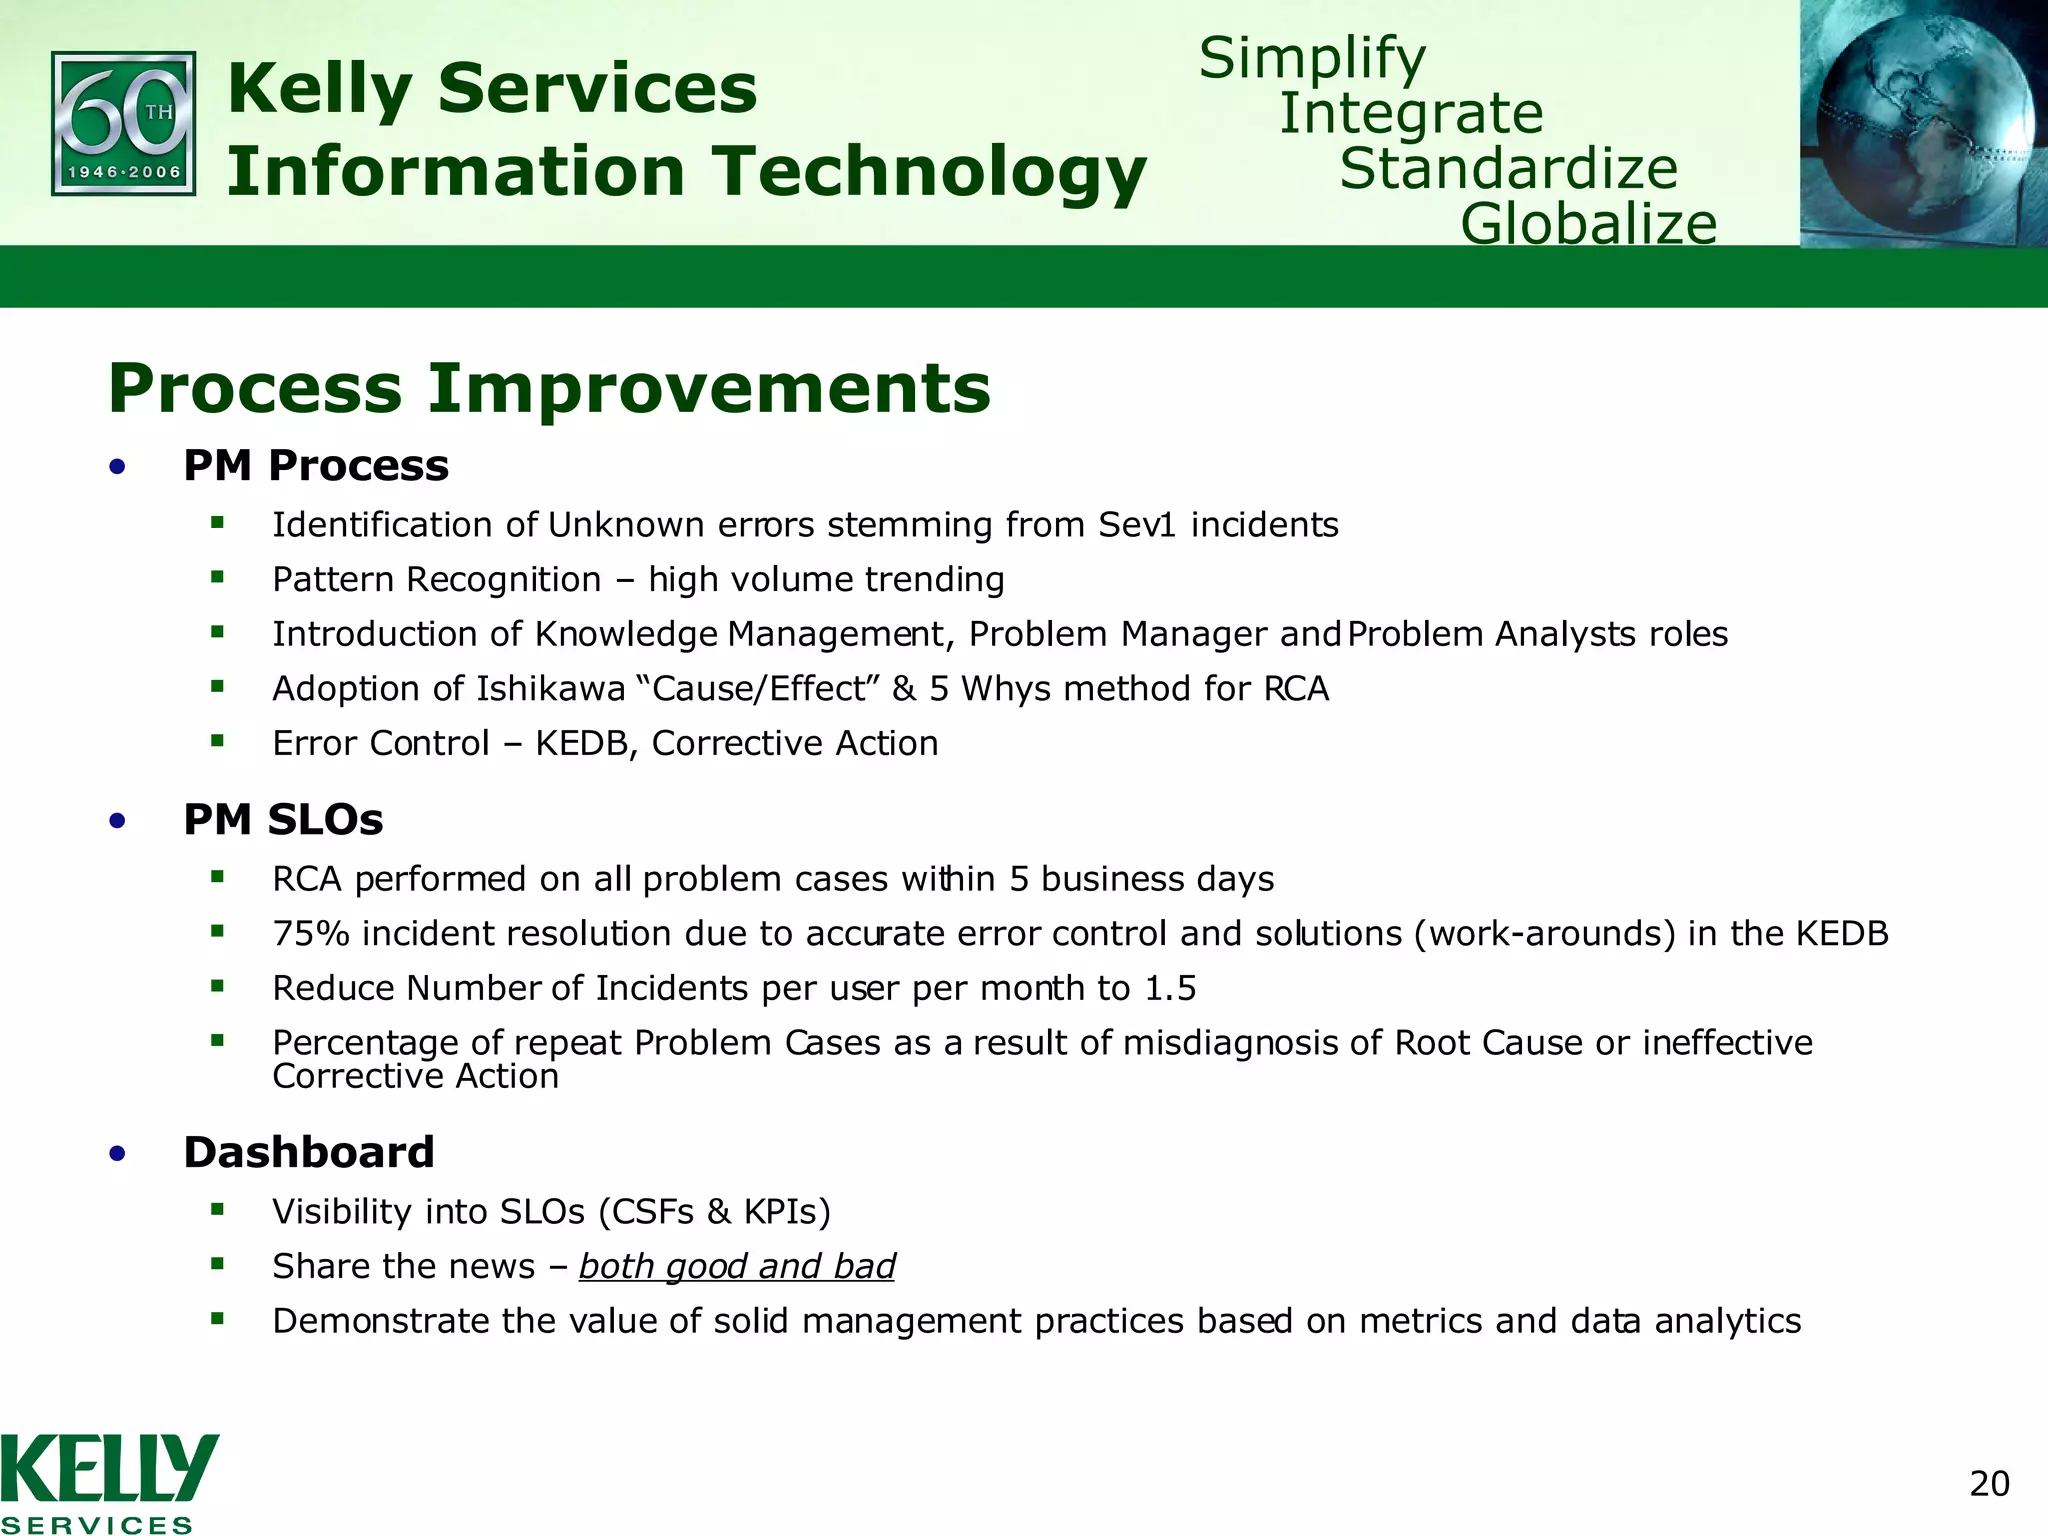
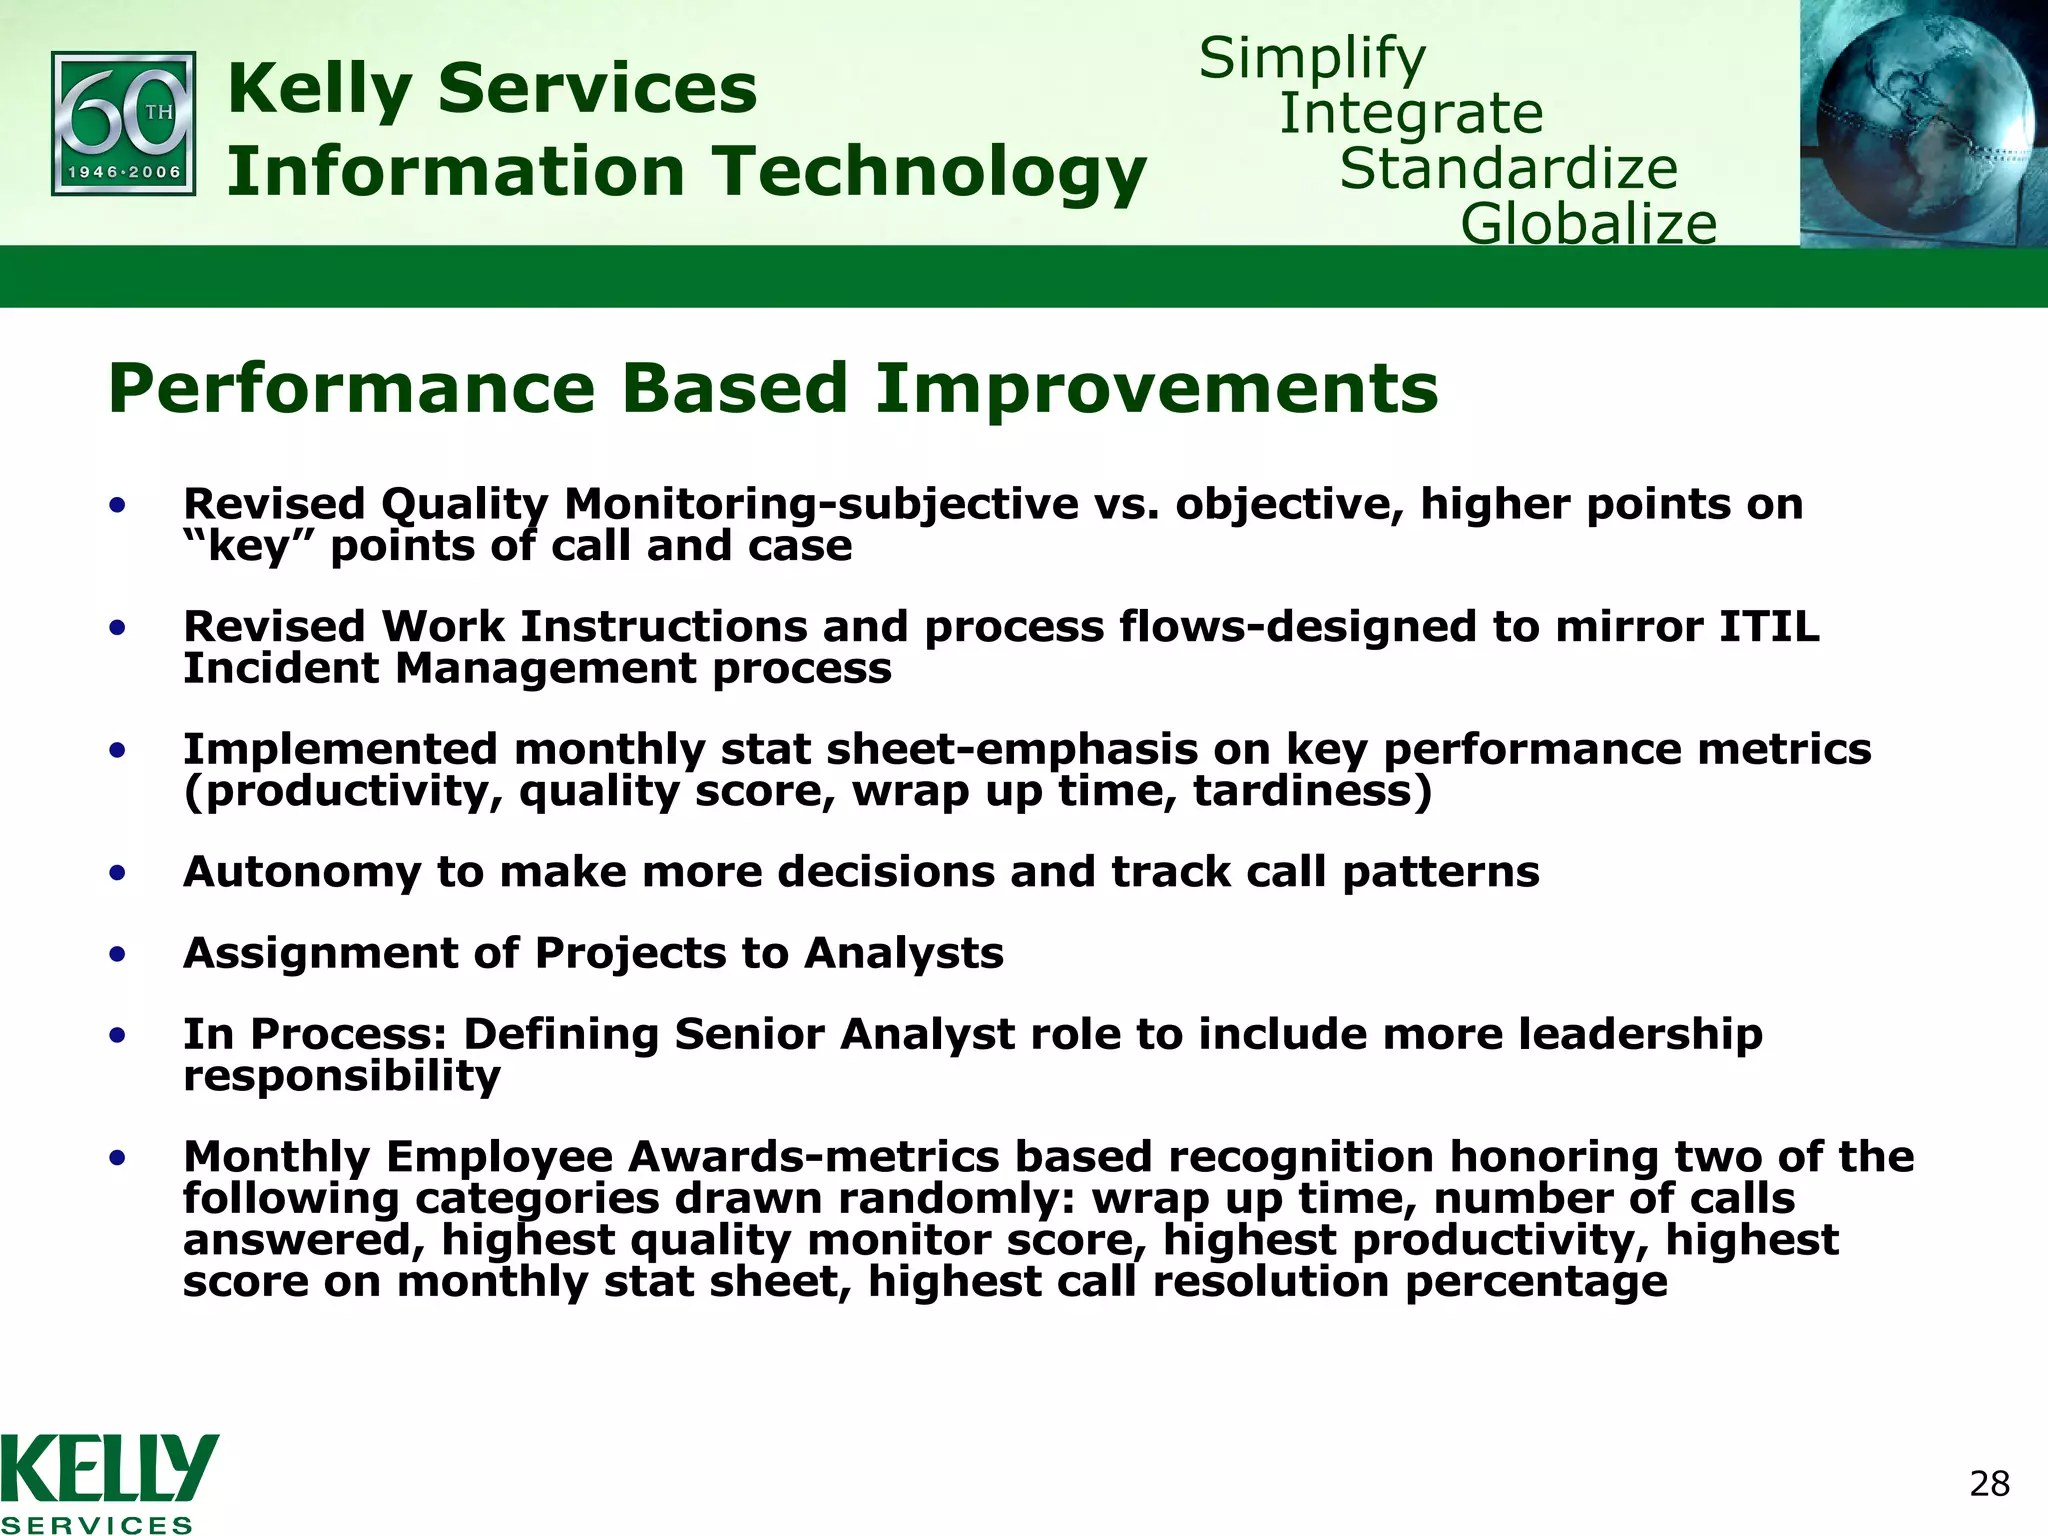
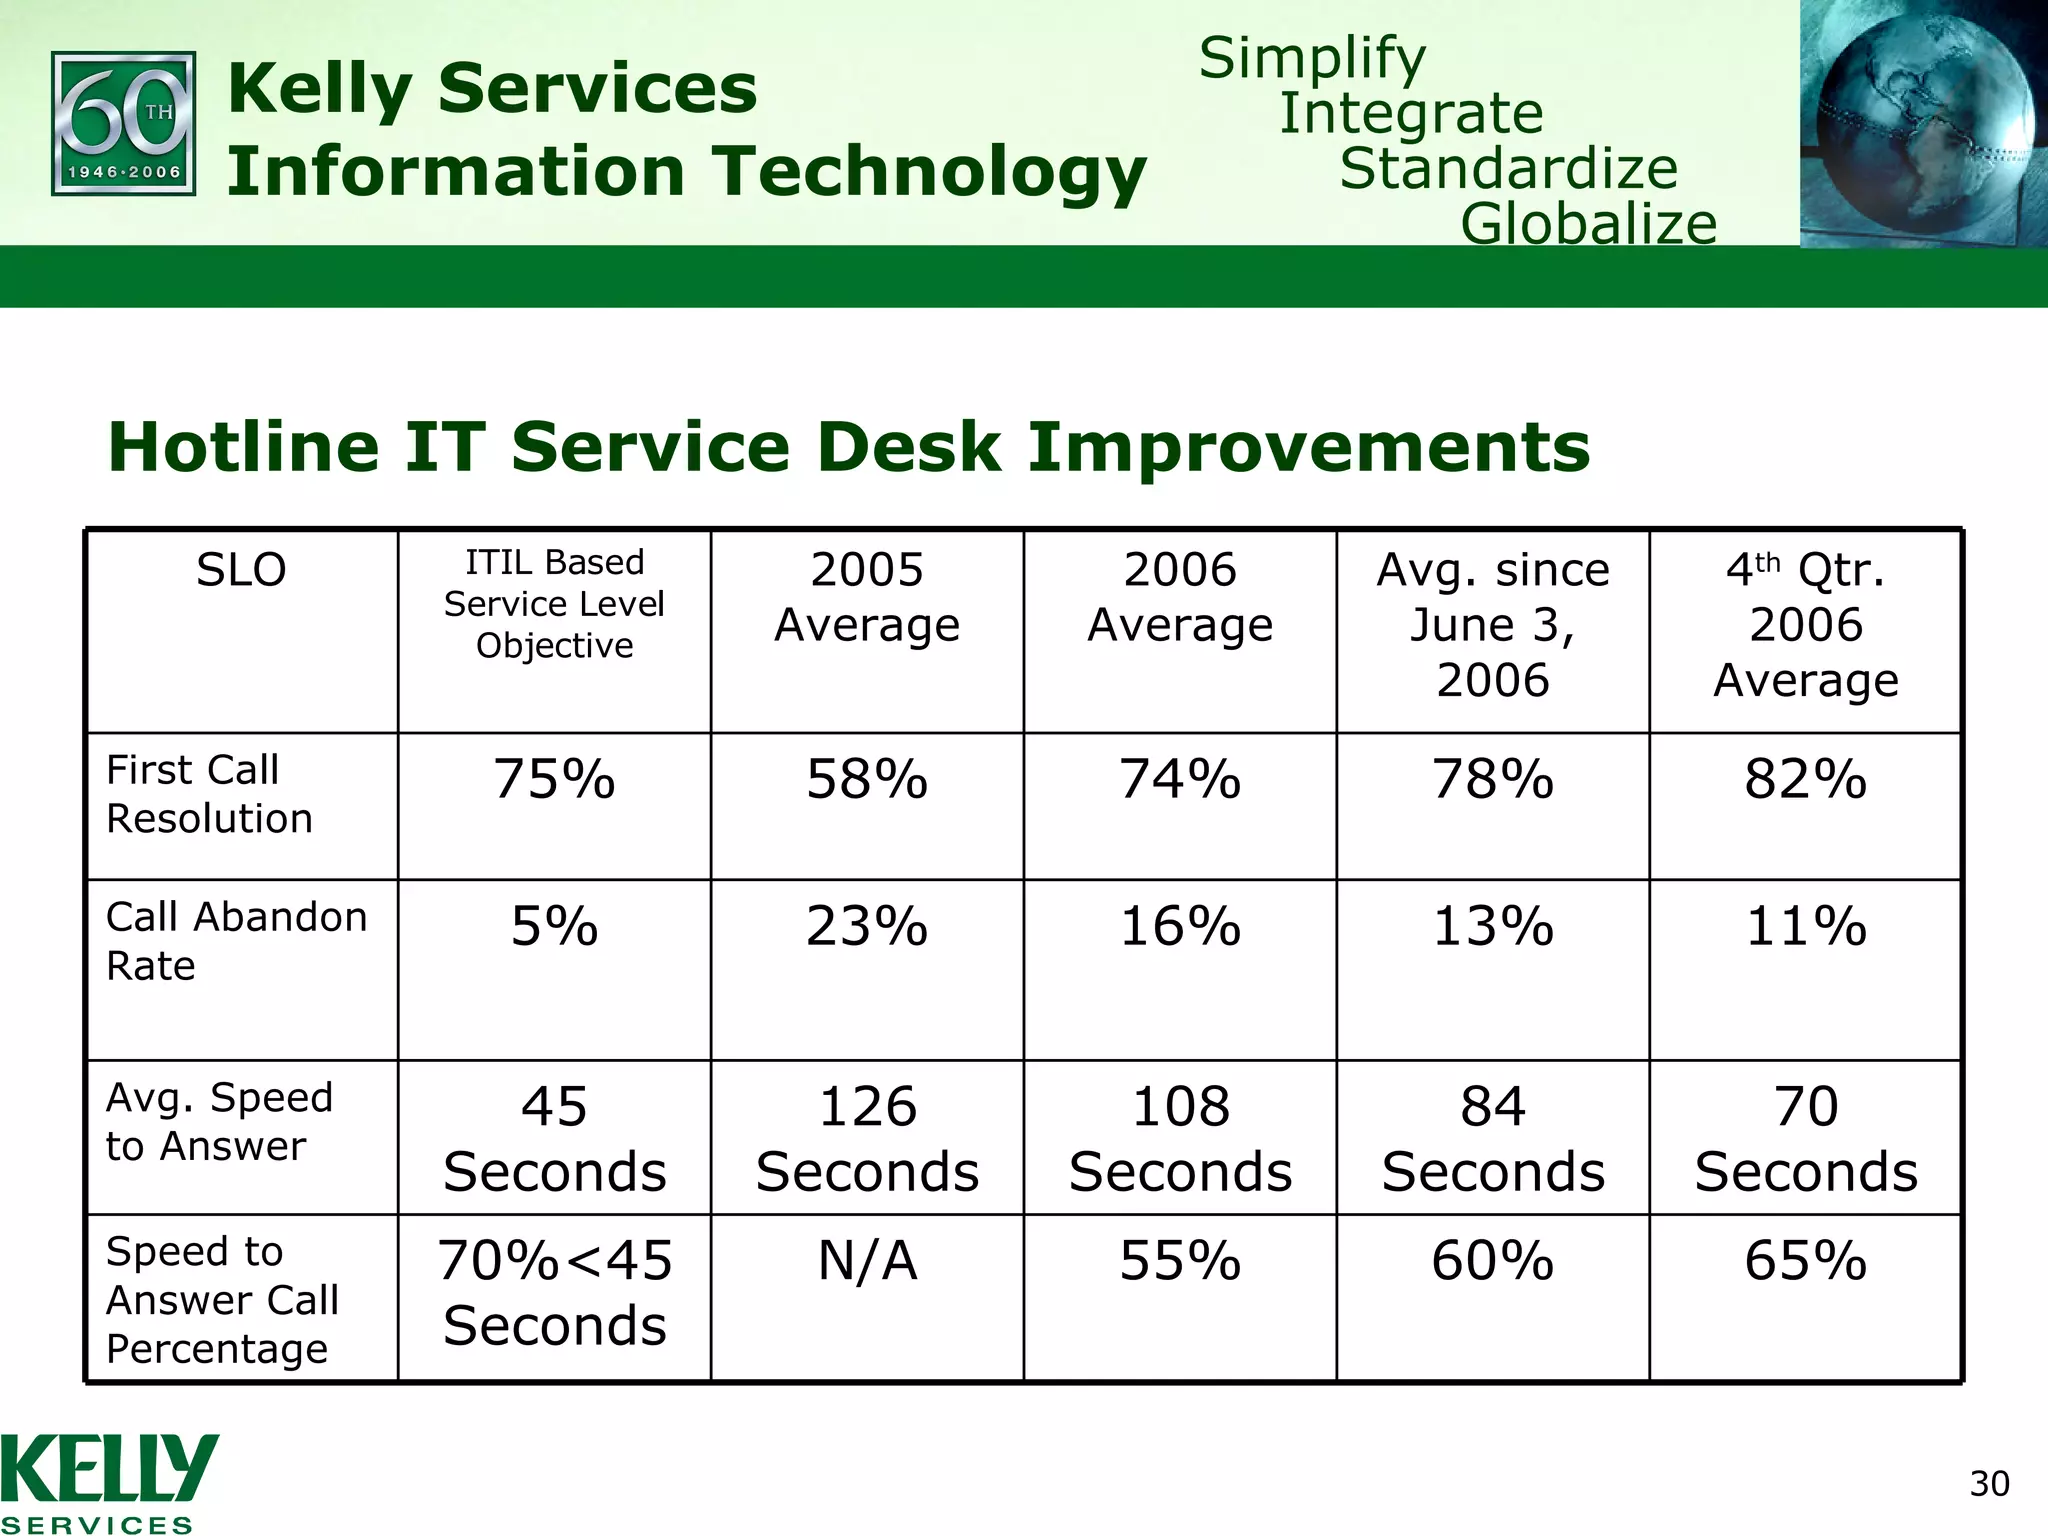
Welcomes Kelly Services, Inc.
HDI Motown Chapter Meeting Thursday, February 8 th , 2007
Agenda 1:00 – 1:15 Gathering & Introduction – Dan Wilson 1:15 – 2:30 Presentation 2:30 – 2:50 Break & Networking - All 2:50 – 3:10 Presentation 3:10 – 3:30 Q&A “Open Discussion” - All 3:30 – 4:00 HDI news & Wrap-up - Dan Wilson Setting the Stage for a successful ITIL implementation program “The Transformation of an IT Service Desk”
Kelly Services Overview Kelly Services, Inc. (NASDAQ: KELYA, KELYB) Fortune 500 company (ranked 389), HQ in Troy, MI 8000 FTE Corporate & Field personnel Provide employment to 700,000 employees annually 2006 Revenue, released on 1/25/07, $5.6B (up 6.7%) 2006 Earnings $63.5MM (62% growth over 05’) 2005 Revenue up 6.1%, Earnings up 85% 30 Countries New Global Model - 3 Regions (Americas, EMEA, APAC) Corporate offices in Troy (HQ), UK, Sidney & Singapore Data Center & Help Desk in all 3 regions (4 locations) 3 Divisions – Commercial, PTSA, Staffing Alternatives
Kelly Services History William Russell Kelly – Founded in Detroit October 7, 1946 Became Kelly Girl Services in 1957 Public – January 9, 1962 International 1968, expanded to Europe in 1972 Fortune 500 since 1985 Clients – 92% of Fortune 500 & 96% of Fortune 100 Ranked 5 th  largest in Staffing Services sector Opened the “Hotline” in 1976 –  First in Industry for Temp Staff Originally intended to provide support to the Kelly Temps who were placed on assignment at our clients “How To” questions. Allison Everett – Current CIO, appointed 2003
Information Technology Perception of Kelly Internal IT: Processes lacked maturity Inefficient, not optimized, antiquated, lacked accountability (RASIC) Conflicting roles & priorities – projects vs. production Inappropriate use of Metrics & Reporting Success based on Heroics (not process maturity) IT not viewed as a business enabler or services partner, but as an underling cost or expense Who are our Customers?  - conflict between Clients, Business Customers and User expectations Unresponsive – missed business opportunities Need to be more Proactive – lacked IT stewardship – help to solve business challenges through the appropriate use of IT Resistant to change – in both process & technology Lacked perspective on best practices – how to improve?
ITSM Goals for Kelly? To align IT Services and Capabilities with the current and future needs of the business  To improve the quality of IT service delivered Can we realize cost savings associated with IT service provisioning & support channel expense to new projects & service initiatives IT Service Management –  foundation  for ITIL “ Management of IT Services to meet the requirements and expectations of the customer, where services are defined as a set of related and configurable IT components that are assembled in a solution to support one or more business processes.  They exists solely to support the business and it’s efficient and effective operation.”
Where to Start? Current Situation Analysis Consult with experienced professionals Pink Elephant – accelerate knowledge & understanding of ITIL INS – Process Maturity Assessment Unisys – Master Certified ITIL, Six Sigma Black belts ITIL Process Maturity Assessment Based on assessment look for Low-Hanging fruit What areas are the easiest & quickest ( obvious ) to address What areas are most troublesome What areas are most visible Obtain Quick-wins Avoid taking on too big of a task as a first step
IT Service Management Capability Maturity Model Assessment model based on the original SEI Capability Maturity Model 5 levels  (Initial, Repeatable, Defined, Managed, Optimized) Capability Maturity Model Integration (CMMI) – released 2000 5 levels  (Initial, Managed, Defined, Quantitatively Managed, Optimized) Post ITIL Implementation Assessment Kit To establish the extent to which an organization has adopted the OGC ITIL Best Practices 1 Prerequisites  Availability of Minimum Prerequisites to support process activities 1.5 Management Intent Existence of Organizational Policy, MBO, Strategy, Vision 2 Process Capability Process Capability – minimum steps defined to execute work 2.5 Internal Integration Internal IT Integration of processes to fulfill the intent of the process 3 Products Are all IT Products & Services being produced through the processes  3.5 Quality Control Review and Verification of process outputs 4 Management Information  IT Governance and Decision based on adequate and timely process information  4.5 External Integration BPM IT process integration with non-IT Business Units across the enterprise   5 Customer Interface External Review and Validation of Services and process output to ensure CSAT
ITSM Process Maturity Rosette -  example Cover text
ITSM Assessment Sample Questionnaire
ITSM Capability Maturity Model & Six Sigma Integration Disciplined Approach Standard & Consistent Predictable ITIL Framework will only allow you to achieve IT CMM Level 3 Process Management Technique (e.g. Six Sigma) is needed to obtain Process Optimization Continuously Improving Process & Service Quality Variation High Low Initial  Unpredictable & Poorly Controlled Repeatable   Can repeat previously mastered tasks Defined   Processes   characterized, fairly well understood Managed   Process measured & controlled Optimized   Focus on process improvement
Where did Kelly begin? IT Service Desk People, Process, Technology Service Support Model Team Structure & Charter Incident Management process Staffing & Recruiting practices Knowledge Management Critical Success Factors (CSFs) & Key Performance Indicators (KPIs) Metrics & Reporting – BPM & Dashboard Problem Management Problem Management RCA & Corrective Action
IT Governance Vision Mission Objectives Policies Principles Business Plan Industry Standards & Best Practices Methodologies PM PMI/PMP (PMBOK) SDLC Waterfall RAD/RUP Six Sigma IT Service Management Dimensions Regulatory Compliance Sarbanes-Oxley CISP HIPAA SSNPA ITPA People Process (BPM) Technology Organizational Model COBIT ITIL Deming TQM/KQMS
Why did we start there? “ Hotline” Help Desk - 30 years of evolution C3, Help Desk, IT Service Desk Extensive shuffling within Kelly for the Hotline Cross Functional Help Desk model Universal Agents - all agents, all calls, all the time “ Jack of all trades, Master of none” 9 Severity Levels - lost its effect Ineffective Functional & Hierarchical Escalation No Quality Assurance or Data Integrity checks on KEDB (KM) Integrated Incident/Problem management process including notification with RCA on all “urgent” issues regardless of error status. Poor service performance – metrics that were below industry norms
The Transformation of an IT Service Desk! No sacred cows – “we changed everything” – significant paradigm shift Are we an IT Service Desk or C3? – Charter “SPOC for the support of our IT Services & Solutions” Negotiated  Service Level Objectives with Senior BU Leaders FCR > 75% ASA < 45 seconds Call Answer Percentage – “70% calls < 45 seconds”  CAR < 5% MTTR – Sev1 (1 hr), Sev2 (4 hrs), Sev3 (24 hours), Sev4 (72 hrs) RFS/MAC (5 Business Days) – (24 hours???) Transition to a split-functional Service Desk model Established 5 core competencies: DCE, COTS, Enterprise “ECOTS” (Oracle, PeopleSoft, Notes), Kelly Proprietary Apps, ASP Established 2 teams Technical & Business Technical – DCE & COTS Business – ECOTS, Kelly Proprietary Business Apps, ASP Services
People Restructured Job Descriptions (JDQs) for Analysts Went from 3 (Agent, SME, Senior) to 2 (SME, Senior) SME - all Agents must have SME status in one or more core competencies Seniors – call patterns, parent-child relationships, special cause/common cause, event correlation, review all Sev 1 cases Recruit MIS & CIS professionals – changing the makeup of the team  overtime Springboard into IT – BA, PM, SQA, DBA, Developers, Engineering, Systems Administration, Security
Shift Responsibility Transition application & institutional knowledge to Level 1 Transfer all Password resets to Level 1 Transition Remote Desktop Support responsibilities to Level 1 Place Hotline Analysts on TDY assignments and projects  Employee & Team Recognition Highest Call Volume Highest Number of Resolved Incidents Highest FCR % Established Recognition & Suggestions email address Healthy “Fun” Team Competition People
Process Improvements IM Process 2 nd  Level Case Ownership – Functional Escalation through Case/Sub-case capability Parent/Child Case Management capabilities Recognition/Identification of Common Cause & Special Cause cases SLOs for MTTR including process provisions for hierarchical escalation Incident Notification IT Customer (Kelly BUs) Introduction of Severity based on Scope – objective Impact – subjective Weekly Operational Review: Performance Measurements Case Volumes Case Correlation to Change & Release Detailed review of all Sev1 cases
Process Improvements PM Process Identification of Unknown errors stemming from Sev1 incidents Pattern Recognition – high volume trending Introduction of Knowledge Management, Problem Manager and Problem Analysts roles Adoption of Ishikawa “Cause/Effect” & 5 Whys method for RCA Error Control – KEDB, Corrective Action PM SLOs RCA performed on all problem cases within 5 business days 75% incident resolution due to accurate error control and solutions (work-arounds) in the KEDB Reduce Number of Incidents per user per month to 1.5 Percentage of repeat Problem Cases as a result of misdiagnosis of Root Cause or ineffective Corrective Action Dashboard Visibility into SLOs (CSFs & KPIs) Share the news –  both good and bad Demonstrate the value of solid management practices based on metrics and data analytics
Technology Restructure ACD Revised menu options Introduced more options – 9 specific to our services with highest call volume at the beginning Introduced more call numbers – Based on user constituencies & clients Restructured agent prioritization and overflow handling Modify Clarify CHD to allow Case/Sub-Case, Parent Child, Auto User Notification CSI & User Survey integration Enable use of Remote Assistance & Remote Desktop Severity 1 broadcast messaging on Kelly Intranet – “Kellyweb” Roadmap for Service Desk Tools Architecture Auto Quality Assurance Monitoring Resource Management CTI – Desktop Management, Asset Management & User Profile Integration
Kelly IT Resources business unit established in 1999 2005 total revenue of $280 million  Current workforce consists of more than 8000 IT professionals Over 40 dedicated Kelly IT Resources branches domestically  International operations (Canada, France, Netherlands, Russia and Singapore) Contract Staffing (contract, contract to direct, direct hire) Group Staffing and Human Capital Management Master Vendor or Managed Service Provider Project Solutions Help Desk (IT technical call centers) Technology Deployments Staff Augmentation (Support, Development) Project Management Kelly IT Resources – “KITR” Business Unit  Joseph M. Licavoli Sales Manager (248) 404-9567
US  Branch Locations West Region   Central Region   Southeast Region   Northeast Region
KITR – IT Classification Breakdown 2005 KITR Employees
KITR Resources Industry Segmentation 2005 Industry Segmentation
Break & Network 2:30 – 2:50
Hotline Statistics- U.S. Based Operations Monday-Friday, 5:30 AM to 8:30 PM 15 Technical Team Analysts 15 Business Team Analysts 2 Supervisors 35,000 of users 150 Applications User Constituencies: Full Time Branch, Kelly Temps, Clients, Vendors, Corporate Customers  Call Volume-2006 Average 3881/week Case Volume-2006 Average 3440/week Email Volume-2006 Average 319/week
Performance Based Improvements Revised Quality Monitoring-subjective vs. objective, higher points on “key” points of call and case Revised Work Instructions and process flows-designed to mirror ITIL Incident Management process Implemented monthly stat sheet-emphasis on key performance metrics (productivity, quality score, wrap up time, tardiness) Autonomy to make more decisions and track call patterns Assignment of Projects to Analysts In Process: Defining Senior Analyst role to include more leadership responsibility Monthly Employee Awards-metrics based recognition honoring two of the following categories drawn randomly: wrap up time, number of calls answered, highest quality monitor score, highest productivity, highest score on monthly stat sheet, highest call resolution percentage
Additional Changes Changed phone scripting and prompts  Repaired SYMON display boards Repaired SYMON Desktop displays Developed process and “mindset” to answer inbound calls first and foremost Charged Seniors with queue monitoring  Technical Team created “quads” Strengthen core competencies in individuals-Notes SME, RA/RD SME
Hotline IT Service Desk Improvements 65% 60% 55% N/A 70%<45 Seconds Speed to Answer Call Percentage 70 Seconds 84 Seconds 108 Seconds 126 Seconds 45 Seconds Avg. Speed to Answer 11% 13% 16% 23% 5% Call Abandon Rate 82% 78% 74% 58% 75% First Call Resolution 4 th  Qtr. 2006 Average Avg. since June 3, 2006 2006 Average 2005 Average ITIL Based Service Level Objective SLO
IT Infrastructure Operations & Services ITIL Service Support Dashboard For Week Ending 2/3/2007
Plans for 2007 Change Management Module expanding the role of the CAB Enforce compliance to the CM process, process rigor Service Level Management SLA template based on Performance, Availability, Quality & Security -  complete OLA templates for inter-functional departmental services Availability Management Business Service Management – complete tools architecture End User Experience (EUE) – Application Performance Monitoring Synthetic Transaction Monitoring Passive Monitoring and Performance Baselining using “real” network traffic External monitoring of our ASP and Managed Hosting Vendors Enterprise Operations Command Center Virtual centralization of “support” functions Separation of Duties Audit Compliance Dashboard monitoring of IT Services & Solutions Proactive “trend-based” alerting
Questions & Answers
HDI News & Wrap-up Dan Wilson
Thank You! for inviting to host the February HDI Meeting  Kelly Services, Inc. “Kelly Talent”

Feb2007 Kelly Services Hdi Chapter Meeting 020807 Public Domain

  • 1.
  • 2.
    HDI Motown ChapterMeeting Thursday, February 8 th , 2007
  • 3.
    Agenda 1:00 –1:15 Gathering & Introduction – Dan Wilson 1:15 – 2:30 Presentation 2:30 – 2:50 Break & Networking - All 2:50 – 3:10 Presentation 3:10 – 3:30 Q&A “Open Discussion” - All 3:30 – 4:00 HDI news & Wrap-up - Dan Wilson Setting the Stage for a successful ITIL implementation program “The Transformation of an IT Service Desk”
  • 4.
    Kelly Services OverviewKelly Services, Inc. (NASDAQ: KELYA, KELYB) Fortune 500 company (ranked 389), HQ in Troy, MI 8000 FTE Corporate & Field personnel Provide employment to 700,000 employees annually 2006 Revenue, released on 1/25/07, $5.6B (up 6.7%) 2006 Earnings $63.5MM (62% growth over 05’) 2005 Revenue up 6.1%, Earnings up 85% 30 Countries New Global Model - 3 Regions (Americas, EMEA, APAC) Corporate offices in Troy (HQ), UK, Sidney & Singapore Data Center & Help Desk in all 3 regions (4 locations) 3 Divisions – Commercial, PTSA, Staffing Alternatives
  • 5.
    Kelly Services HistoryWilliam Russell Kelly – Founded in Detroit October 7, 1946 Became Kelly Girl Services in 1957 Public – January 9, 1962 International 1968, expanded to Europe in 1972 Fortune 500 since 1985 Clients – 92% of Fortune 500 & 96% of Fortune 100 Ranked 5 th largest in Staffing Services sector Opened the “Hotline” in 1976 – First in Industry for Temp Staff Originally intended to provide support to the Kelly Temps who were placed on assignment at our clients “How To” questions. Allison Everett – Current CIO, appointed 2003
  • 6.
    Information Technology Perceptionof Kelly Internal IT: Processes lacked maturity Inefficient, not optimized, antiquated, lacked accountability (RASIC) Conflicting roles & priorities – projects vs. production Inappropriate use of Metrics & Reporting Success based on Heroics (not process maturity) IT not viewed as a business enabler or services partner, but as an underling cost or expense Who are our Customers? - conflict between Clients, Business Customers and User expectations Unresponsive – missed business opportunities Need to be more Proactive – lacked IT stewardship – help to solve business challenges through the appropriate use of IT Resistant to change – in both process & technology Lacked perspective on best practices – how to improve?
  • 7.
    ITSM Goals forKelly? To align IT Services and Capabilities with the current and future needs of the business To improve the quality of IT service delivered Can we realize cost savings associated with IT service provisioning & support channel expense to new projects & service initiatives IT Service Management – foundation for ITIL “ Management of IT Services to meet the requirements and expectations of the customer, where services are defined as a set of related and configurable IT components that are assembled in a solution to support one or more business processes. They exists solely to support the business and it’s efficient and effective operation.”
  • 8.
    Where to Start?Current Situation Analysis Consult with experienced professionals Pink Elephant – accelerate knowledge & understanding of ITIL INS – Process Maturity Assessment Unisys – Master Certified ITIL, Six Sigma Black belts ITIL Process Maturity Assessment Based on assessment look for Low-Hanging fruit What areas are the easiest & quickest ( obvious ) to address What areas are most troublesome What areas are most visible Obtain Quick-wins Avoid taking on too big of a task as a first step
  • 9.
    IT Service ManagementCapability Maturity Model Assessment model based on the original SEI Capability Maturity Model 5 levels (Initial, Repeatable, Defined, Managed, Optimized) Capability Maturity Model Integration (CMMI) – released 2000 5 levels (Initial, Managed, Defined, Quantitatively Managed, Optimized) Post ITIL Implementation Assessment Kit To establish the extent to which an organization has adopted the OGC ITIL Best Practices 1 Prerequisites Availability of Minimum Prerequisites to support process activities 1.5 Management Intent Existence of Organizational Policy, MBO, Strategy, Vision 2 Process Capability Process Capability – minimum steps defined to execute work 2.5 Internal Integration Internal IT Integration of processes to fulfill the intent of the process 3 Products Are all IT Products & Services being produced through the processes 3.5 Quality Control Review and Verification of process outputs 4 Management Information IT Governance and Decision based on adequate and timely process information 4.5 External Integration BPM IT process integration with non-IT Business Units across the enterprise 5 Customer Interface External Review and Validation of Services and process output to ensure CSAT
  • 10.
    ITSM Process MaturityRosette - example Cover text
  • 11.
  • 12.
    ITSM Capability MaturityModel & Six Sigma Integration Disciplined Approach Standard & Consistent Predictable ITIL Framework will only allow you to achieve IT CMM Level 3 Process Management Technique (e.g. Six Sigma) is needed to obtain Process Optimization Continuously Improving Process & Service Quality Variation High Low Initial Unpredictable & Poorly Controlled Repeatable Can repeat previously mastered tasks Defined Processes characterized, fairly well understood Managed Process measured & controlled Optimized Focus on process improvement
  • 13.
    Where did Kellybegin? IT Service Desk People, Process, Technology Service Support Model Team Structure & Charter Incident Management process Staffing & Recruiting practices Knowledge Management Critical Success Factors (CSFs) & Key Performance Indicators (KPIs) Metrics & Reporting – BPM & Dashboard Problem Management Problem Management RCA & Corrective Action
  • 14.
    IT Governance VisionMission Objectives Policies Principles Business Plan Industry Standards & Best Practices Methodologies PM PMI/PMP (PMBOK) SDLC Waterfall RAD/RUP Six Sigma IT Service Management Dimensions Regulatory Compliance Sarbanes-Oxley CISP HIPAA SSNPA ITPA People Process (BPM) Technology Organizational Model COBIT ITIL Deming TQM/KQMS
  • 15.
    Why did westart there? “ Hotline” Help Desk - 30 years of evolution C3, Help Desk, IT Service Desk Extensive shuffling within Kelly for the Hotline Cross Functional Help Desk model Universal Agents - all agents, all calls, all the time “ Jack of all trades, Master of none” 9 Severity Levels - lost its effect Ineffective Functional & Hierarchical Escalation No Quality Assurance or Data Integrity checks on KEDB (KM) Integrated Incident/Problem management process including notification with RCA on all “urgent” issues regardless of error status. Poor service performance – metrics that were below industry norms
  • 16.
    The Transformation ofan IT Service Desk! No sacred cows – “we changed everything” – significant paradigm shift Are we an IT Service Desk or C3? – Charter “SPOC for the support of our IT Services & Solutions” Negotiated Service Level Objectives with Senior BU Leaders FCR > 75% ASA < 45 seconds Call Answer Percentage – “70% calls < 45 seconds” CAR < 5% MTTR – Sev1 (1 hr), Sev2 (4 hrs), Sev3 (24 hours), Sev4 (72 hrs) RFS/MAC (5 Business Days) – (24 hours???) Transition to a split-functional Service Desk model Established 5 core competencies: DCE, COTS, Enterprise “ECOTS” (Oracle, PeopleSoft, Notes), Kelly Proprietary Apps, ASP Established 2 teams Technical & Business Technical – DCE & COTS Business – ECOTS, Kelly Proprietary Business Apps, ASP Services
  • 17.
    People Restructured JobDescriptions (JDQs) for Analysts Went from 3 (Agent, SME, Senior) to 2 (SME, Senior) SME - all Agents must have SME status in one or more core competencies Seniors – call patterns, parent-child relationships, special cause/common cause, event correlation, review all Sev 1 cases Recruit MIS & CIS professionals – changing the makeup of the team overtime Springboard into IT – BA, PM, SQA, DBA, Developers, Engineering, Systems Administration, Security
  • 18.
    Shift Responsibility Transitionapplication & institutional knowledge to Level 1 Transfer all Password resets to Level 1 Transition Remote Desktop Support responsibilities to Level 1 Place Hotline Analysts on TDY assignments and projects Employee & Team Recognition Highest Call Volume Highest Number of Resolved Incidents Highest FCR % Established Recognition & Suggestions email address Healthy “Fun” Team Competition People
  • 19.
    Process Improvements IMProcess 2 nd Level Case Ownership – Functional Escalation through Case/Sub-case capability Parent/Child Case Management capabilities Recognition/Identification of Common Cause & Special Cause cases SLOs for MTTR including process provisions for hierarchical escalation Incident Notification IT Customer (Kelly BUs) Introduction of Severity based on Scope – objective Impact – subjective Weekly Operational Review: Performance Measurements Case Volumes Case Correlation to Change & Release Detailed review of all Sev1 cases
  • 20.
    Process Improvements PMProcess Identification of Unknown errors stemming from Sev1 incidents Pattern Recognition – high volume trending Introduction of Knowledge Management, Problem Manager and Problem Analysts roles Adoption of Ishikawa “Cause/Effect” & 5 Whys method for RCA Error Control – KEDB, Corrective Action PM SLOs RCA performed on all problem cases within 5 business days 75% incident resolution due to accurate error control and solutions (work-arounds) in the KEDB Reduce Number of Incidents per user per month to 1.5 Percentage of repeat Problem Cases as a result of misdiagnosis of Root Cause or ineffective Corrective Action Dashboard Visibility into SLOs (CSFs & KPIs) Share the news – both good and bad Demonstrate the value of solid management practices based on metrics and data analytics
  • 21.
    Technology Restructure ACDRevised menu options Introduced more options – 9 specific to our services with highest call volume at the beginning Introduced more call numbers – Based on user constituencies & clients Restructured agent prioritization and overflow handling Modify Clarify CHD to allow Case/Sub-Case, Parent Child, Auto User Notification CSI & User Survey integration Enable use of Remote Assistance & Remote Desktop Severity 1 broadcast messaging on Kelly Intranet – “Kellyweb” Roadmap for Service Desk Tools Architecture Auto Quality Assurance Monitoring Resource Management CTI – Desktop Management, Asset Management & User Profile Integration
  • 22.
    Kelly IT Resourcesbusiness unit established in 1999 2005 total revenue of $280 million Current workforce consists of more than 8000 IT professionals Over 40 dedicated Kelly IT Resources branches domestically International operations (Canada, France, Netherlands, Russia and Singapore) Contract Staffing (contract, contract to direct, direct hire) Group Staffing and Human Capital Management Master Vendor or Managed Service Provider Project Solutions Help Desk (IT technical call centers) Technology Deployments Staff Augmentation (Support, Development) Project Management Kelly IT Resources – “KITR” Business Unit Joseph M. Licavoli Sales Manager (248) 404-9567
  • 23.
    US BranchLocations West Region Central Region Southeast Region Northeast Region
  • 24.
    KITR – ITClassification Breakdown 2005 KITR Employees
  • 25.
    KITR Resources IndustrySegmentation 2005 Industry Segmentation
  • 26.
    Break & Network2:30 – 2:50
  • 27.
    Hotline Statistics- U.S.Based Operations Monday-Friday, 5:30 AM to 8:30 PM 15 Technical Team Analysts 15 Business Team Analysts 2 Supervisors 35,000 of users 150 Applications User Constituencies: Full Time Branch, Kelly Temps, Clients, Vendors, Corporate Customers Call Volume-2006 Average 3881/week Case Volume-2006 Average 3440/week Email Volume-2006 Average 319/week
  • 28.
    Performance Based ImprovementsRevised Quality Monitoring-subjective vs. objective, higher points on “key” points of call and case Revised Work Instructions and process flows-designed to mirror ITIL Incident Management process Implemented monthly stat sheet-emphasis on key performance metrics (productivity, quality score, wrap up time, tardiness) Autonomy to make more decisions and track call patterns Assignment of Projects to Analysts In Process: Defining Senior Analyst role to include more leadership responsibility Monthly Employee Awards-metrics based recognition honoring two of the following categories drawn randomly: wrap up time, number of calls answered, highest quality monitor score, highest productivity, highest score on monthly stat sheet, highest call resolution percentage
  • 29.
    Additional Changes Changedphone scripting and prompts Repaired SYMON display boards Repaired SYMON Desktop displays Developed process and “mindset” to answer inbound calls first and foremost Charged Seniors with queue monitoring Technical Team created “quads” Strengthen core competencies in individuals-Notes SME, RA/RD SME
  • 30.
    Hotline IT ServiceDesk Improvements 65% 60% 55% N/A 70%<45 Seconds Speed to Answer Call Percentage 70 Seconds 84 Seconds 108 Seconds 126 Seconds 45 Seconds Avg. Speed to Answer 11% 13% 16% 23% 5% Call Abandon Rate 82% 78% 74% 58% 75% First Call Resolution 4 th Qtr. 2006 Average Avg. since June 3, 2006 2006 Average 2005 Average ITIL Based Service Level Objective SLO
  • 31.
    IT Infrastructure Operations& Services ITIL Service Support Dashboard For Week Ending 2/3/2007
  • 32.
    Plans for 2007Change Management Module expanding the role of the CAB Enforce compliance to the CM process, process rigor Service Level Management SLA template based on Performance, Availability, Quality & Security - complete OLA templates for inter-functional departmental services Availability Management Business Service Management – complete tools architecture End User Experience (EUE) – Application Performance Monitoring Synthetic Transaction Monitoring Passive Monitoring and Performance Baselining using “real” network traffic External monitoring of our ASP and Managed Hosting Vendors Enterprise Operations Command Center Virtual centralization of “support” functions Separation of Duties Audit Compliance Dashboard monitoring of IT Services & Solutions Proactive “trend-based” alerting
  • 33.
  • 34.
    HDI News &Wrap-up Dan Wilson
  • 35.
    Thank You! forinviting to host the February HDI Meeting Kelly Services, Inc. “Kelly Talent”