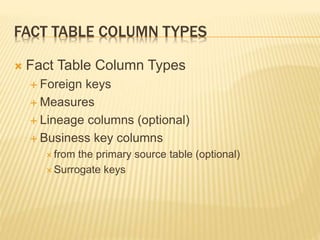
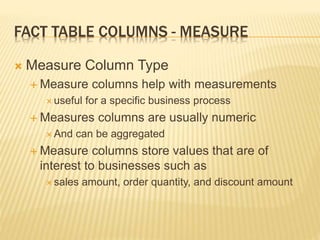
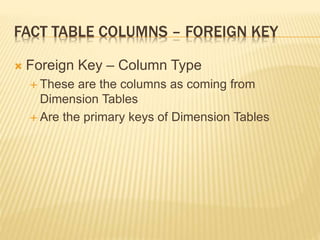
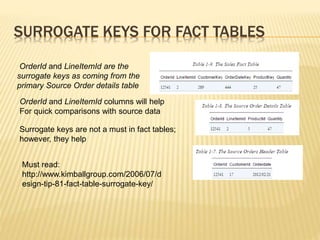
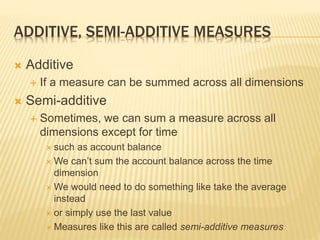
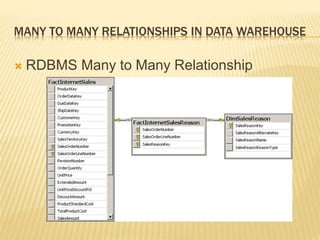
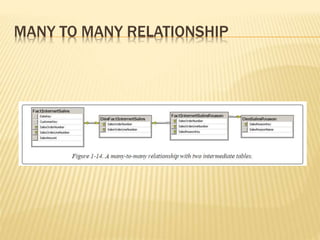
This document discusses logical design of data warehouse fact tables. It covers defining fact table column types including measures, foreign keys and surrogate keys. It describes additive, semi-additive and non-additive measures and how they impact aggregation. Finally, it discusses resolving many-to-many relationships in a star schema by creating an intermediate dimension table.
Design Principles of Excel Dashboards & ReportsWiley
Get yourself into a dashboard state of mine with these best practices for Excel dashboards and reports.
Content from Excel Dashboards & Reports For Dummies by Michael Alexander. Learn more: http://bit.ly/FDExcelDashboards
and
SalesForce.com For Dummies by Tom Wong, Liz Kao, Matt Kaufma. Learn more: http://bit.ly/ForDummiesSF
Power BI, SSAS Tabular, and Excel all use DAX. This presentation is meant to be used with a PBIX notebook found here: https://github.com/IkeEllis/democode/blob/master/IntroToDAX/Power%20BI%20Introduction%20to%20DAX.pbix
SavvyData 'Ace of Charts' in FileMaker Pro 11SavvyData
‘Ace of Charts’ is an eye-opening examination of the means and mechanisms for adding attractive, useful charts & graphs to existing FileMaker solutions. Learn to make embedded dynamic graphs that update on-demand or automatically. Create excellent FileMaker-native charts using these techniques.
Presented by Chief Data Visualist Lee Lukehart
About Lee Lukehart
Lee Lukehart is president of SavvyData, a database consulting and training firm based in the San Francisco Bay Area. Lee led the design team that created CRM portals for Microsoft, HP, and Verisign. He has presented how-tos at Macworld and several developer conferences. Lee holds a degree in Technical Communications and has authored training courses, webinars, and a white paper on advanced charting techniques. His current focus is building data visualization solutions for legacy or newly-collected data, to help users quickly interpret data to discover meaningful trends, patterns and exceptions. In his spare time he practices photography and flying small planes in the Sierras, occasionally at the same time. As for charting, it is said that on a good day he can make a trend line with only 1 data point. ;-)
An introductory session to DAX and common analytic patterns that we've built and used in enterprise environments. This session was originally presented at SQL Saturday Silicon Valley 2016.
Tableau online training and tableau desktop , tableau admin
tableau certification, tableau interview questions, tableau training institutes in hyderabad, tableau training institutes in Bangalore
This courseware will introduce you to basics in working with Excel Spreadsheets. It'll serve as a compliment to the in-lab sessions that will be held during the data journalism training session - Voter's Count - in Kumasi
9 Amazingly Simple Data Presentation TipsSketchBubble
Presenting data can be a tricky proposition, because different rules apply in different contexts. Learn the given Data Presentation tips to make the right choices for your Presentation?
LF Energy Webinar: Electrical Grid Modelling and Simulation Through PowSyBl -...DanBrown980551
Do you want to learn how to model and simulate an electrical network from scratch in under an hour?
Then welcome to this PowSyBl workshop, hosted by Rte, the French Transmission System Operator (TSO)!
During the webinar, you will discover the PowSyBl ecosystem as well as handle and study an electrical network through an interactive Python notebook.
PowSyBl is an open source project hosted by LF Energy, which offers a comprehensive set of features for electrical grid modelling and simulation. Among other advanced features, PowSyBl provides:
- A fully editable and extendable library for grid component modelling;
- Visualization tools to display your network;
- Grid simulation tools, such as power flows, security analyses (with or without remedial actions) and sensitivity analyses;
The framework is mostly written in Java, with a Python binding so that Python developers can access PowSyBl functionalities as well.
What you will learn during the webinar:
- For beginners: discover PowSyBl's functionalities through a quick general presentation and the notebook, without needing any expert coding skills;
- For advanced developers: master the skills to efficiently apply PowSyBl functionalities to your real-world scenarios.
JMeter webinar - integration with InfluxDB and GrafanaRTTS
Watch this recorded webinar about real-time monitoring of application performance. See how to integrate Apache JMeter, the open-source leader in performance testing, with InfluxDB, the open-source time-series database, and Grafana, the open-source analytics and visualization application.
In this webinar, we will review the benefits of leveraging InfluxDB and Grafana when executing load tests and demonstrate how these tools are used to visualize performance metrics.
Length: 30 minutes
Session Overview
-------------------------------------------
During this webinar, we will cover the following topics while demonstrating the integrations of JMeter, InfluxDB and Grafana:
- What out-of-the-box solutions are available for real-time monitoring JMeter tests?
- What are the benefits of integrating InfluxDB and Grafana into the load testing stack?
- Which features are provided by Grafana?
- Demonstration of InfluxDB and Grafana using a practice web application
To view the webinar recording, go to:
https://www.rttsweb.com/jmeter-integration-webinar
Epistemic Interaction - tuning interfaces to provide information for AI supportAlan Dix
Paper presented at SYNERGY workshop at AVI 2024, Genoa, Italy. 3rd June 2024
https://alandix.com/academic/papers/synergy2024-epistemic/
As machine learning integrates deeper into human-computer interactions, the concept of epistemic interaction emerges, aiming to refine these interactions to enhance system adaptability. This approach encourages minor, intentional adjustments in user behaviour to enrich the data available for system learning. This paper introduces epistemic interaction within the context of human-system communication, illustrating how deliberate interaction design can improve system understanding and adaptation. Through concrete examples, we demonstrate the potential of epistemic interaction to significantly advance human-computer interaction by leveraging intuitive human communication strategies to inform system design and functionality, offering a novel pathway for enriching user-system engagements.
UiPath Test Automation using UiPath Test Suite series, part 3DianaGray10
Welcome to UiPath Test Automation using UiPath Test Suite series part 3. In this session, we will cover desktop automation along with UI automation.
Topics covered:
UI automation Introduction,
UI automation Sample
Desktop automation flow
Pradeep Chinnala, Senior Consultant Automation Developer @WonderBotz and UiPath MVP
Deepak Rai, Automation Practice Lead, Boundaryless Group and UiPath MVP
GDG Cloud Southlake #33: Boule & Rebala: Effective AppSec in SDLC using Deplo...James Anderson
Effective Application Security in Software Delivery lifecycle using Deployment Firewall and DBOM
The modern software delivery process (or the CI/CD process) includes many tools, distributed teams, open-source code, and cloud platforms. Constant focus on speed to release software to market, along with the traditional slow and manual security checks has caused gaps in continuous security as an important piece in the software supply chain. Today organizations feel more susceptible to external and internal cyber threats due to the vast attack surface in their applications supply chain and the lack of end-to-end governance and risk management.
The software team must secure its software delivery process to avoid vulnerability and security breaches. This needs to be achieved with existing tool chains and without extensive rework of the delivery processes. This talk will present strategies and techniques for providing visibility into the true risk of the existing vulnerabilities, preventing the introduction of security issues in the software, resolving vulnerabilities in production environments quickly, and capturing the deployment bill of materials (DBOM).
Speakers:
Bob Boule
Robert Boule is a technology enthusiast with PASSION for technology and making things work along with a knack for helping others understand how things work. He comes with around 20 years of solution engineering experience in application security, software continuous delivery, and SaaS platforms. He is known for his dynamic presentations in CI/CD and application security integrated in software delivery lifecycle.
Gopinath Rebala
Gopinath Rebala is the CTO of OpsMx, where he has overall responsibility for the machine learning and data processing architectures for Secure Software Delivery. Gopi also has a strong connection with our customers, leading design and architecture for strategic implementations. Gopi is a frequent speaker and well-known leader in continuous delivery and integrating security into software delivery.
Smart TV Buyer Insights Survey 2024 by 91mobiles.pdf91mobiles
91mobiles recently conducted a Smart TV Buyer Insights Survey in which we asked over 3,000 respondents about the TV they own, aspects they look at on a new TV, and their TV buying preferences.
PHP Frameworks: I want to break free (IPC Berlin 2024)Ralf Eggert
In this presentation, we examine the challenges and limitations of relying too heavily on PHP frameworks in web development. We discuss the history of PHP and its frameworks to understand how this dependence has evolved. The focus will be on providing concrete tips and strategies to reduce reliance on these frameworks, based on real-world examples and practical considerations. The goal is to equip developers with the skills and knowledge to create more flexible and future-proof web applications. We'll explore the importance of maintaining autonomy in a rapidly changing tech landscape and how to make informed decisions in PHP development.
This talk is aimed at encouraging a more independent approach to using PHP frameworks, moving towards a more flexible and future-proof approach to PHP development.
Neuro-symbolic is not enough, we need neuro-*semantic*Frank van Harmelen
Neuro-symbolic (NeSy) AI is on the rise. However, simply machine learning on just any symbolic structure is not sufficient to really harvest the gains of NeSy. These will only be gained when the symbolic structures have an actual semantics. I give an operational definition of semantics as “predictable inference”.
All of this illustrated with link prediction over knowledge graphs, but the argument is general.
Slack (or Teams) Automation for Bonterra Impact Management (fka Social Soluti...Jeffrey Haguewood
Sidekick Solutions uses Bonterra Impact Management (fka Social Solutions Apricot) and automation solutions to integrate data for business workflows.
We believe integration and automation are essential to user experience and the promise of efficient work through technology. Automation is the critical ingredient to realizing that full vision. We develop integration products and services for Bonterra Case Management software to support the deployment of automations for a variety of use cases.
This video focuses on the notifications, alerts, and approval requests using Slack for Bonterra Impact Management. The solutions covered in this webinar can also be deployed for Microsoft Teams.
Interested in deploying notification automations for Bonterra Impact Management? Contact us at sales@sidekicksolutionsllc.com to discuss next steps.
Dev Dives: Train smarter, not harder – active learning and UiPath LLMs for do...UiPathCommunity
💥 Speed, accuracy, and scaling – discover the superpowers of GenAI in action with UiPath Document Understanding and Communications Mining™:
See how to accelerate model training and optimize model performance with active learning
Learn about the latest enhancements to out-of-the-box document processing – with little to no training required
Get an exclusive demo of the new family of UiPath LLMs – GenAI models specialized for processing different types of documents and messages
This is a hands-on session specifically designed for automation developers and AI enthusiasts seeking to enhance their knowledge in leveraging the latest intelligent document processing capabilities offered by UiPath.
Speakers:
👨🏫 Andras Palfi, Senior Product Manager, UiPath
👩🏫 Lenka Dulovicova, Product Program Manager, UiPath
The Art of the Pitch: WordPress Relationships and SalesLaura Byrne
Clients don’t know what they don’t know. What web solutions are right for them? How does WordPress come into the picture? How do you make sure you understand scope and timeline? What do you do if sometime changes?
All these questions and more will be explored as we talk about matching clients’ needs with what your agency offers without pulling teeth or pulling your hair out. Practical tips, and strategies for successful relationship building that leads to closing the deal.
The Art of the Pitch: WordPress Relationships and Sales
Fact table design for data ware house
1. SOFTWARE/WEB/MOBILE/DATABASE ARCHITECT, ENGINEER, AND DEVELOPER
TORONTO, CANADA
HTTP://SAYED.JUSTETC.NET
HTTP://WWW.JUSTETC.NET
Sayed Ahmed
Data Warehouse Fact Table Design
Logical Design of a Data Warehouse
2. This is a video just for the sake of a video
I will not explain anything
Just will walk through on some presentation
slides on Data Warehouse
3. OUR SERVICES
Free Training and Educational Services
Training and Education in Bangla:
Bangla.SaLearningSchool.com
Training and Education in English:
www.SaLearningSchool.com
English.SaLearningSchool.com
http://sitestree.com
Ask a question and get answers:
Ask.JustEtc.net
4. FACT TABLE DESIGN
Fact Table Design Topics
Define fact table column types
Understand the additivity of a measure
i.e. for measure column type
Handle many-to-many relationships in a Star
schema
6. FACT TABLE COLUMNS - MEASURE
Measure Column Type
Measure columns help with measurements
useful for a specific business process
Measures columns are usually numeric
And can be aggregated
Measure columns store values that are of
interest to businesses such as
sales amount, order quantity, and discount amount
7. MEASURES
Fact tables - Measures
Collection of measurements on a specific
aspects of business
Measure columns
sales amount, order quantity, and discount
amount.
8. FACT TABLE COLUMNS – FOREIGN KEY
Foreign Key – Column Type
These are the columns as coming from
Dimension Tables
Are the primary keys of Dimension Tables
9. FACT TABLE COLUMNS – SURROGATE KEYS
Surrogate Key
Usually will comes from the primary dimension
table (primary for the current fact table)
Usually one or two columns in a fact table are
surrogate keys
10. SURROGATE KEYS FOR FACT TABLES
OrderId and LineItemId are the
surrogate keys as coming from the
primary Source Order details table
OrderId and LineItemId columns will help
For quick comparisons with source data
Surrogate keys are not a must in fact tables;
however, they help
Must read:
http://www.kimballgroup.com/2006/07/d
esign-tip-81-fact-table-surrogate-key/
11. LINEAGE COLUMNS IN FACT TABLES
Lineage columns
Just as with dimension tables, these are strictly
for auditing purposes
References:
https://upsearch.com/implementing-a-data-
warehouse-fact-tables/
12. ADDITIVITY OF MEASURES
The primary purpose of Data warehouse is reporting,
and forecasting
Many times reports are aggregations such as sum
Example: sales by quarter, by region, by product type
Many reports are usually aggregations
Hence, fact tables will have some columns to assist
with that measures and aggregations for reporting
These are the measures columns as we discussed
before
The measures that you add will help in how you want
to do the measures and reporting
13. TYPES OF ADDITIVITY OF MEASURES
Types of Additivity of Measures
additive measures
Semi-additive measures
non-additive measures
14. ADDITIVE, SEMI-ADDITIVE MEASURES
Additive
If a measure can be summed across all dimensions
Semi-additive
Sometimes, we can sum a measure across all
dimensions except for time
such as account balance
We can’t sum the account balance across the time
dimension
We would need to do something like take the average
instead
or simply use the last value
Measures like this are called semi-additive measures
15. NON-ADDITIVE MEASURES
Some measures can’t ever be summed
These are called non-additive measures
Such as discount percentages and prices
These are the non-additive measures
16. ADDITIVITY OF MEASURES IN SSAS
SSAS has support for semi-additive and non-
additive measures
The SSAS database model
Business Intelligence Semantic Model (BISM).
BISM includes way more additional metadata
than RDBMS
SSAS has two types of storage
dimensional and
tabular
17. SSAS AND ADDITIVITY OF MEASURES
Tabular storage works through tables like a
data warehouse does
quicker to develop
The dimensional model
more properly represents a cube
The dimensional model includes
even more metadata than the tabular model
18. SSAS AND ADDITIVITY OF MEASURES
In BISM dimensional processing
SSAS offers semi-additive aggregate functions
out of the box
For example,
SSAS offers the LastNonEmpty aggregate
function
which properly uses the SUM aggregate function
across all dimensions but time
and defines the last known value as the aggregate
over time
19. SSAS AND ADDITIVITY OF MEASURES
In the BISM tabular model
you use the Data Analysis Expression (DAX)
language
The DAX language includes functions that let
you build semi-additive expressions quite quickly
as well
20. MANY TO MANY RELATIONSHIPS IN DATA WAREHOUSE
RDBMS Many to Many Relationship
21. MANY TO MANY IN RDBMS AND DW
RDBMS Model as above image is ok, Because
Every internet sales will have multiple reasons
Every reasons will have multiple internet sales
However, data warehouse has issues with such
modeling
because when using tools to build reporting the fact
table is expected to be on the many side
In the above picture, fact table is on the one side
In SSAS reporting, many times, we use tools that
build MDX queries that expect the schema to be
perfectly in star or snow-flake schema
22. HOW CAN WE RESOLVE ...
In SSAS with a BISM dimensional model
you can solve the problem by creating an
intermediate dimension between both fact tables
Picture as below
24. DW MANY TO MANY
You create it from the primary key of
theFactInternetSales table
DimFactInternetSales.
put it on the “one” side of the relationships with both fact
tables
Now, both fact tables are always on the “many”
side of any relationship
However, the relationship between
theFactInternetSales and the
new DimFactInternetSales dimension
is de facto one to one
26. OUR SERVICES
Free Training and Educational Services
Training and Education in Bangla:
Bangla.SaLearningSchool.com
Training and Education in English:
www.SaLearningSchool.com
English.SaLearningSchool.com
http://sitestree.com
Ask a question and get answers:
Ask.JustEtc.net