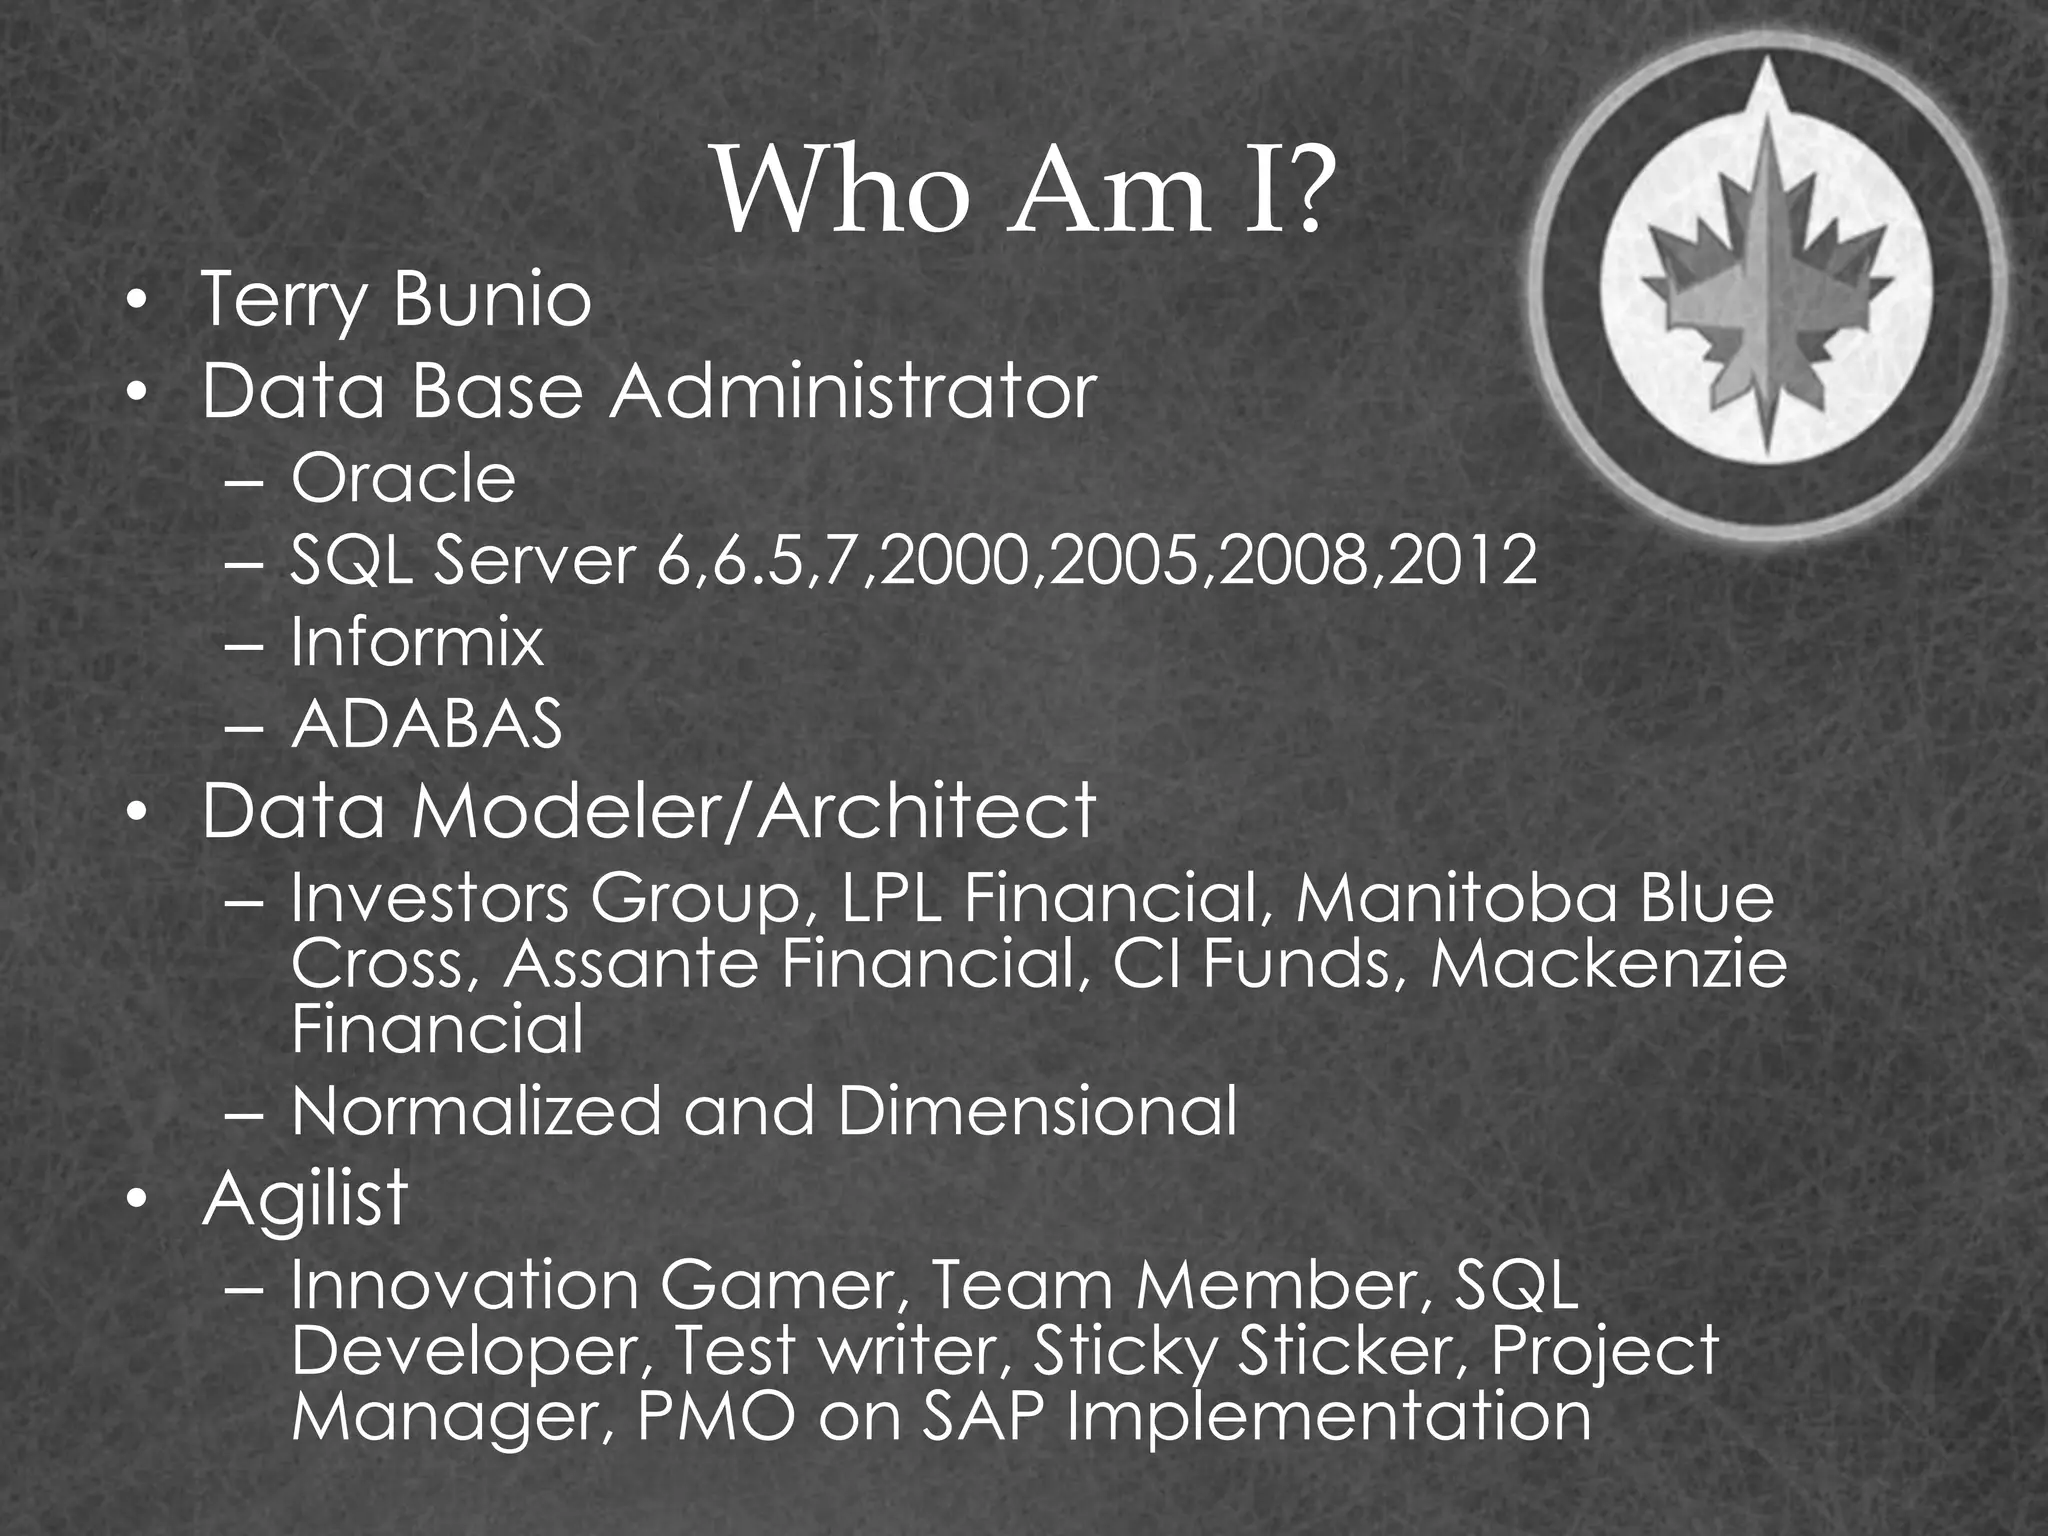
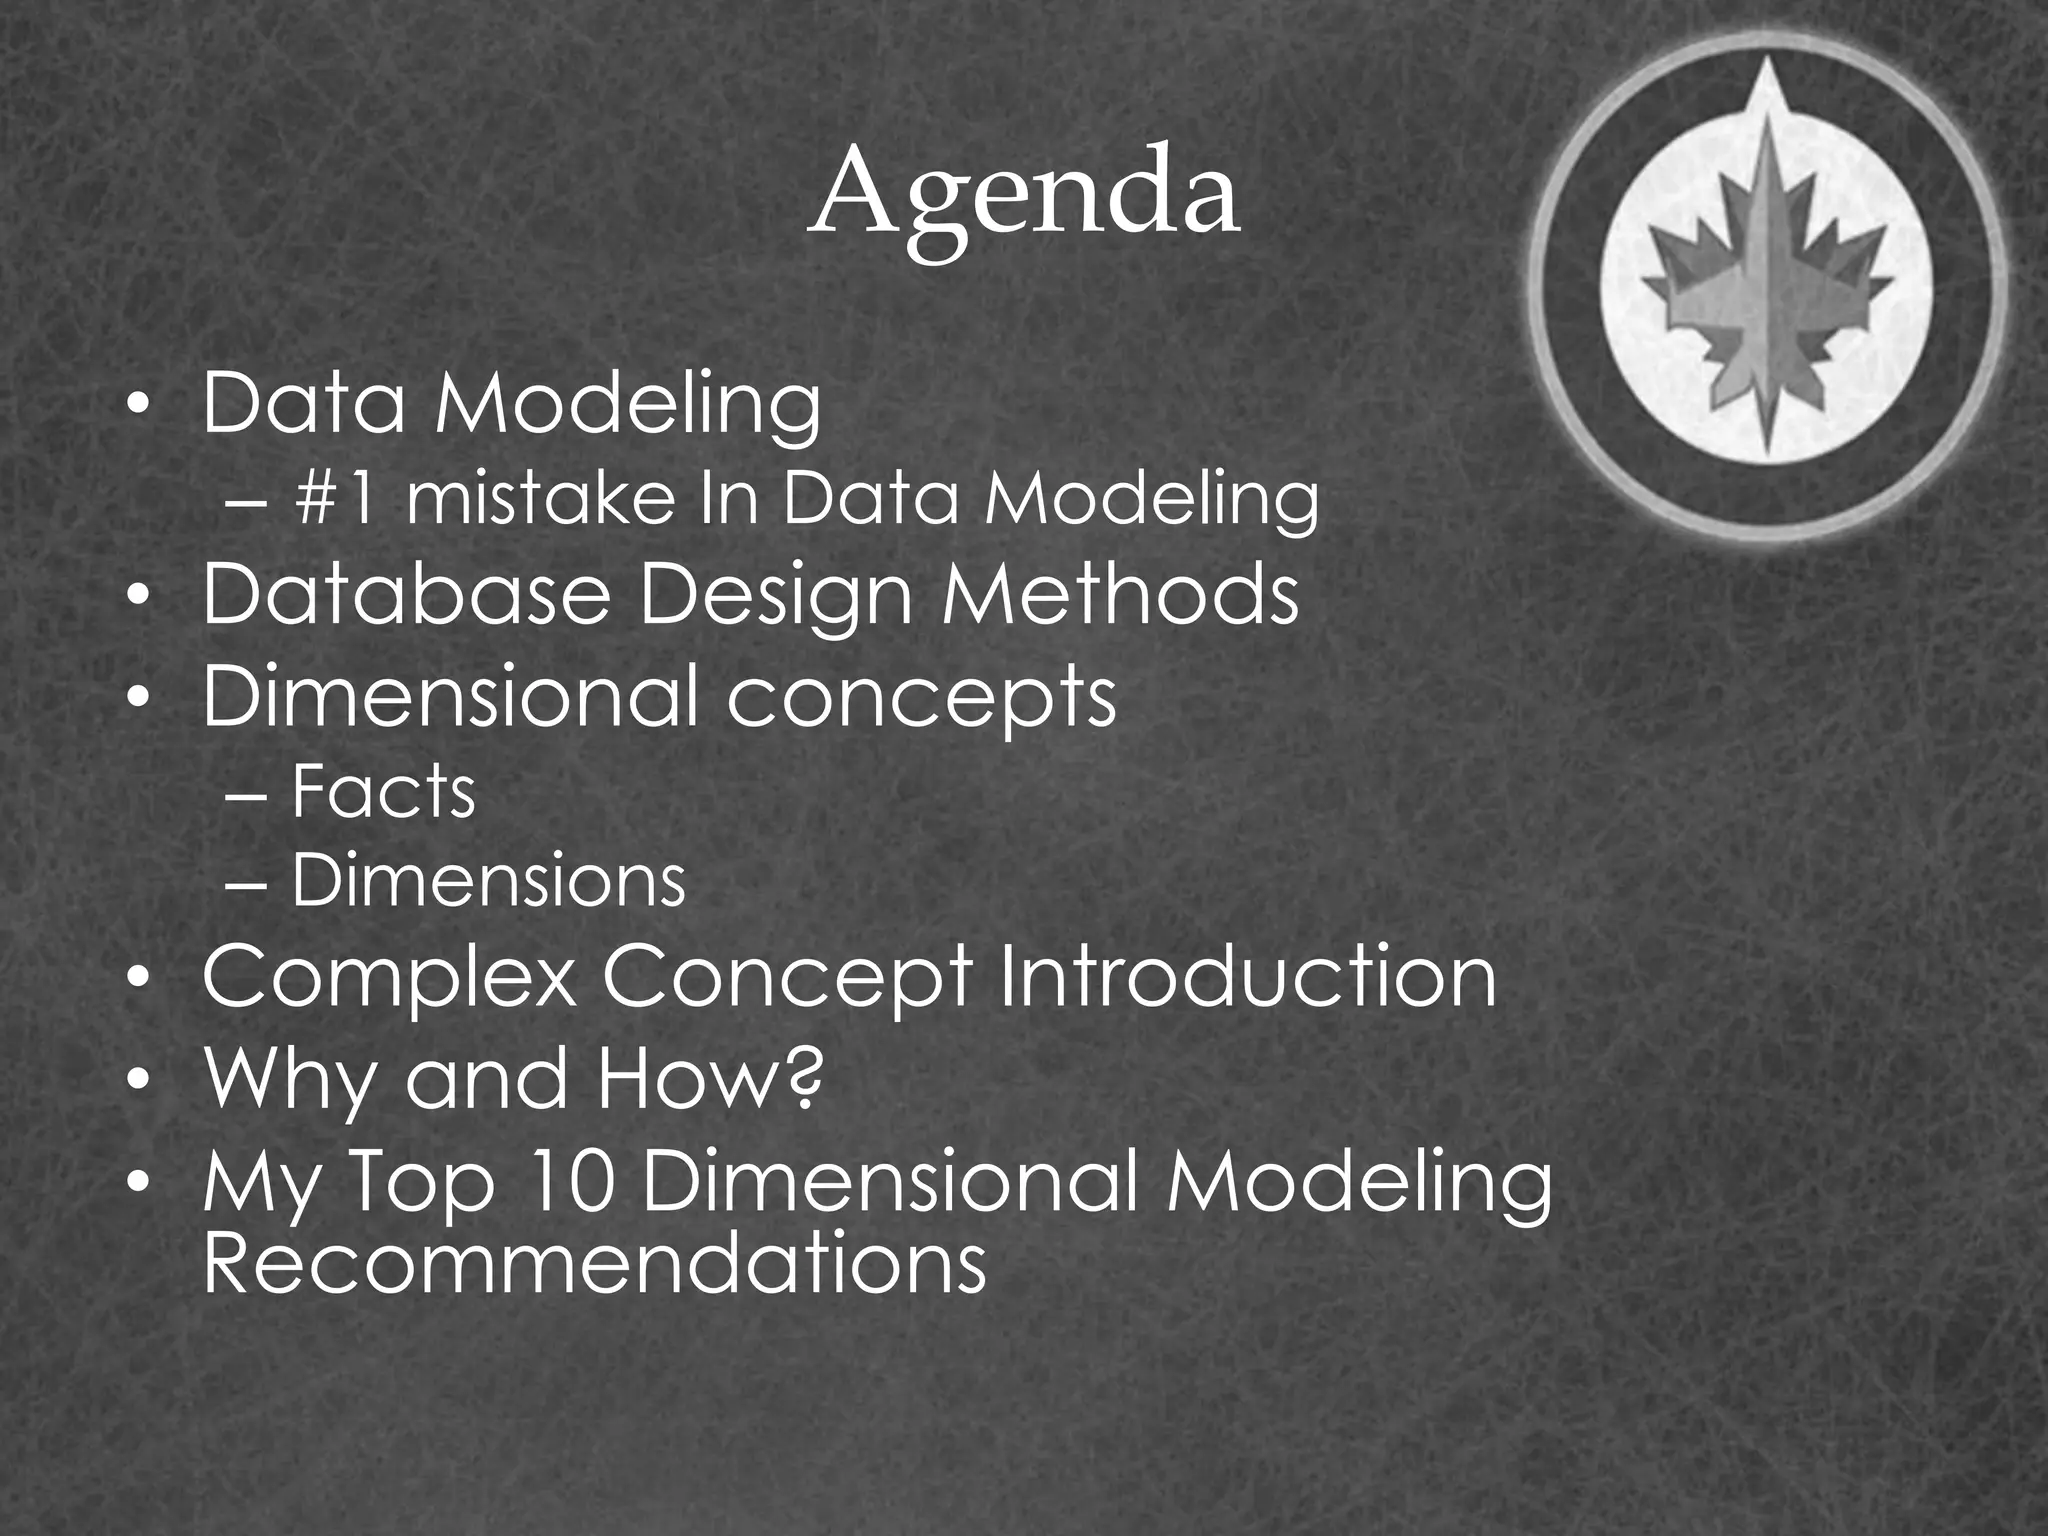
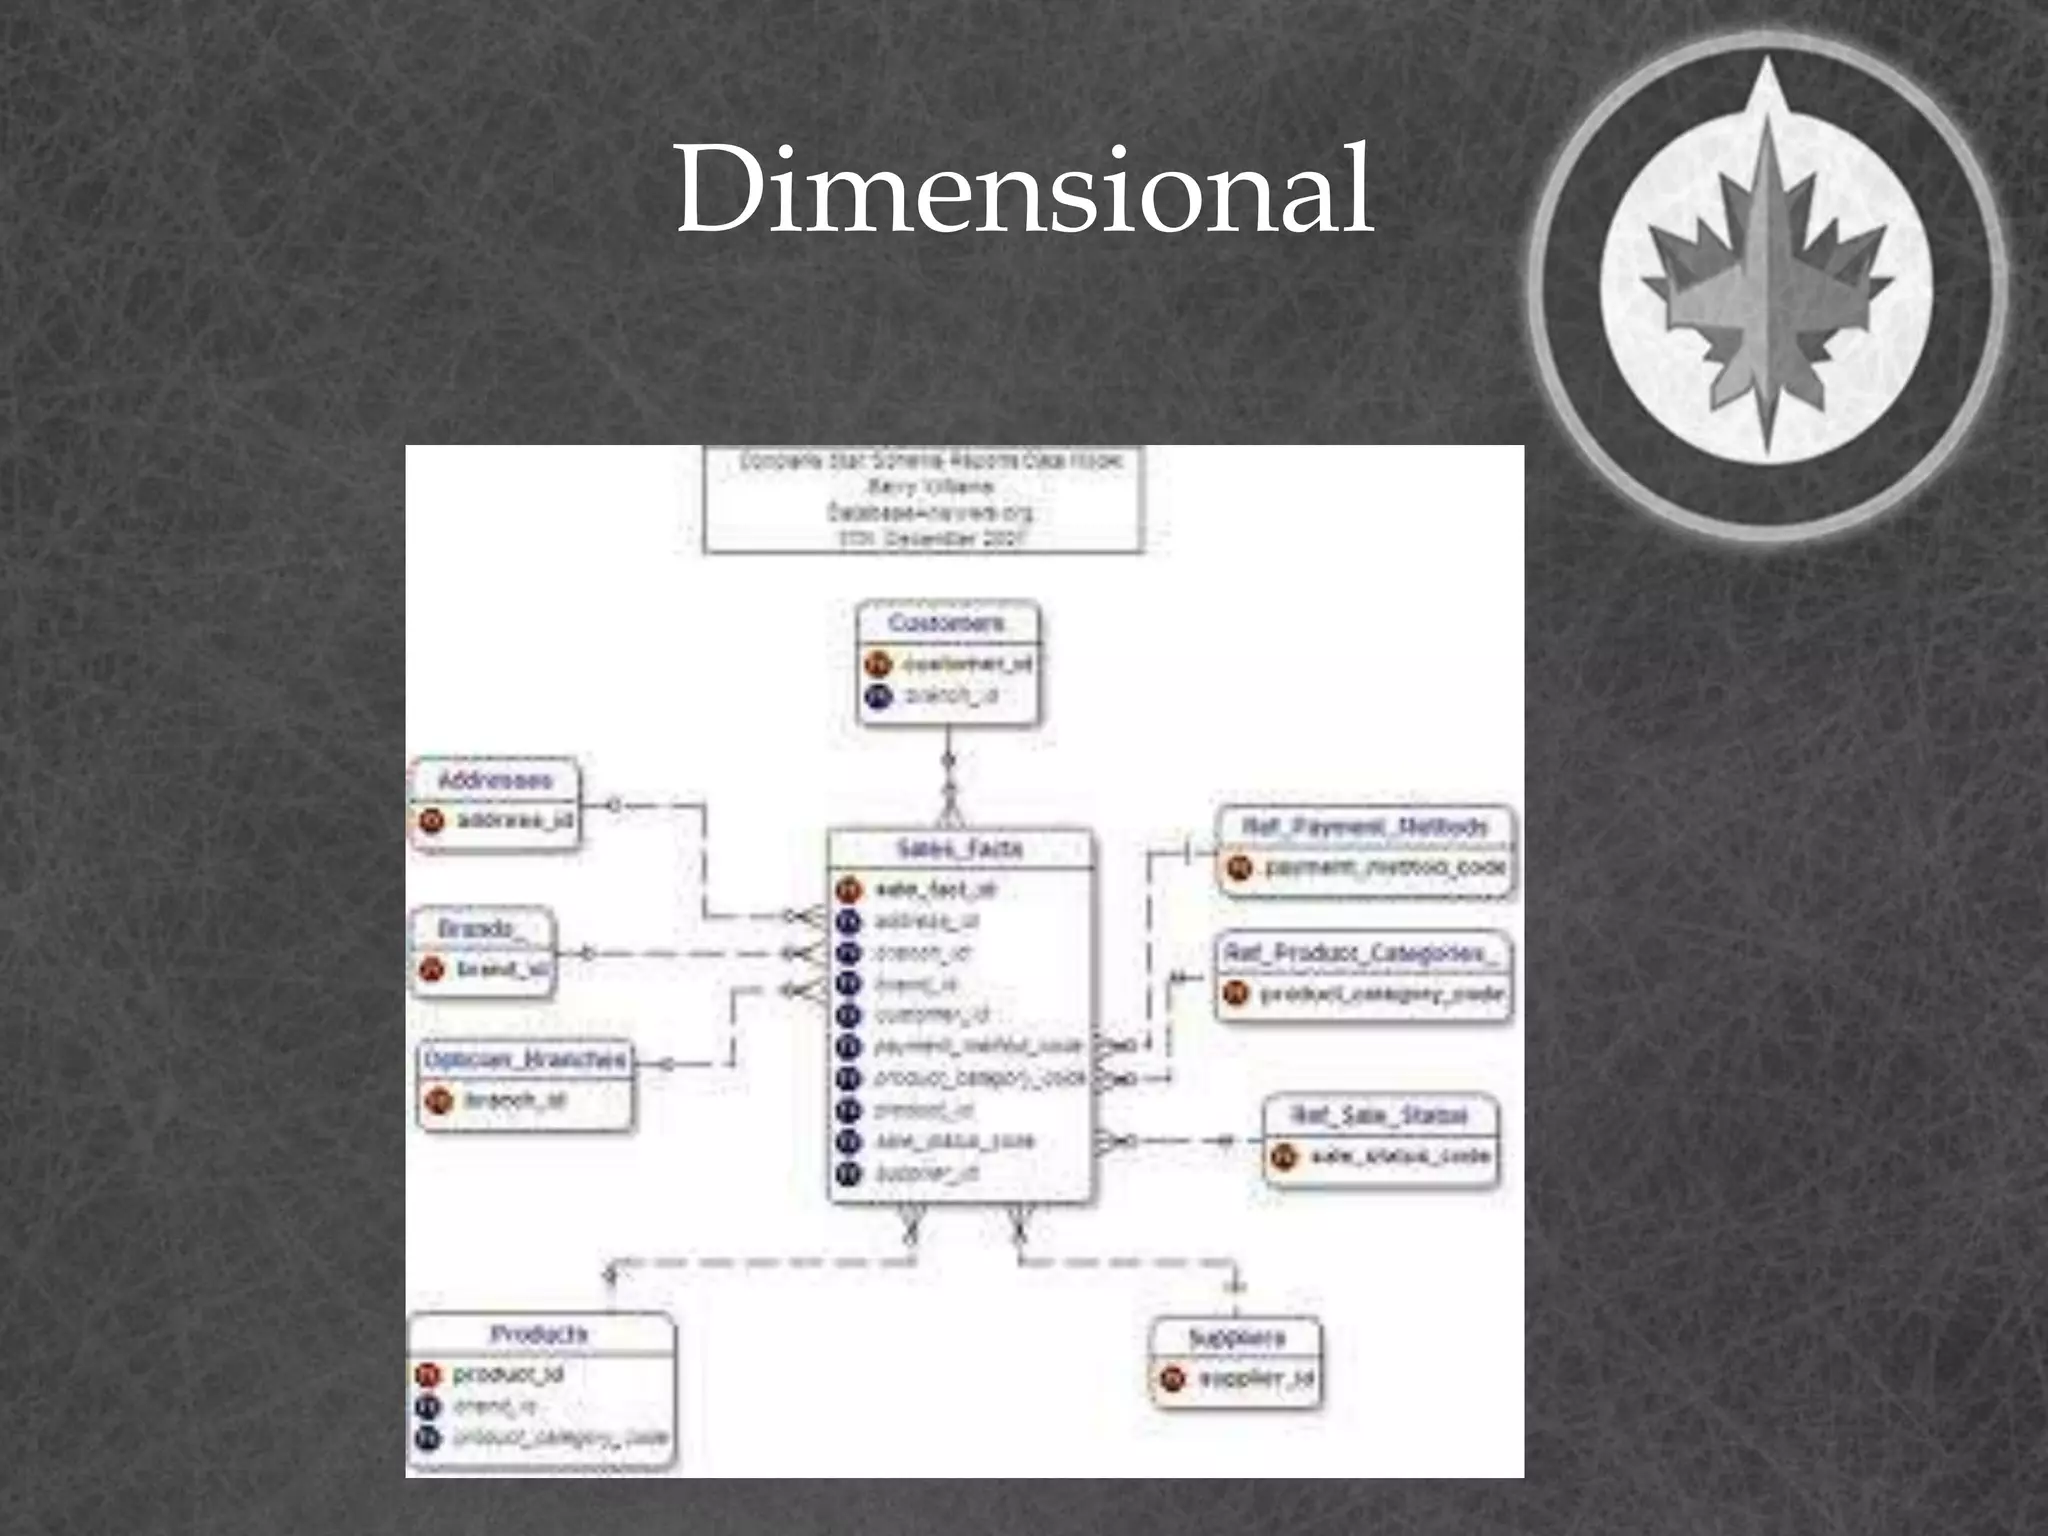
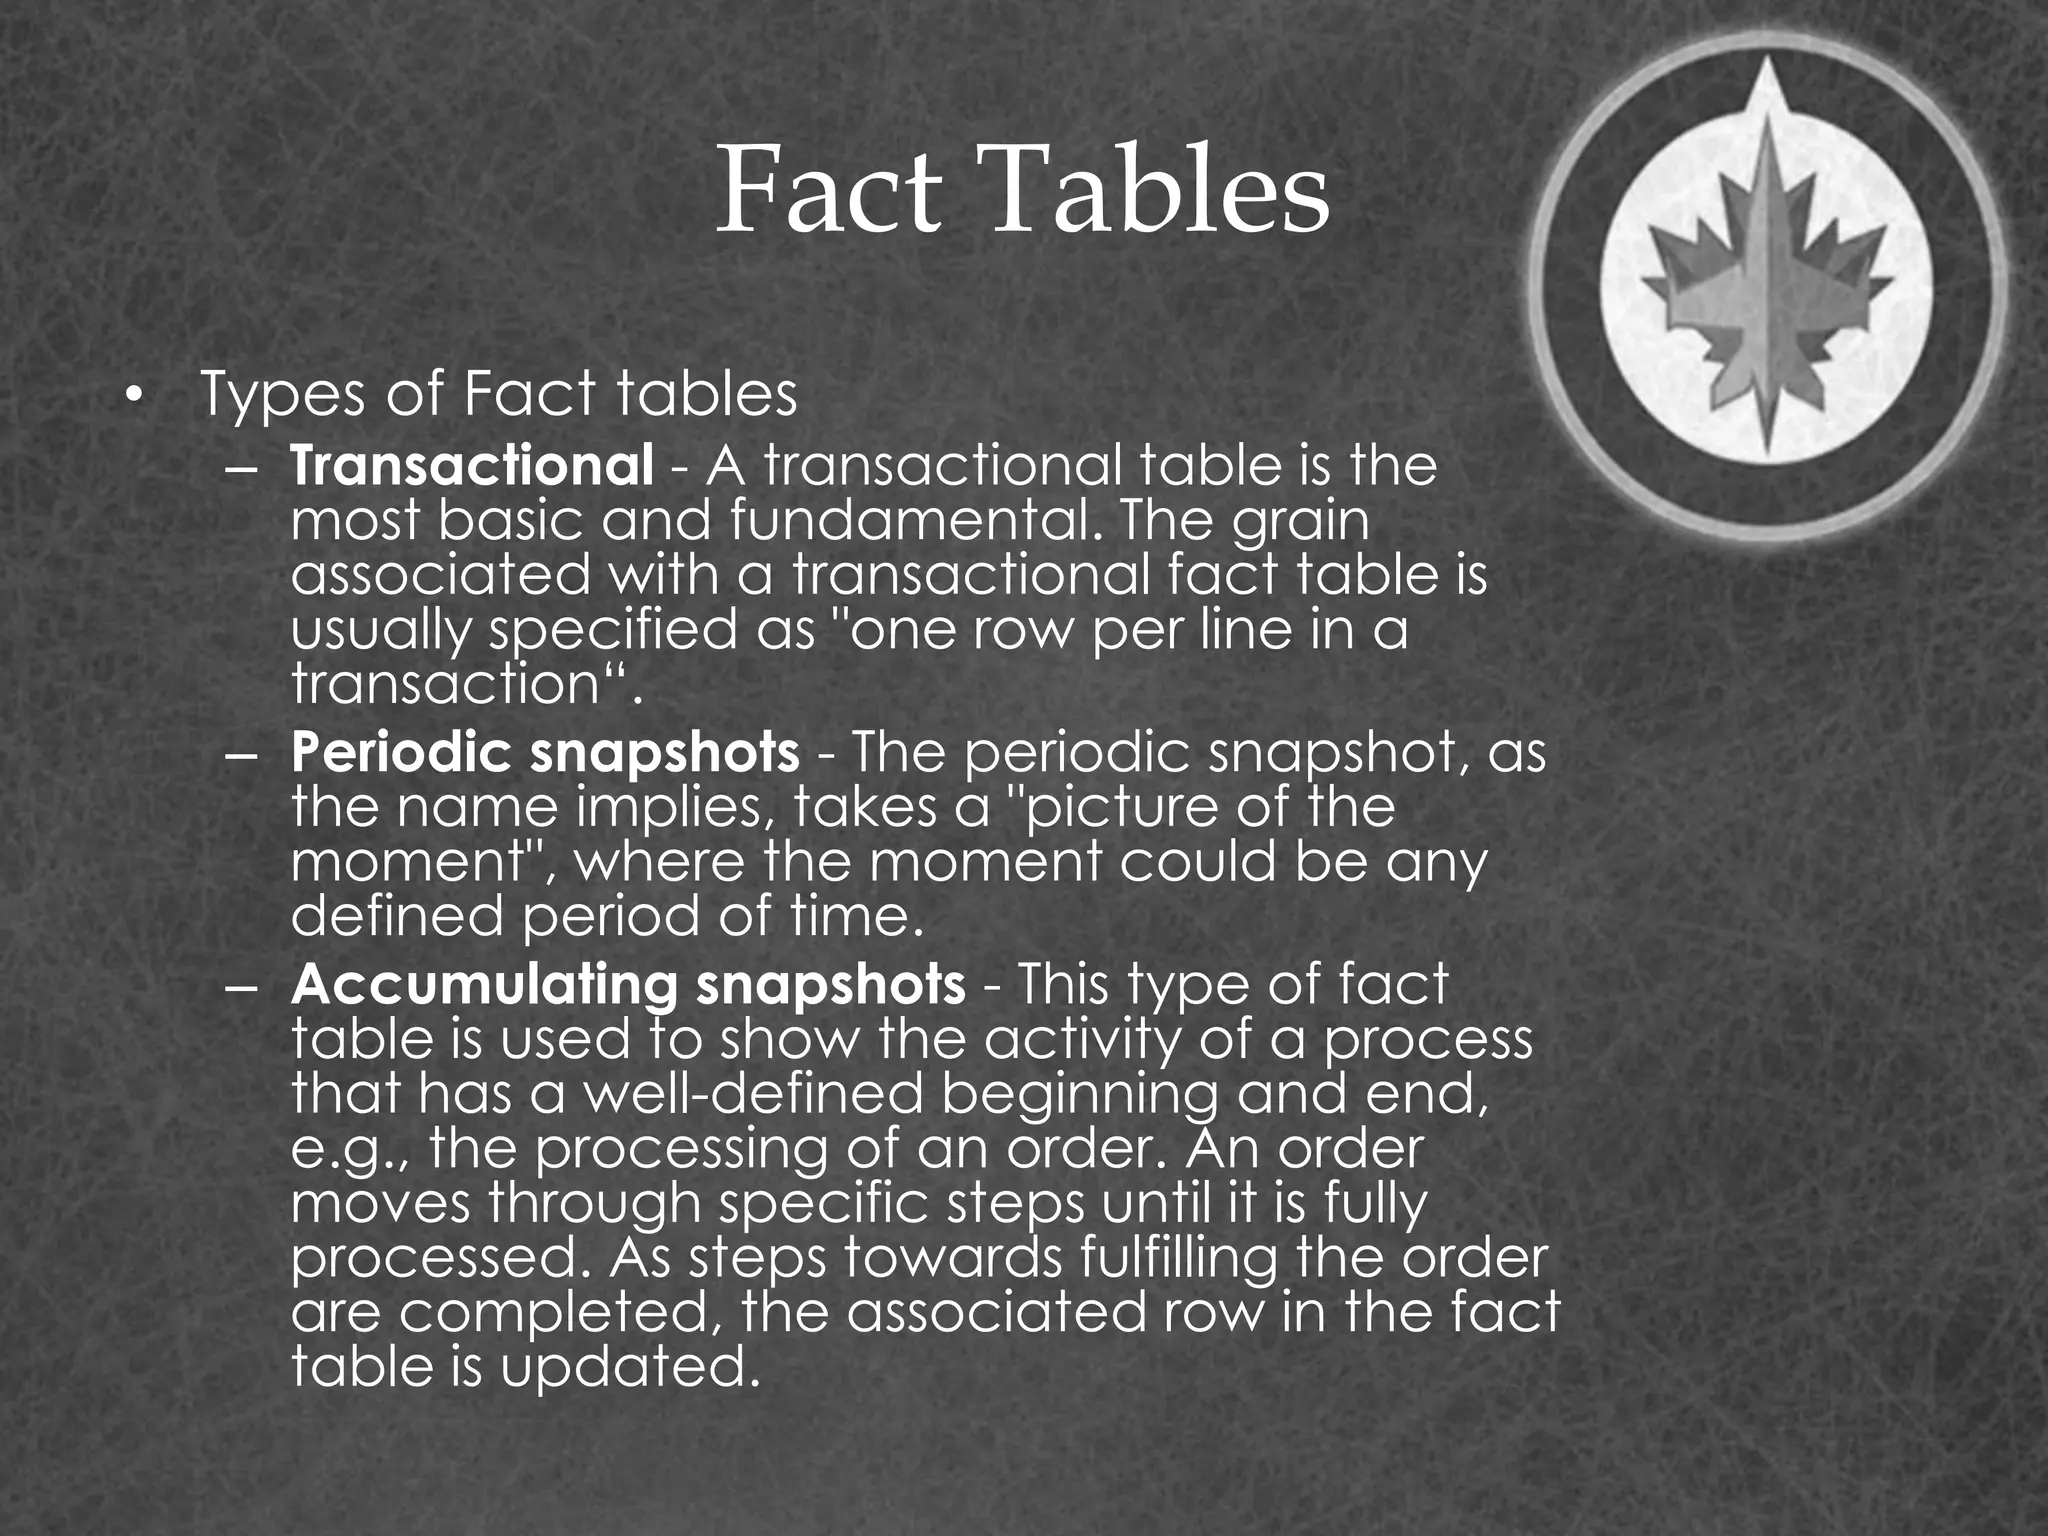
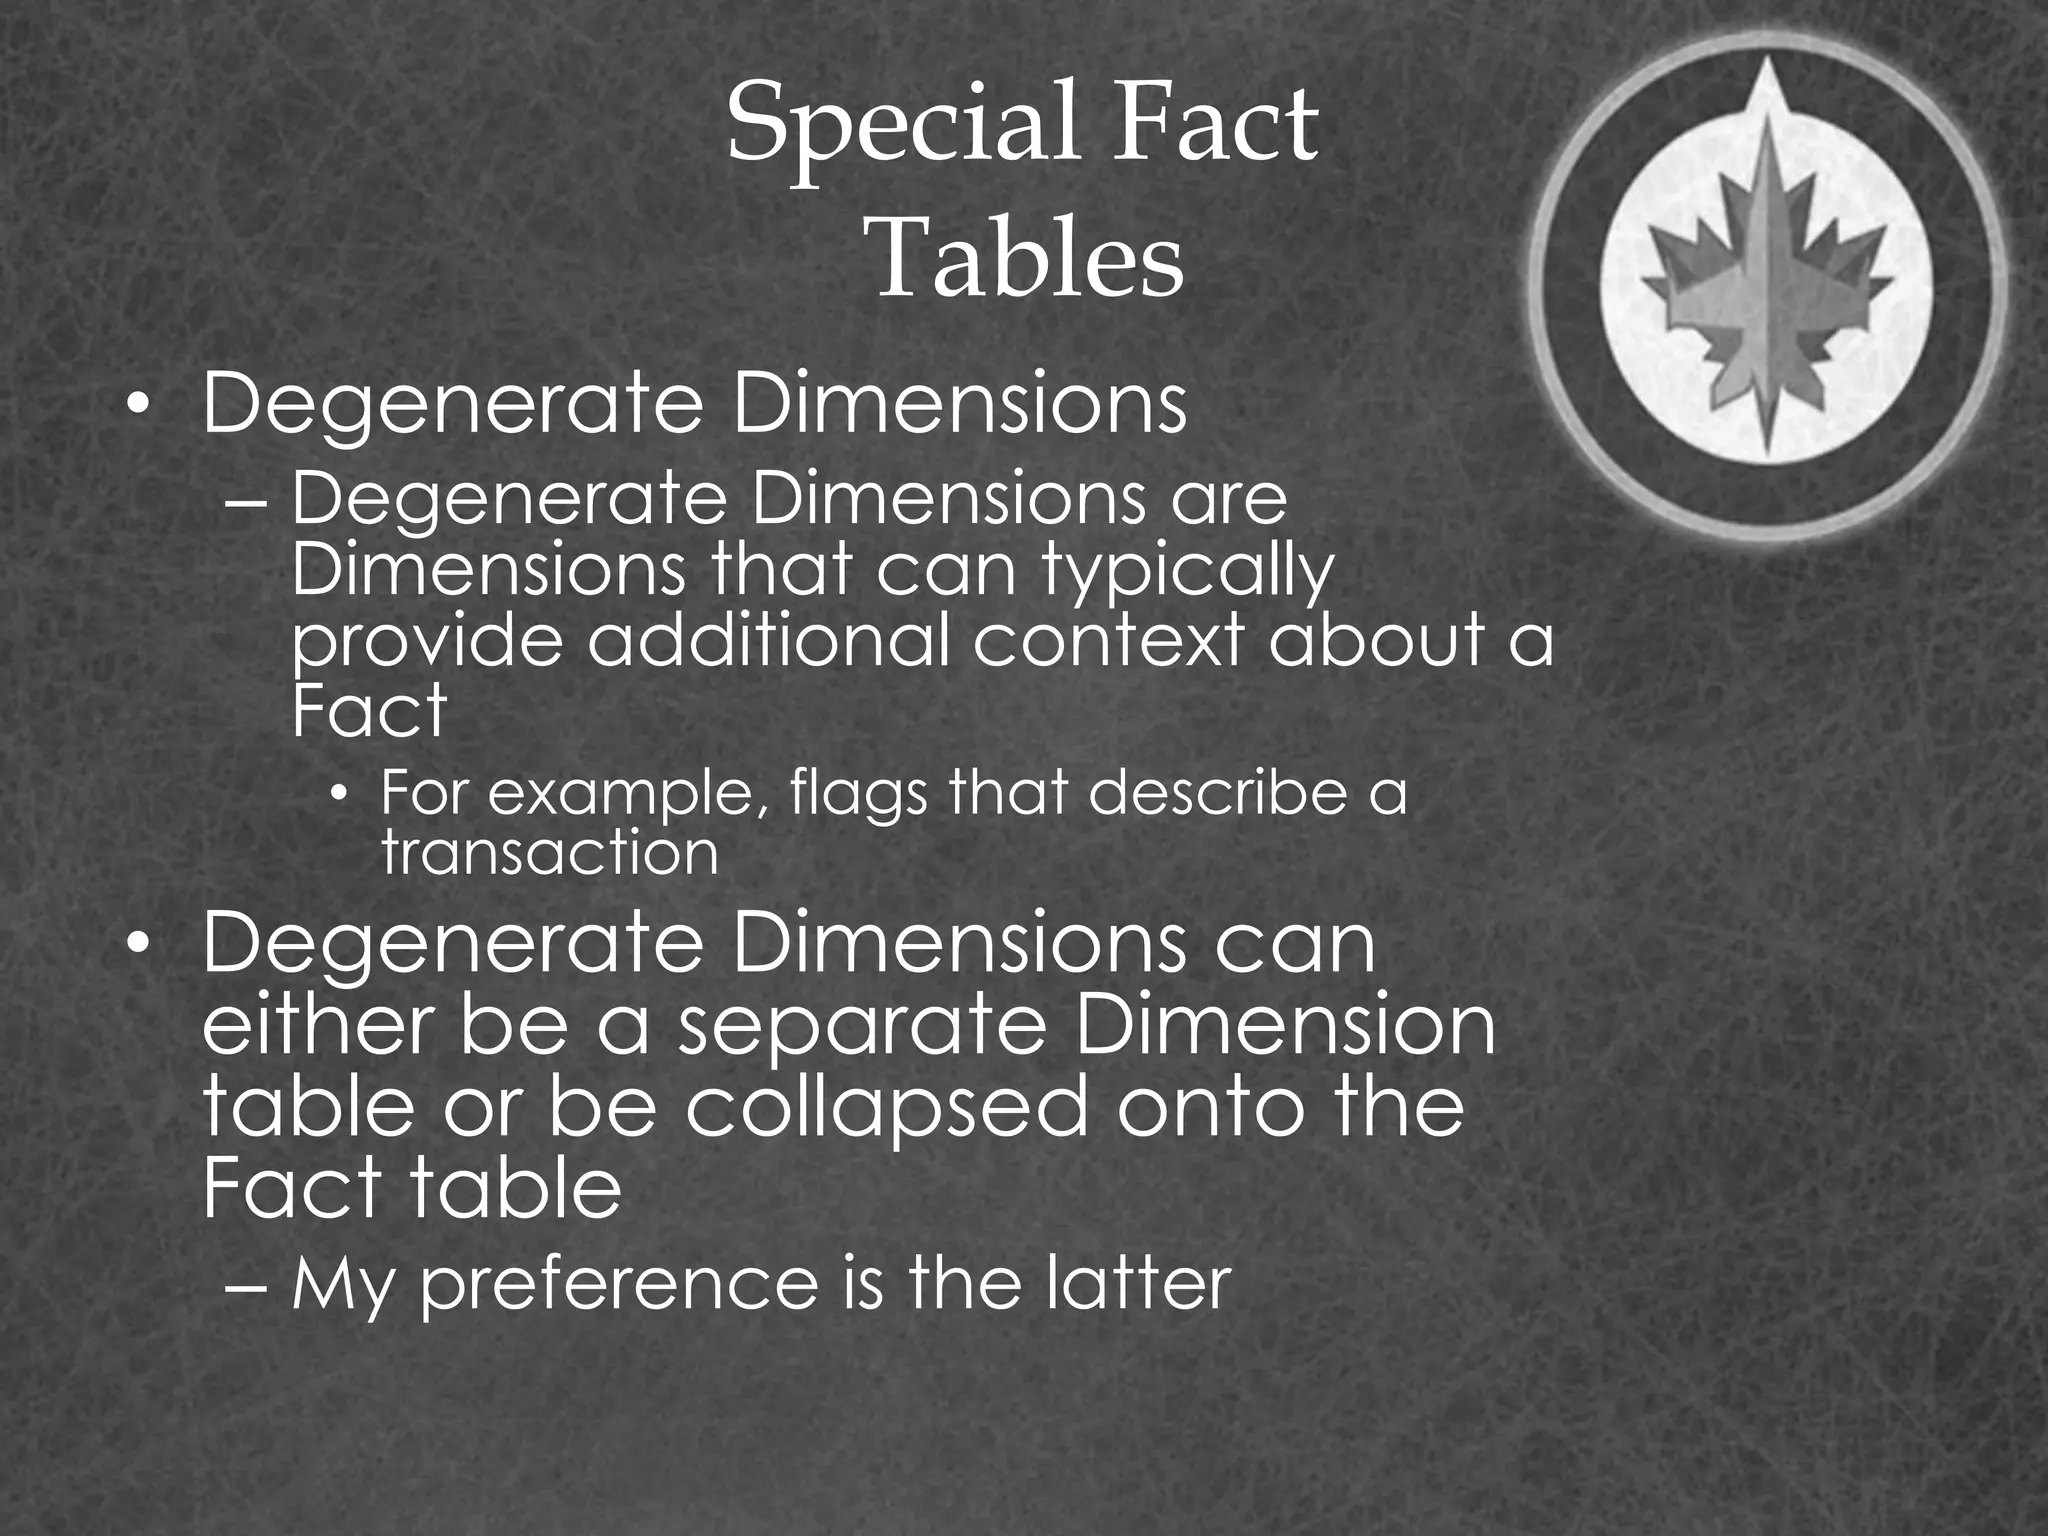
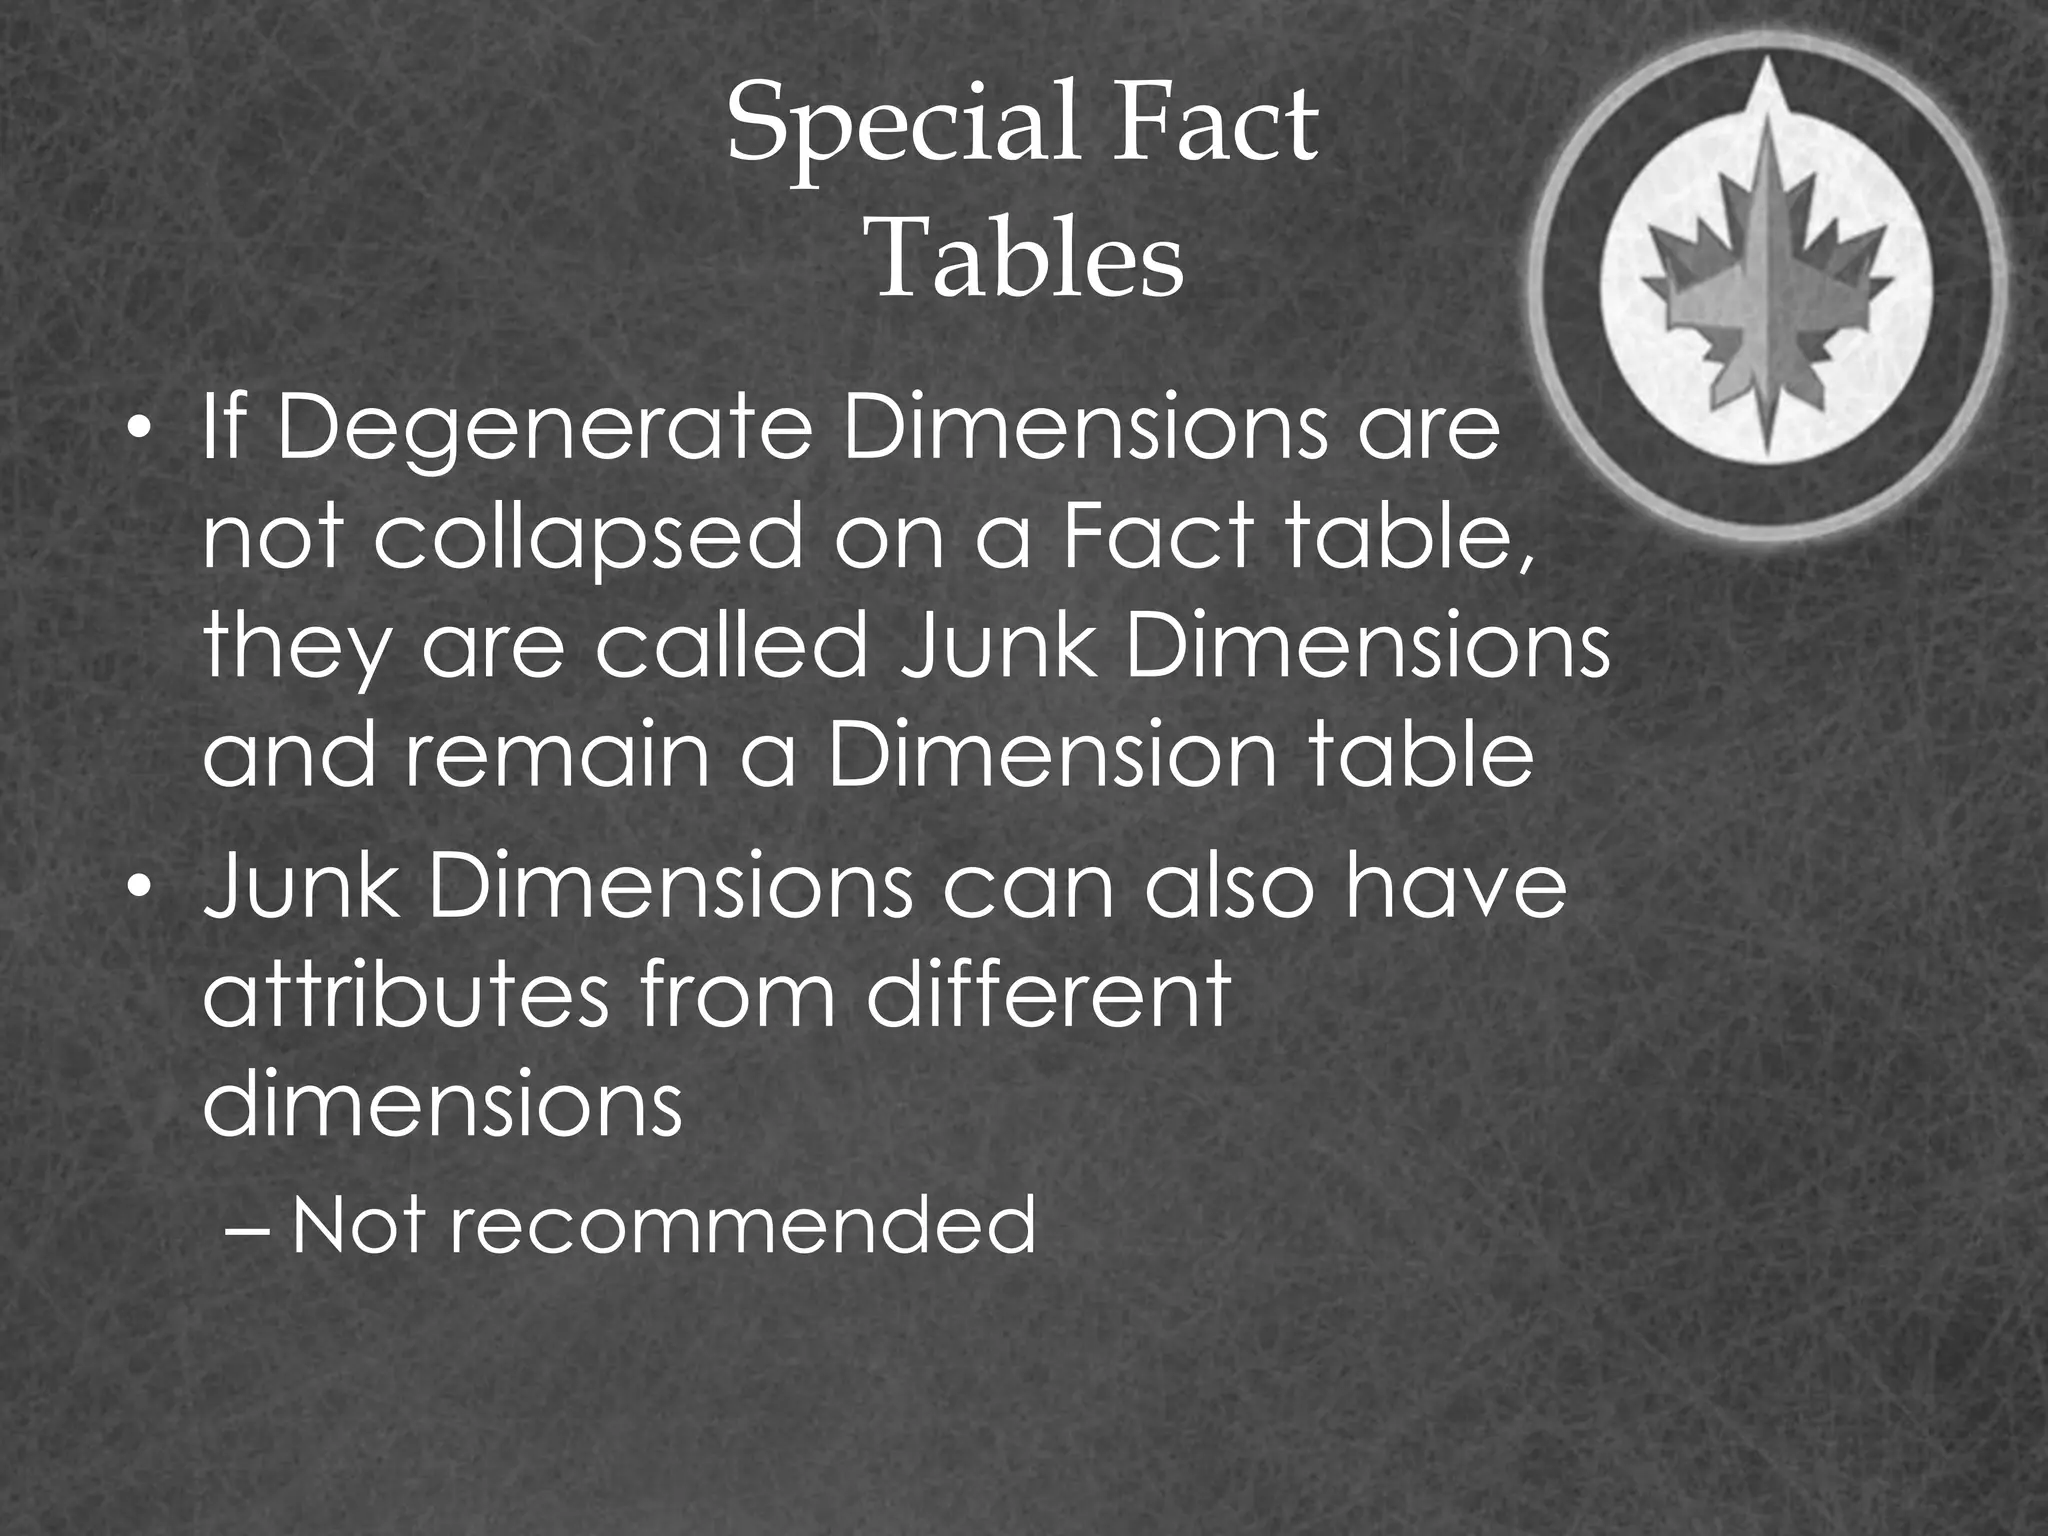
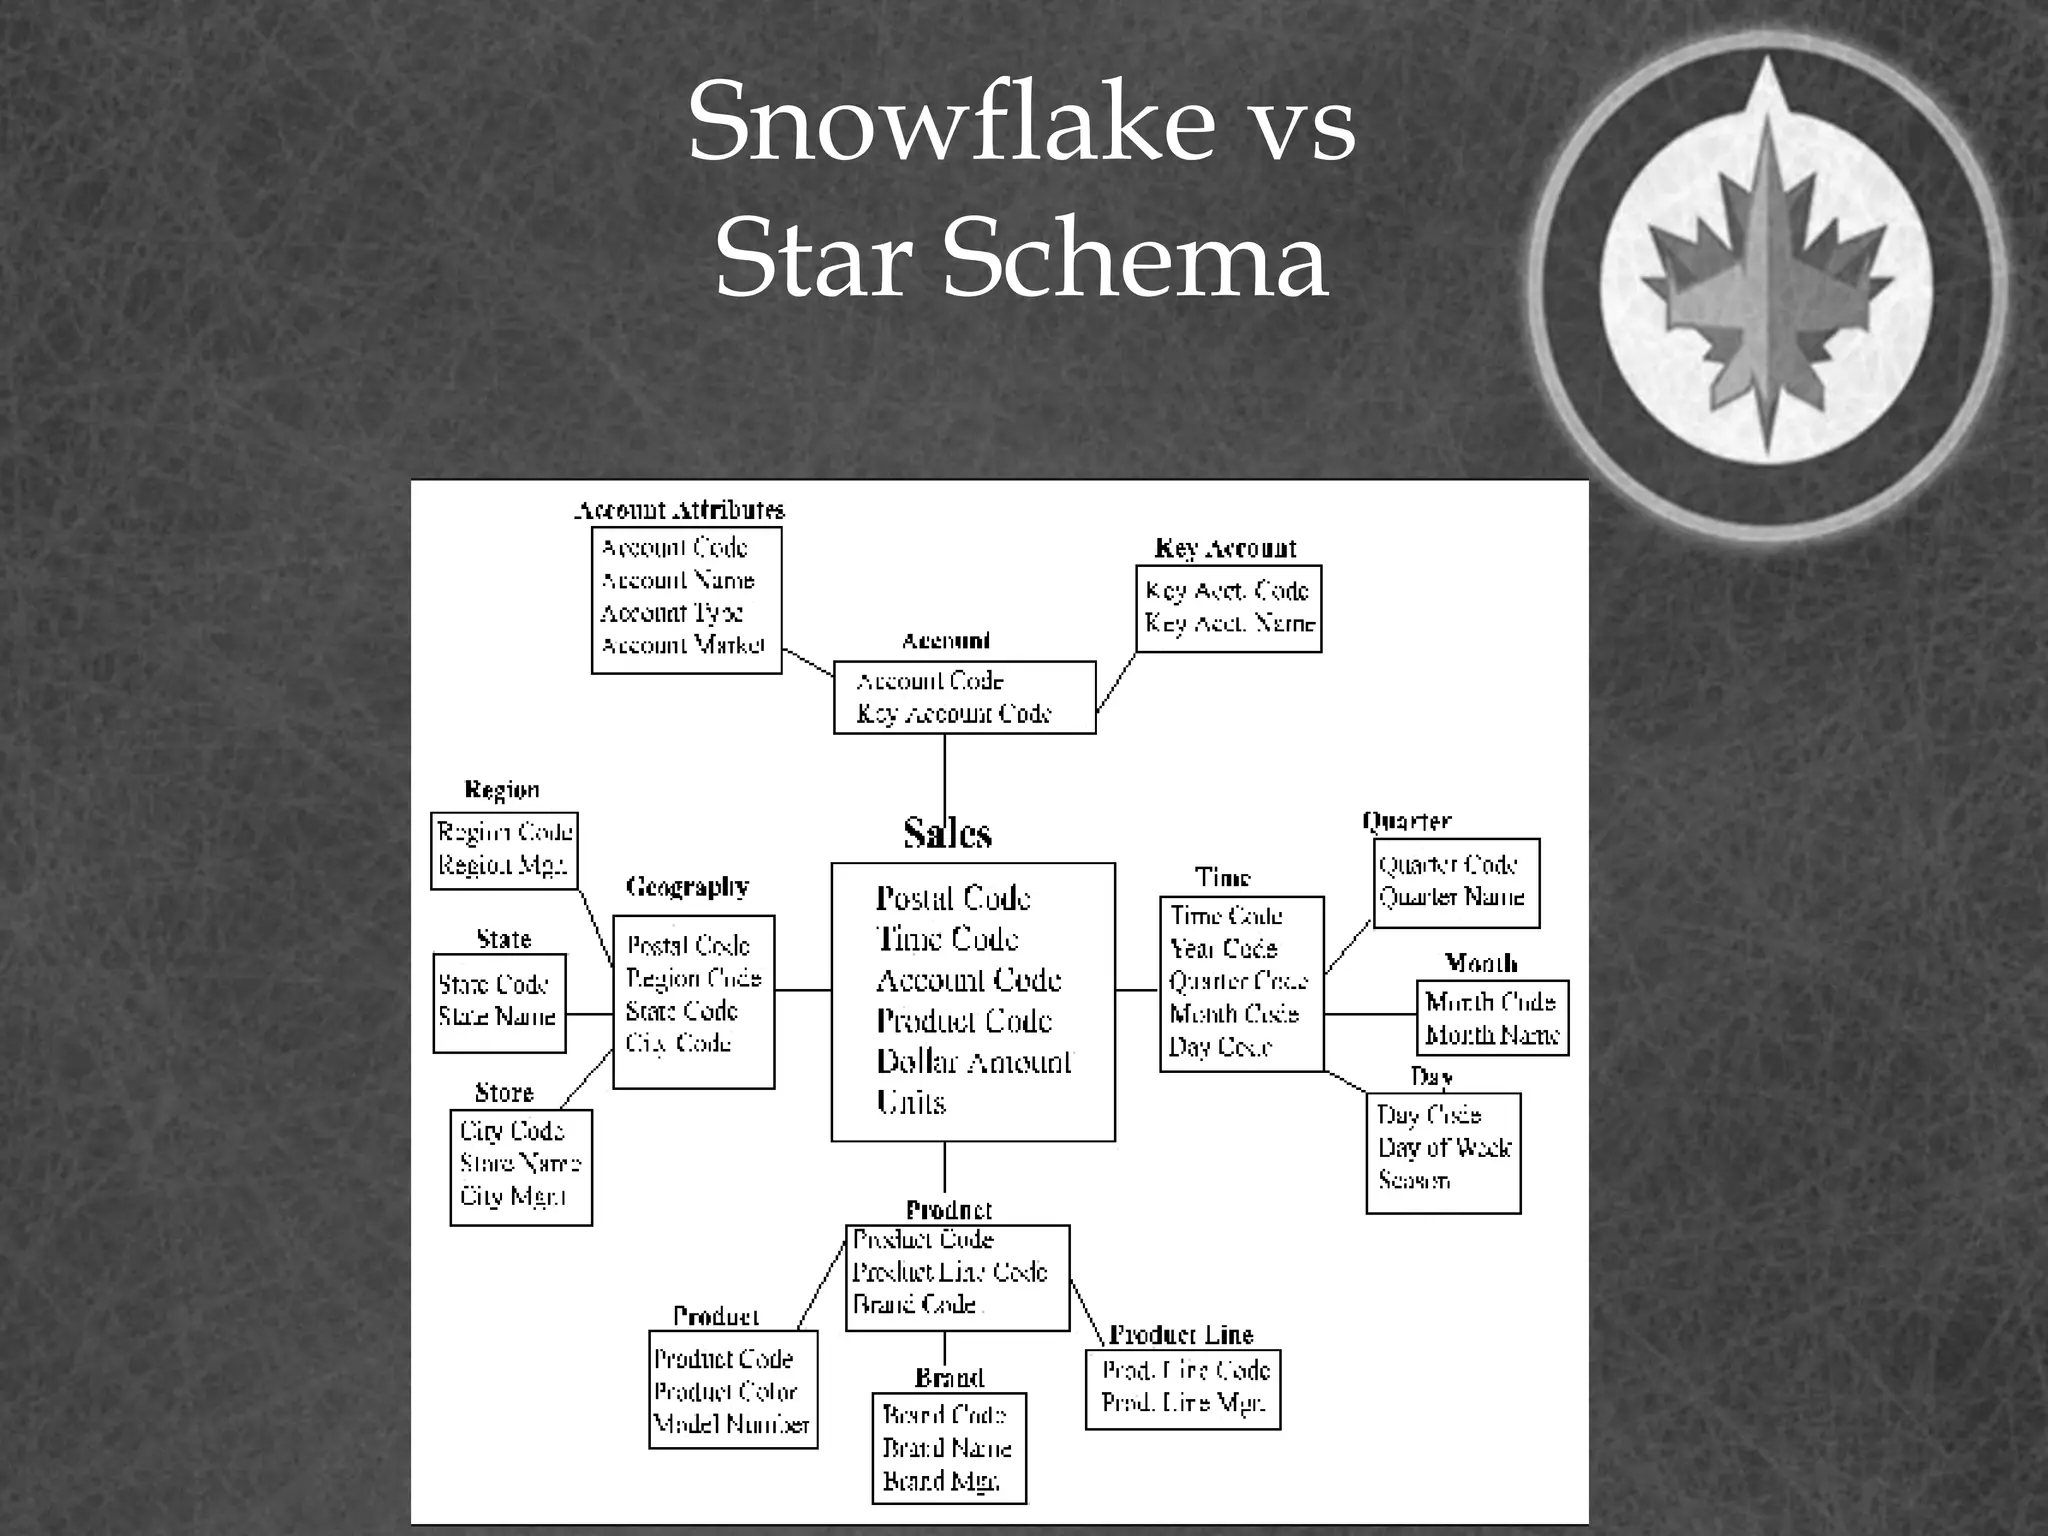
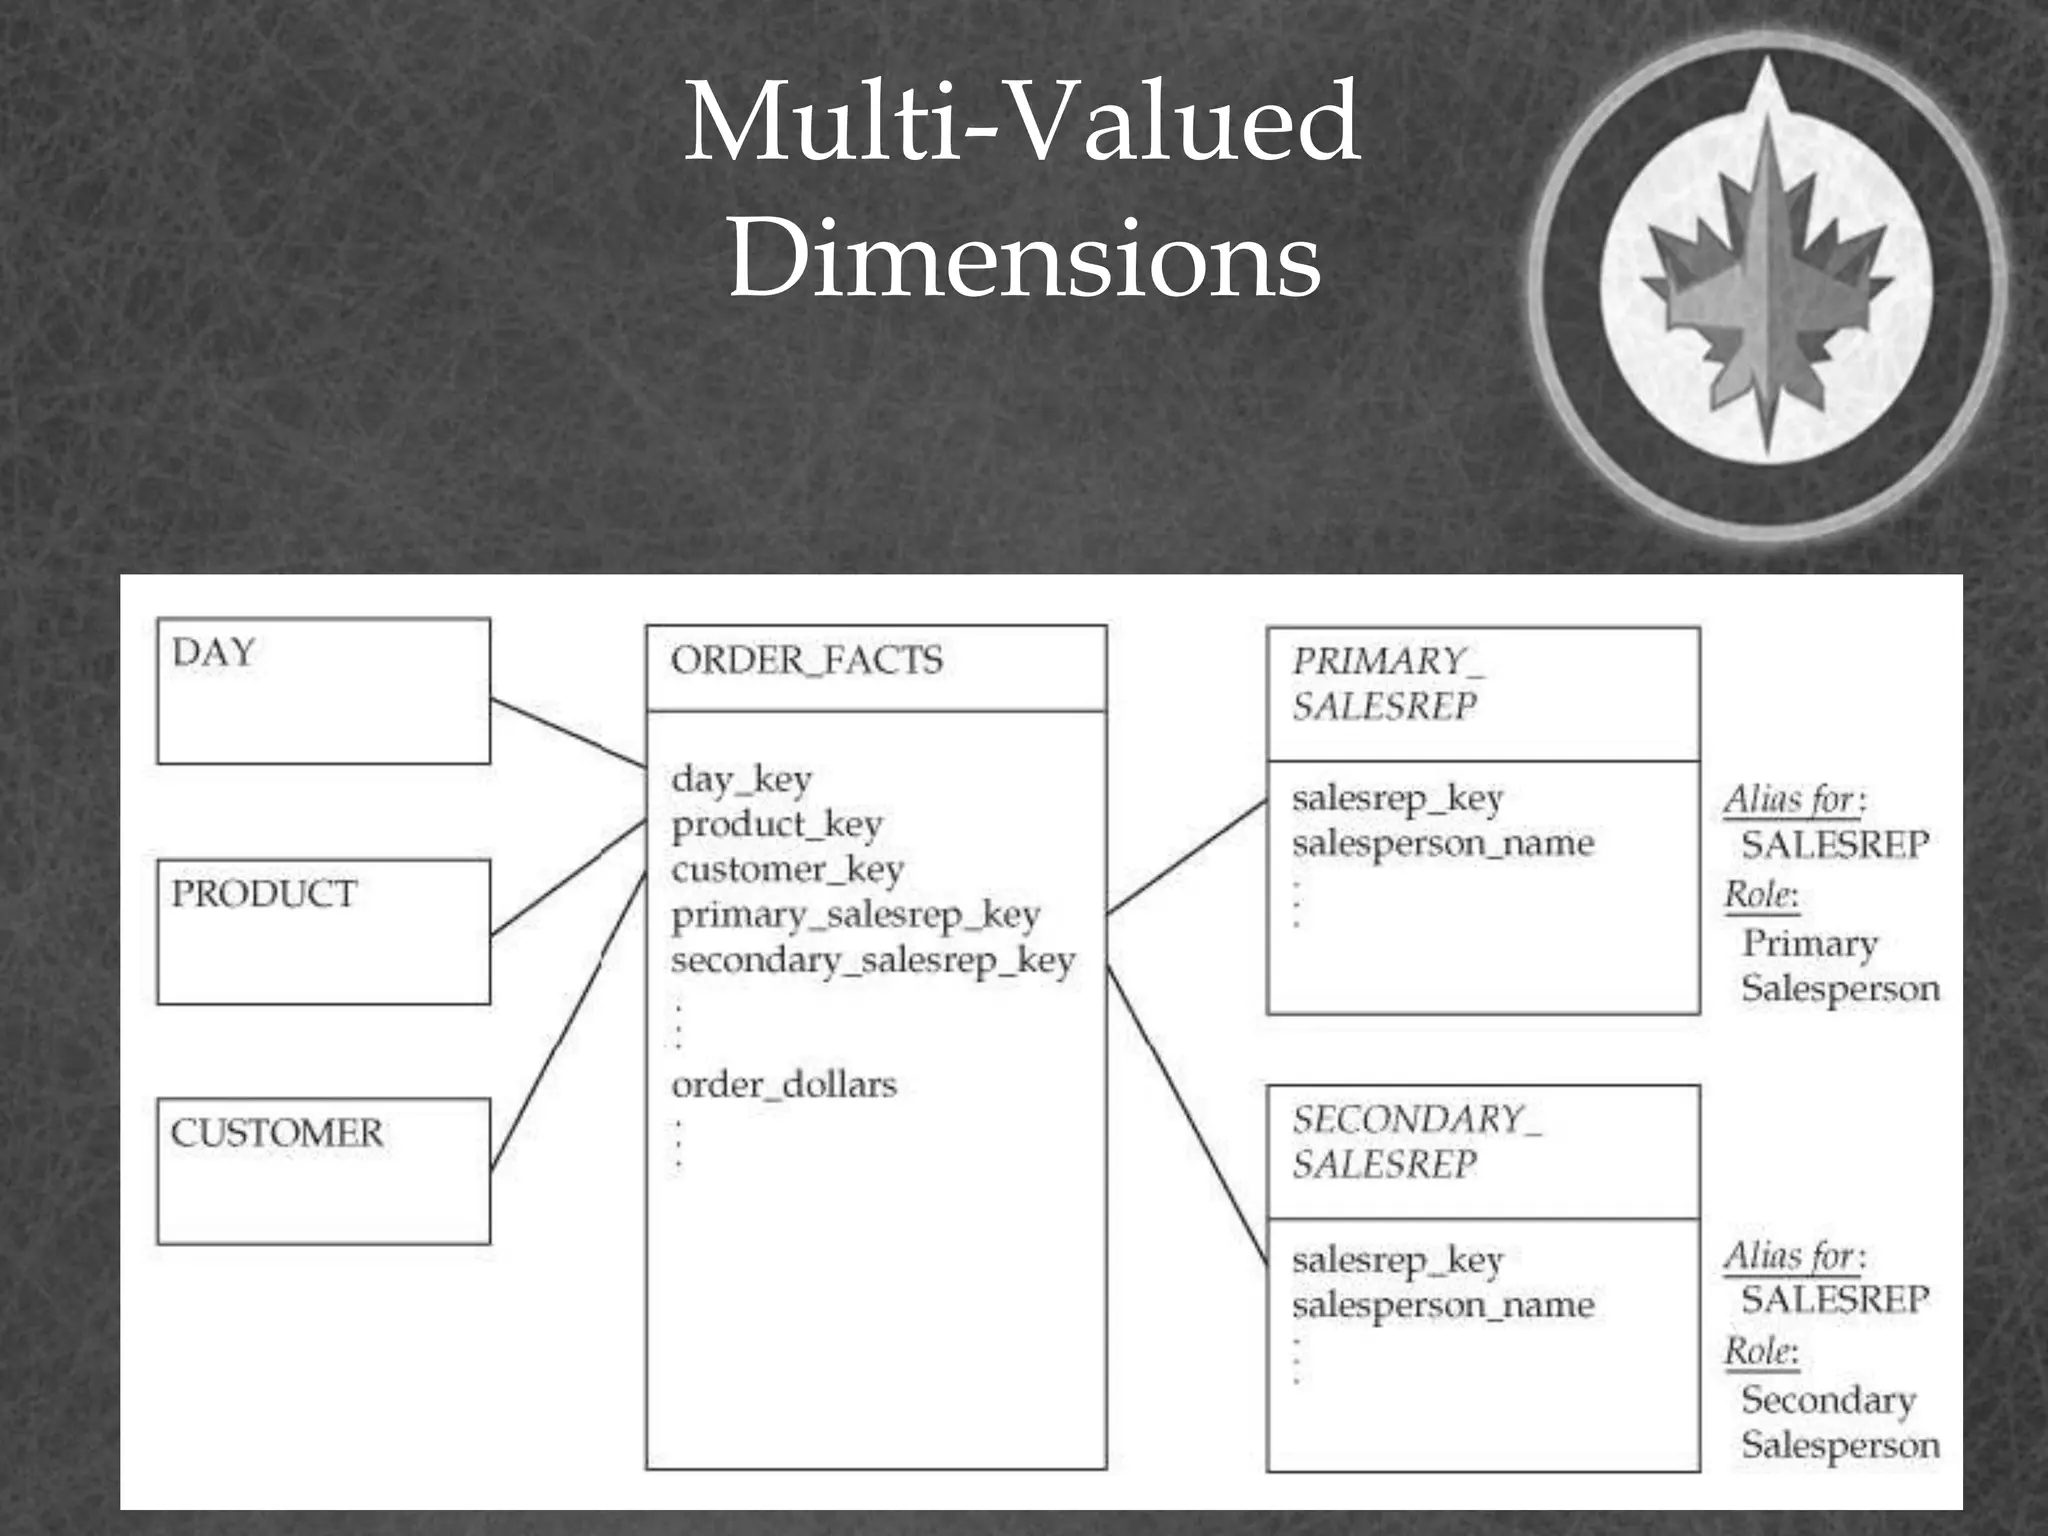
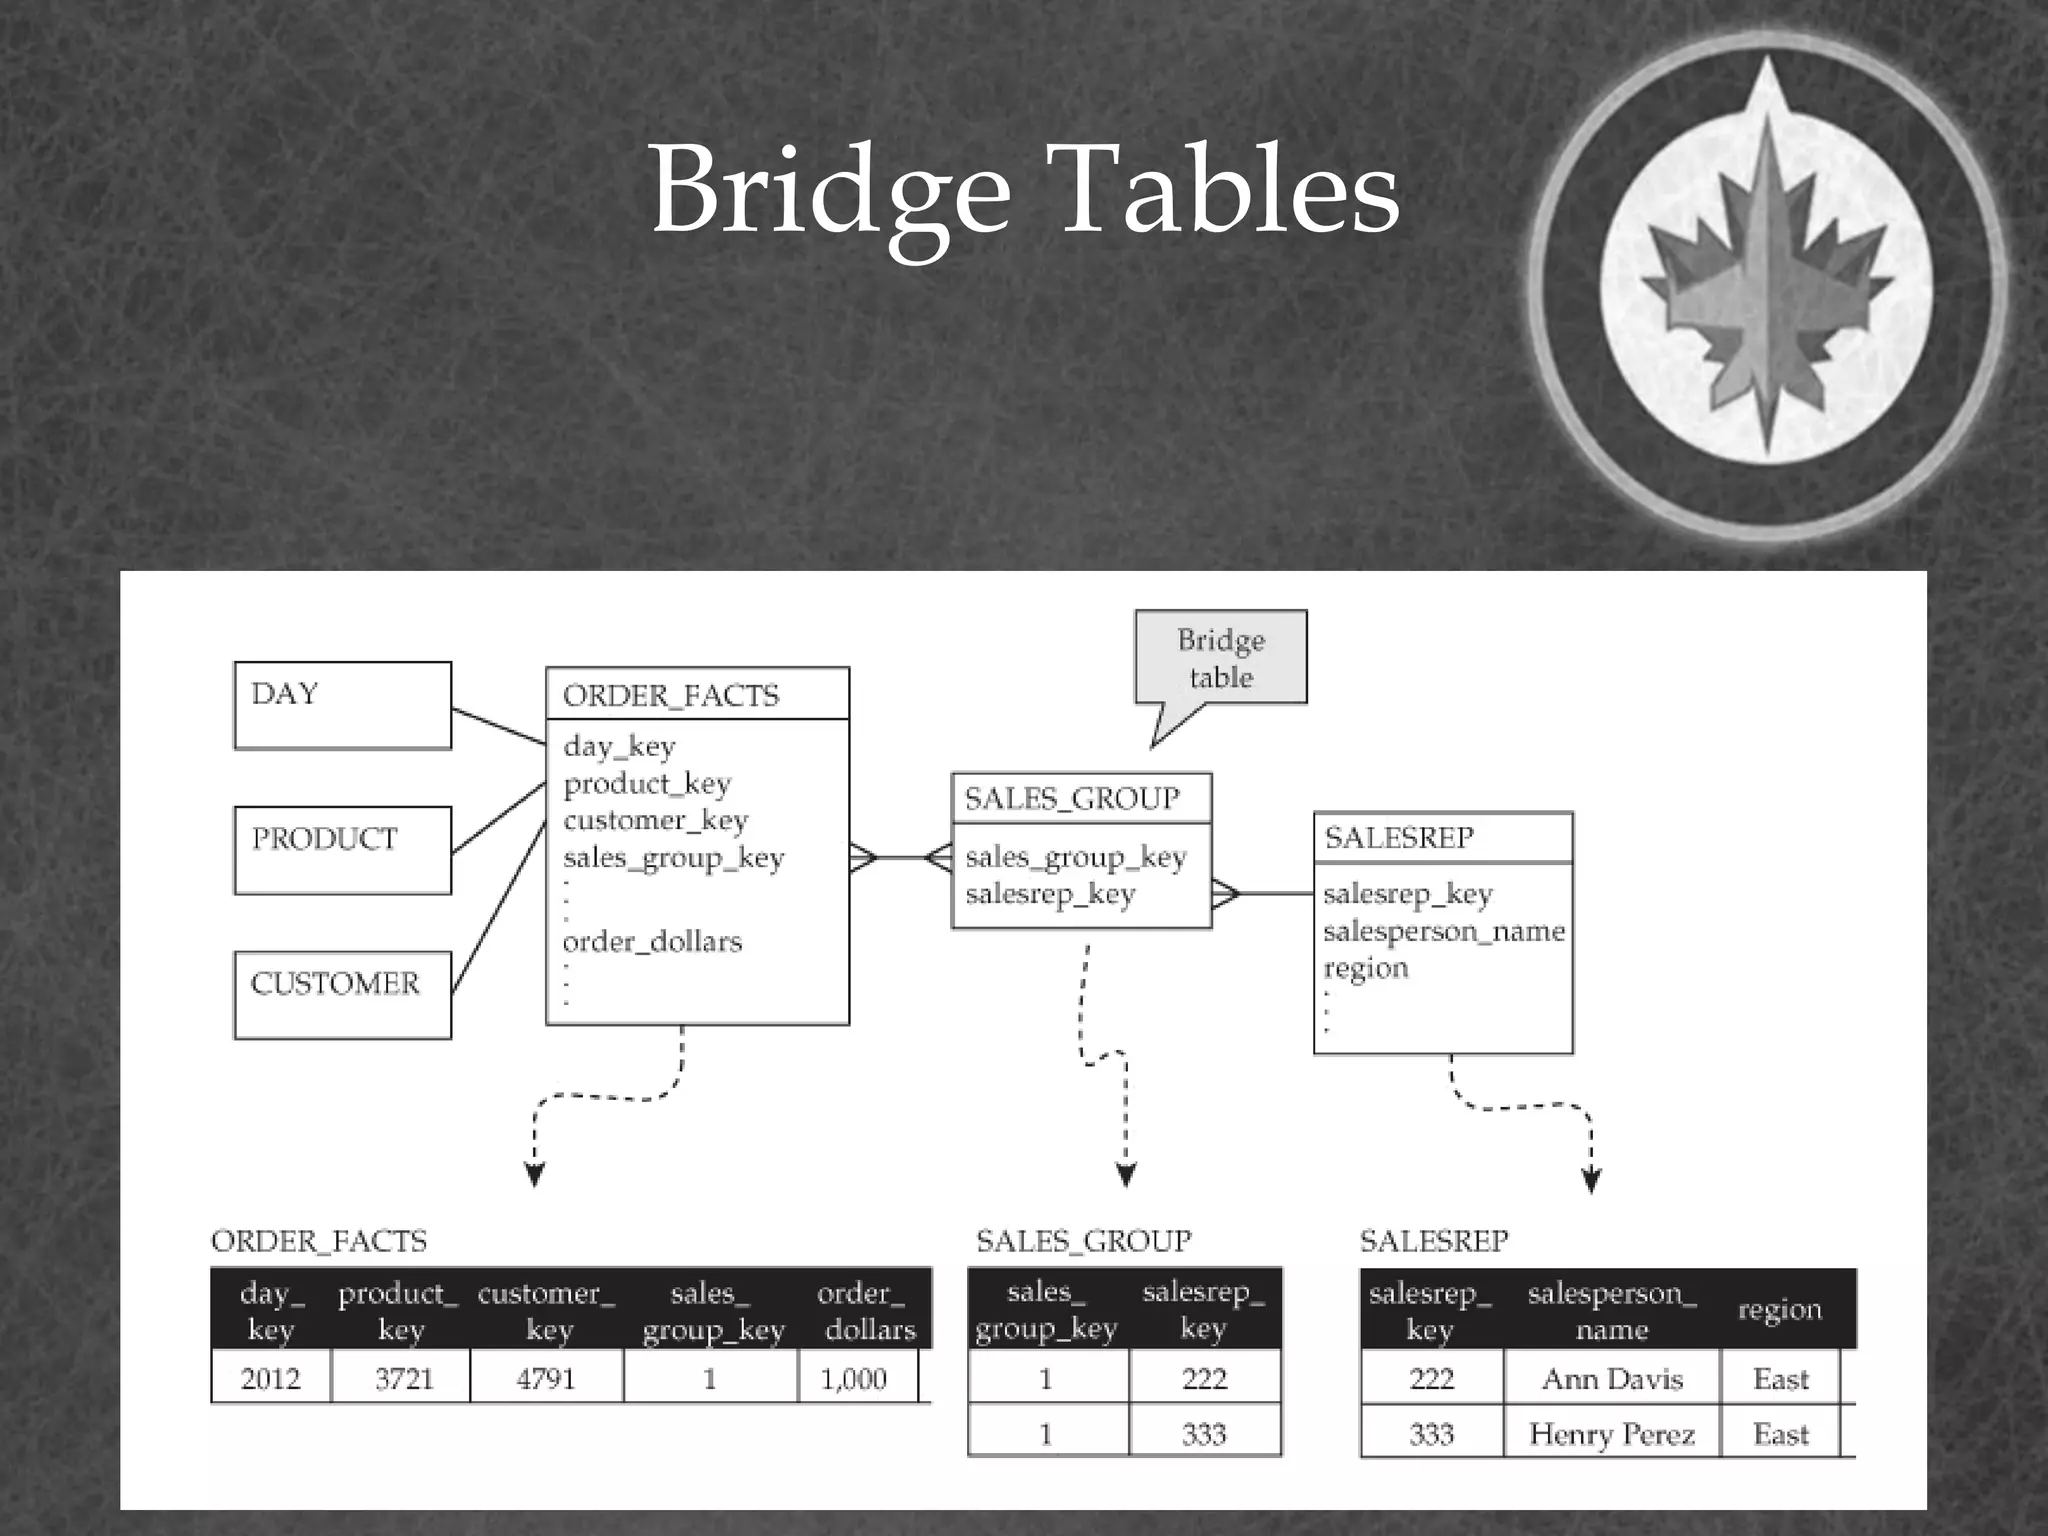
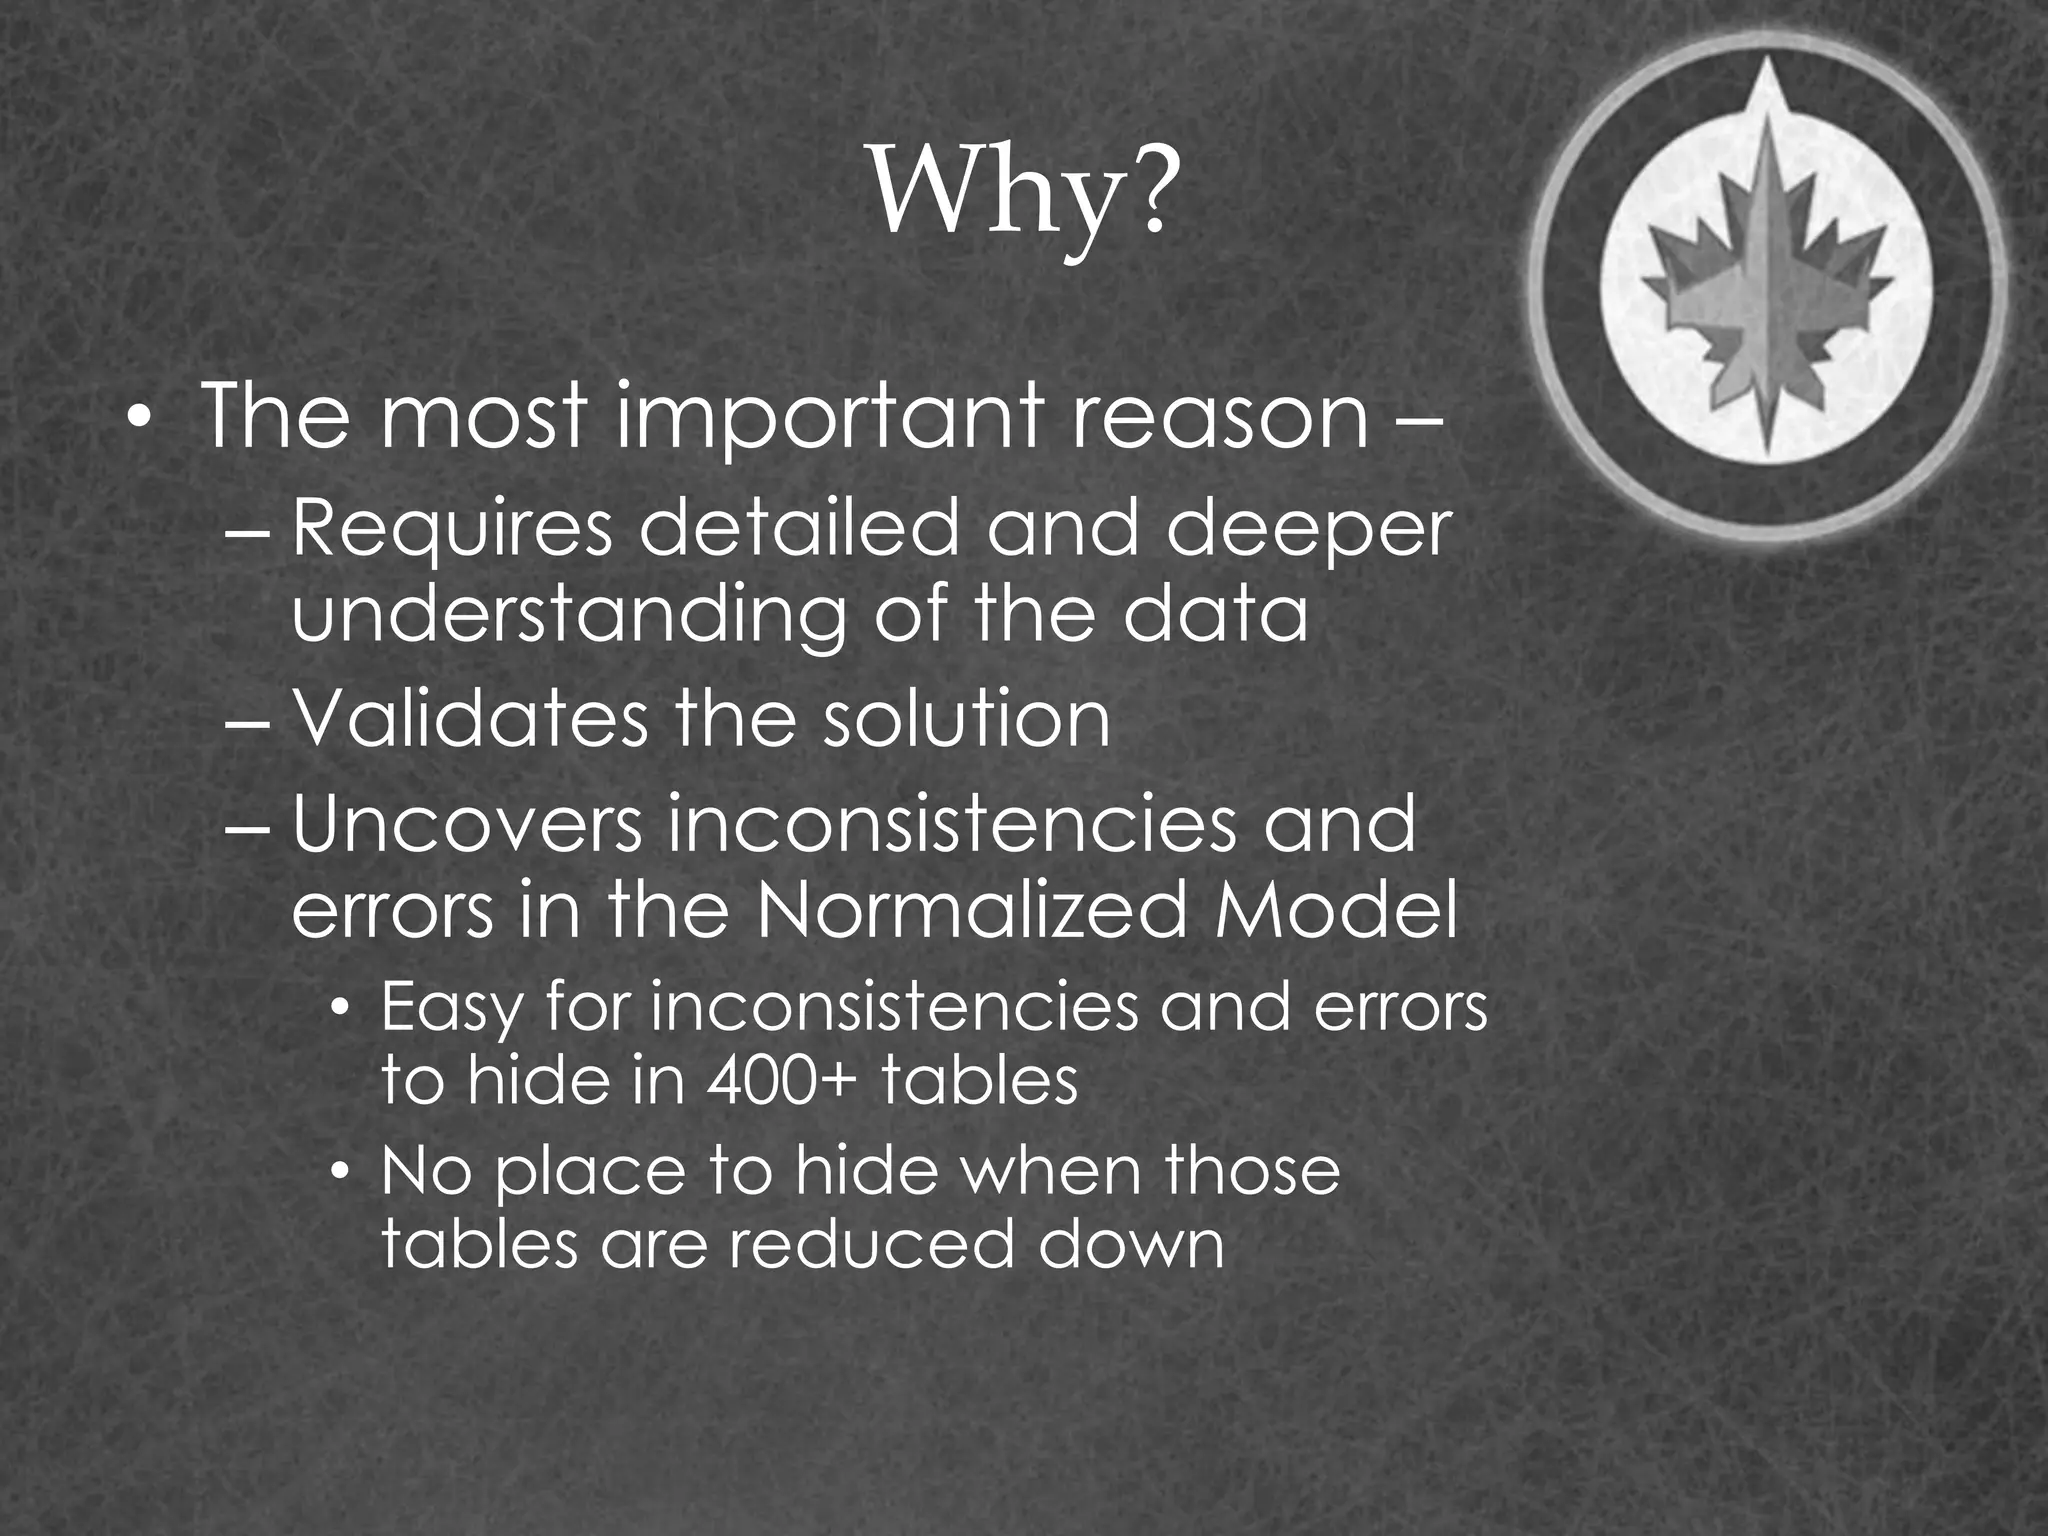
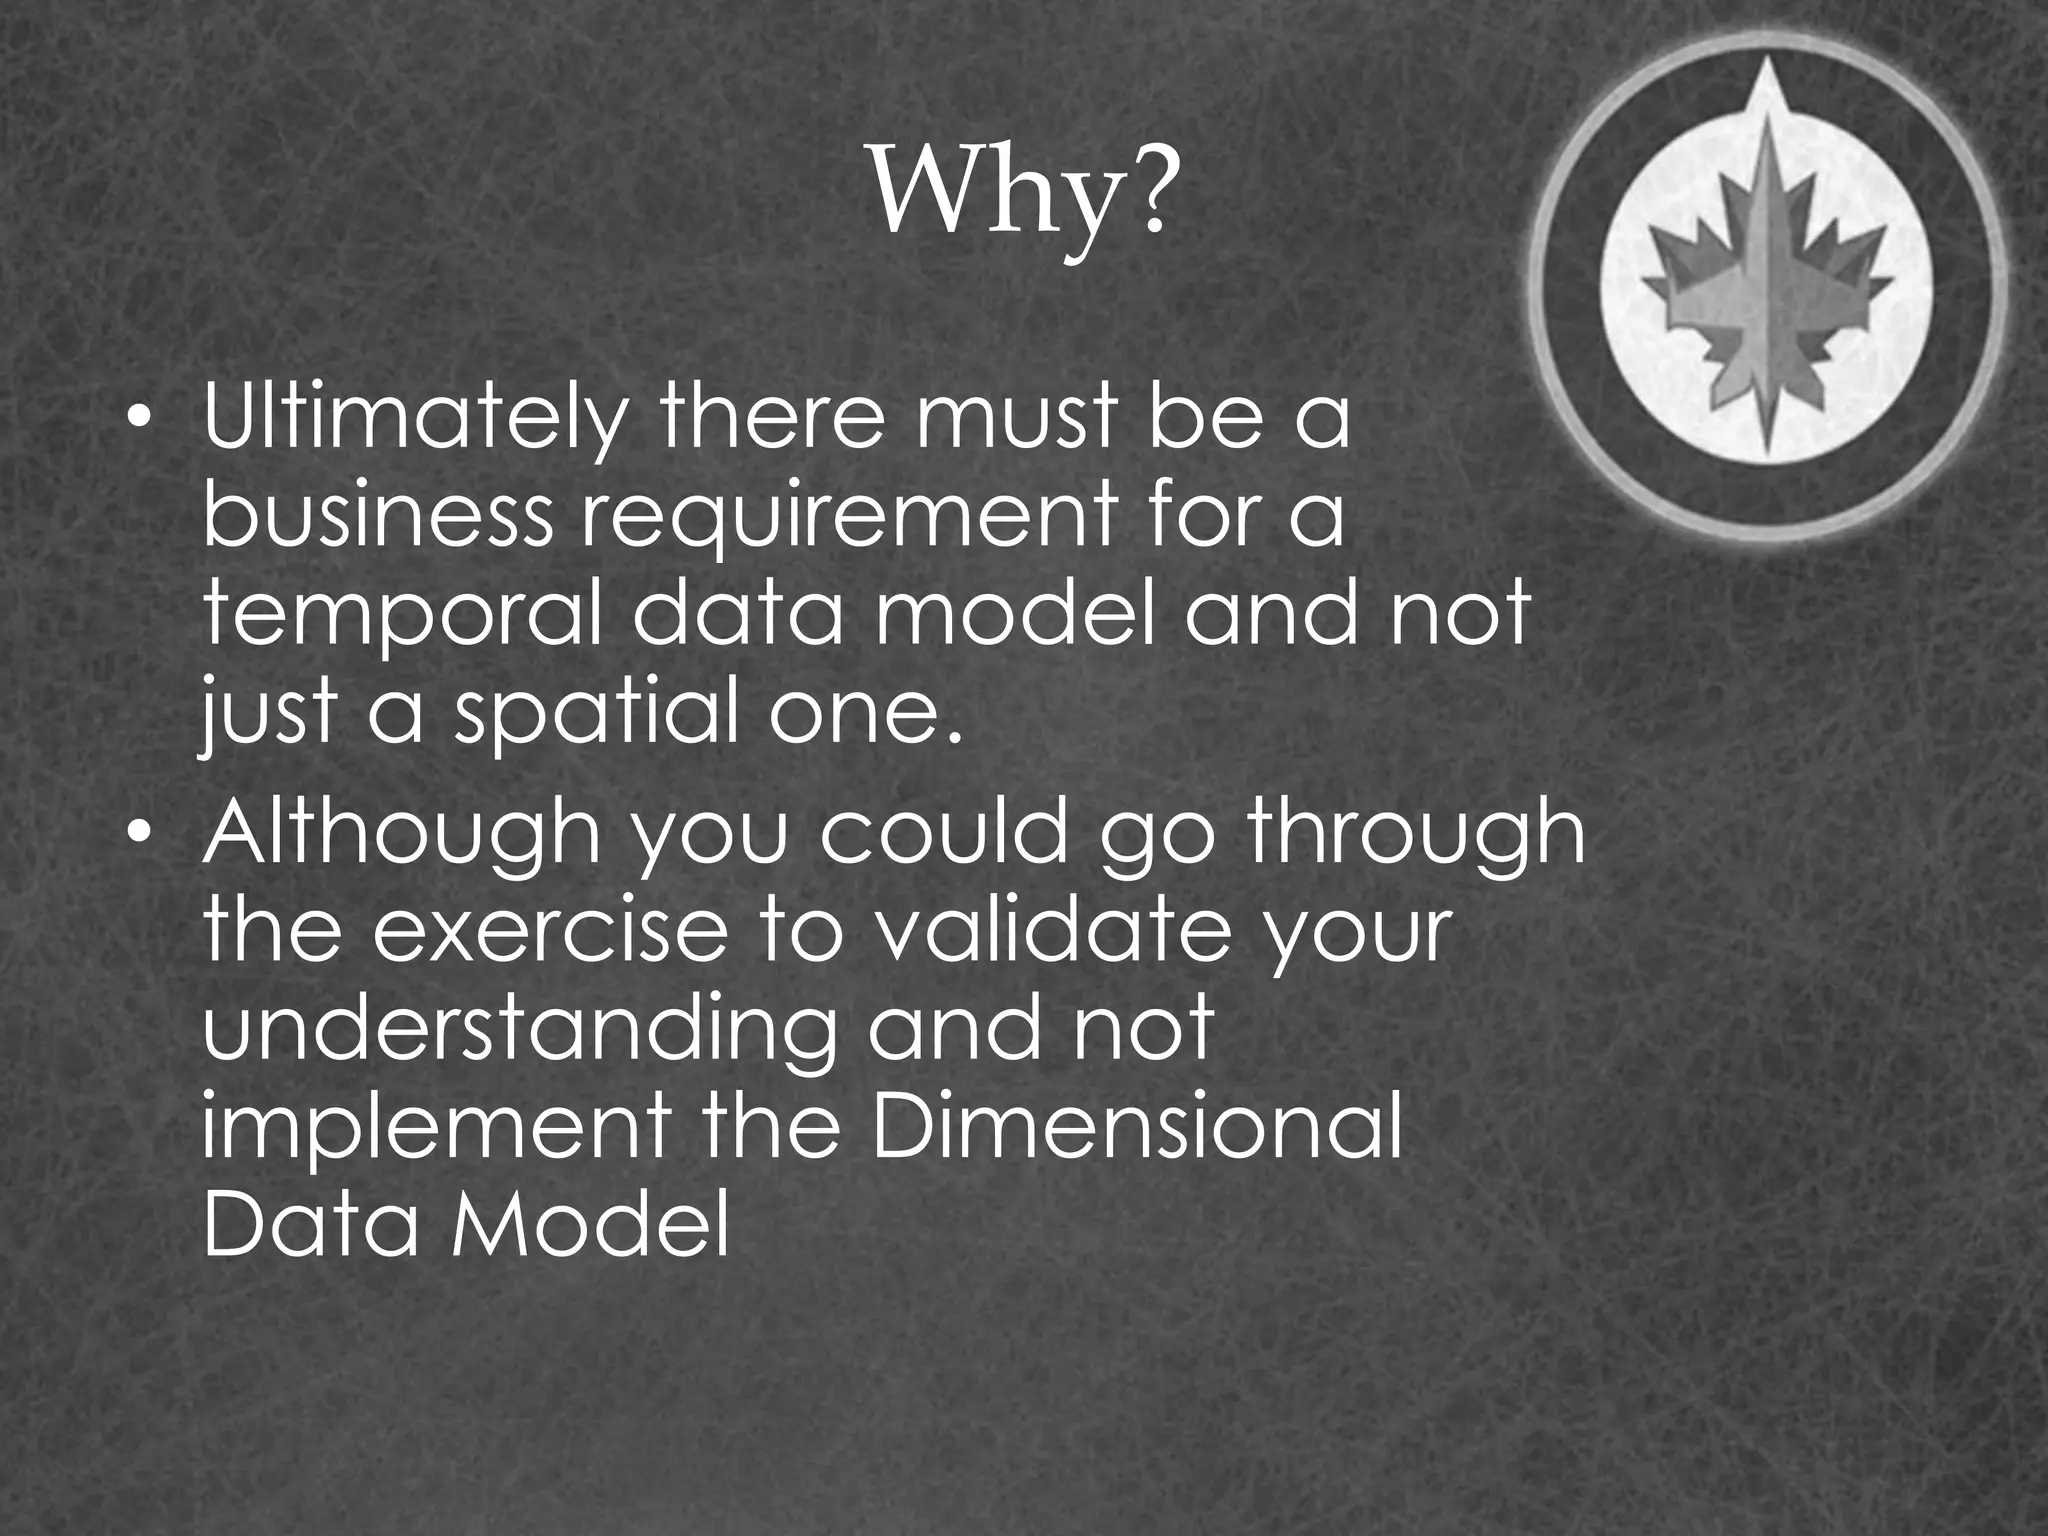
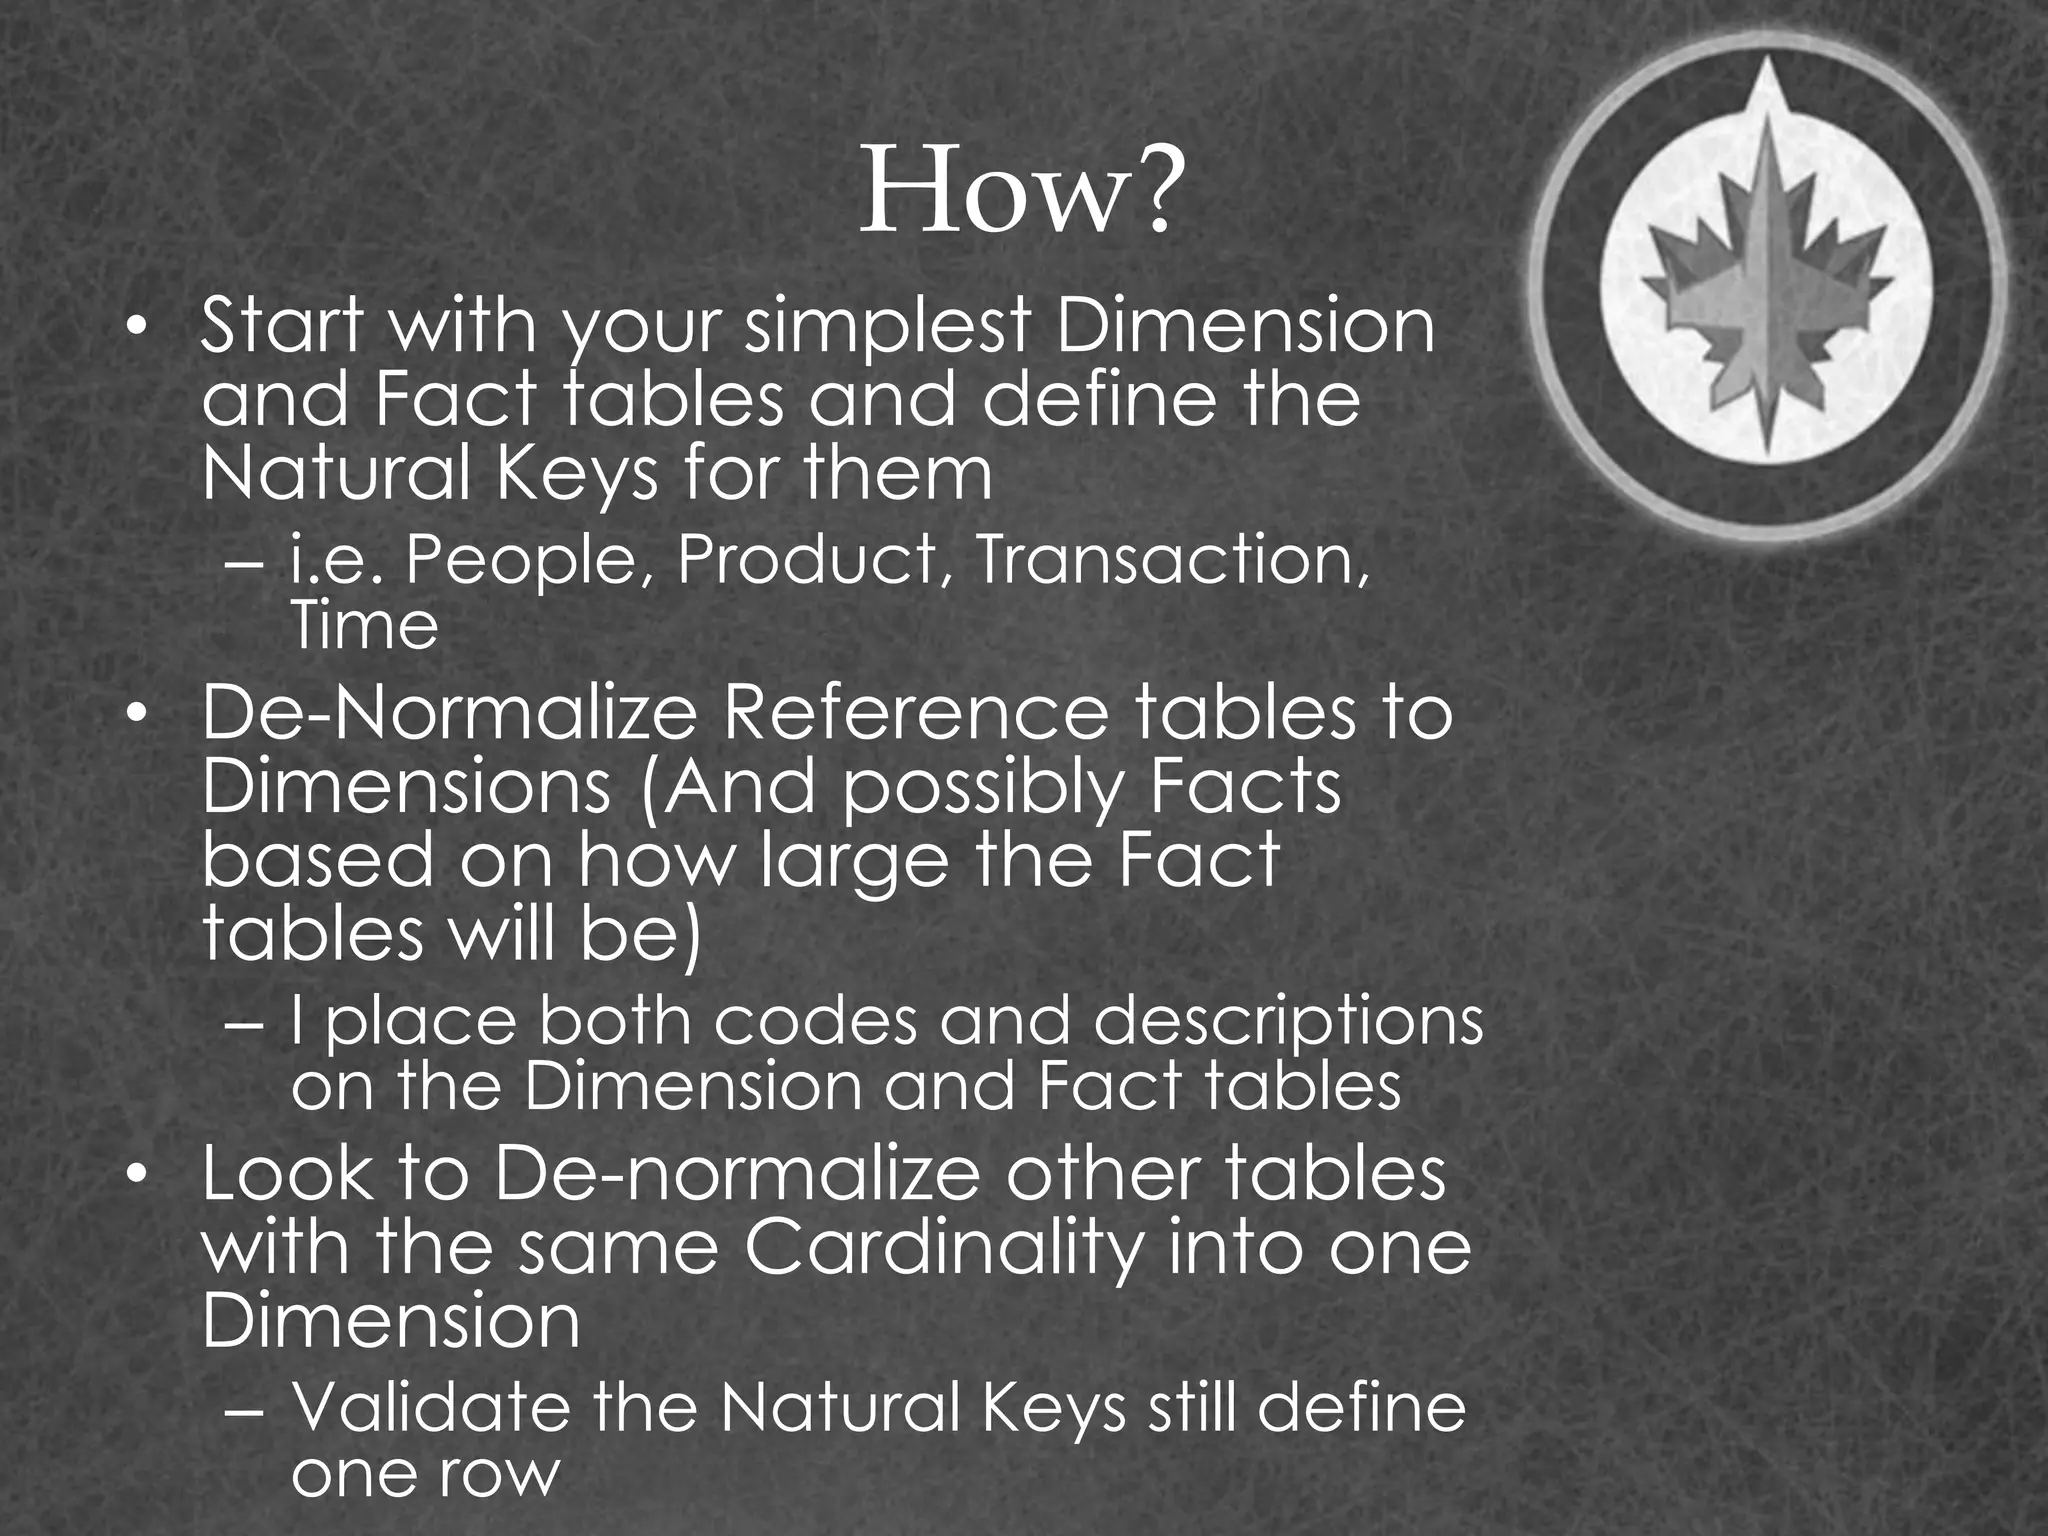
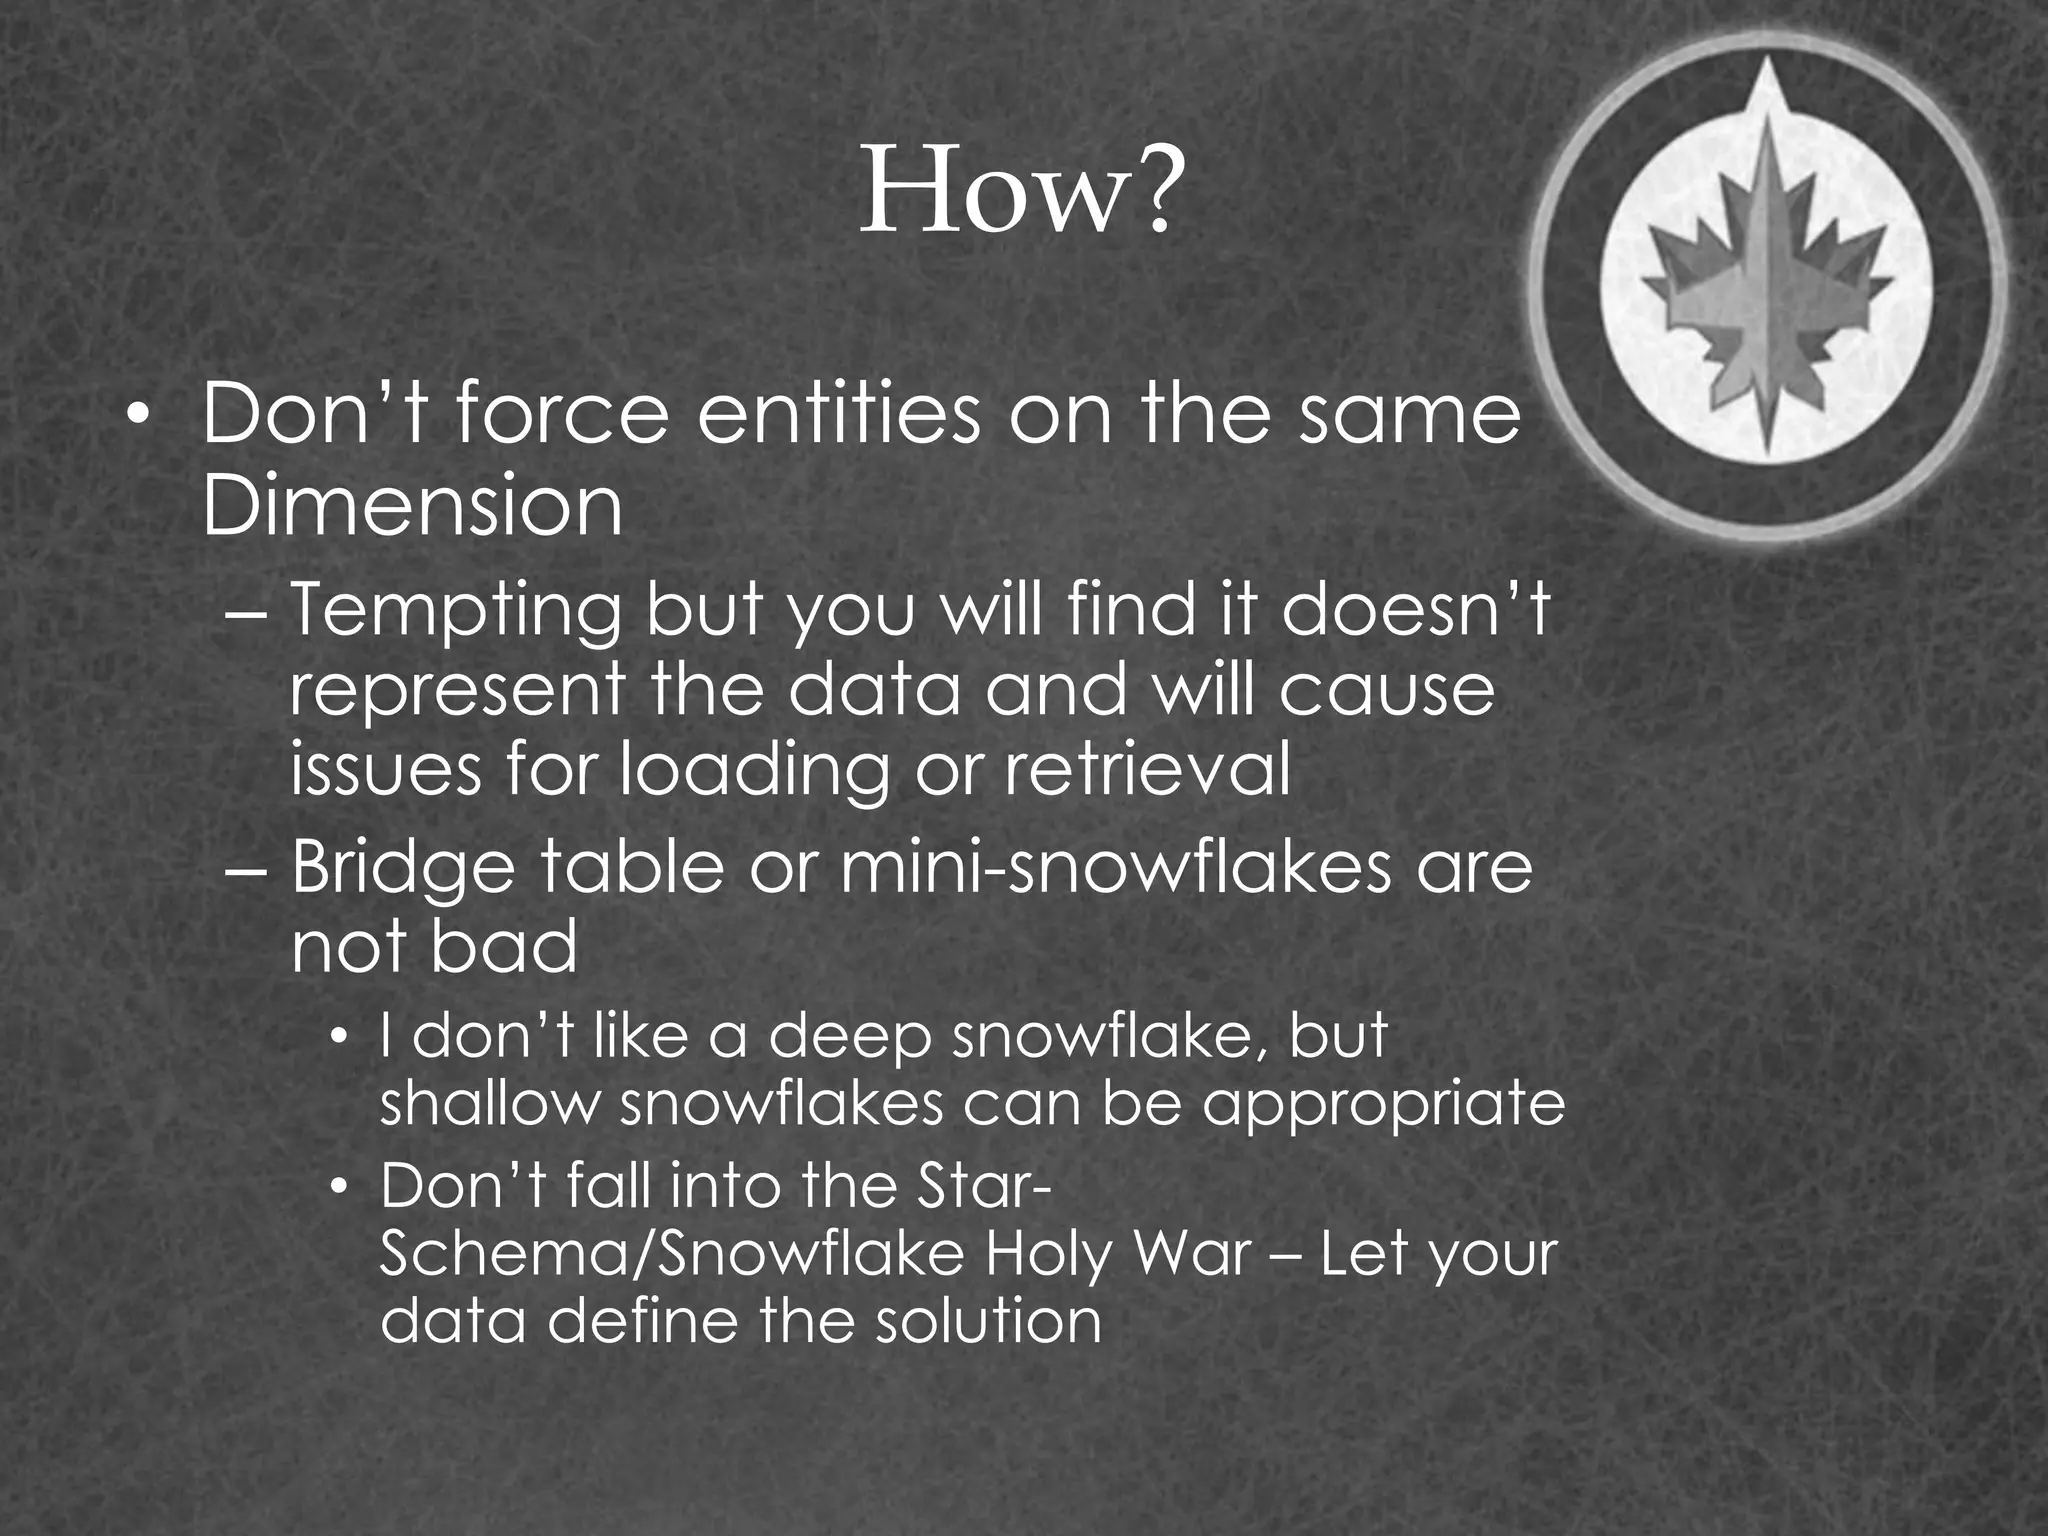
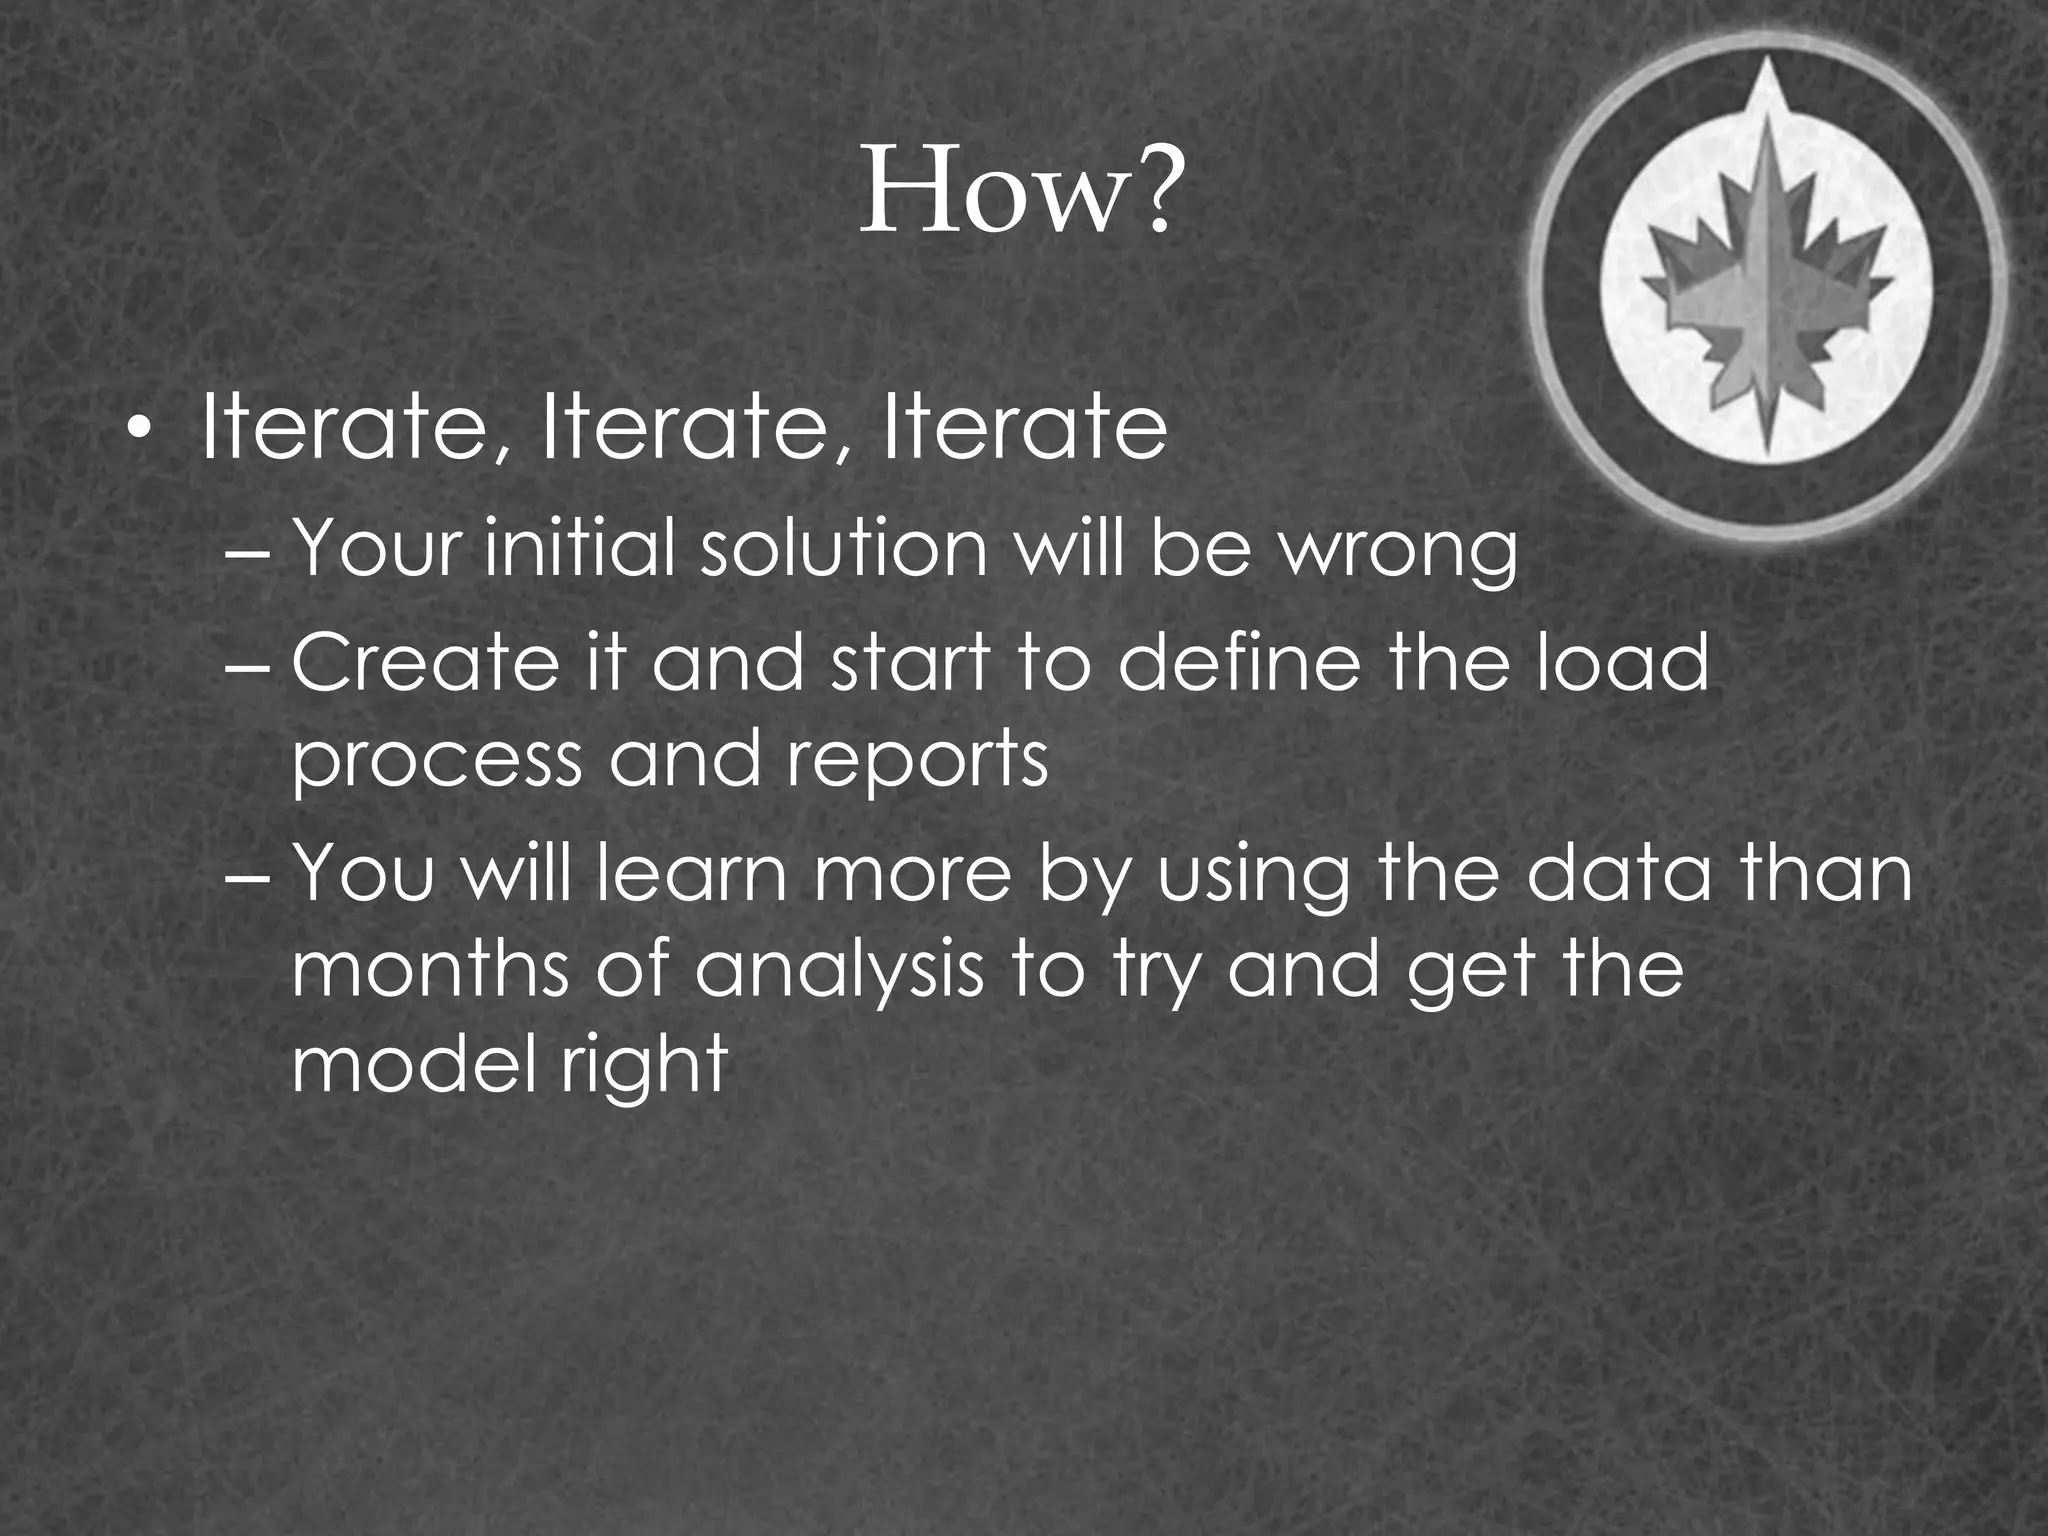
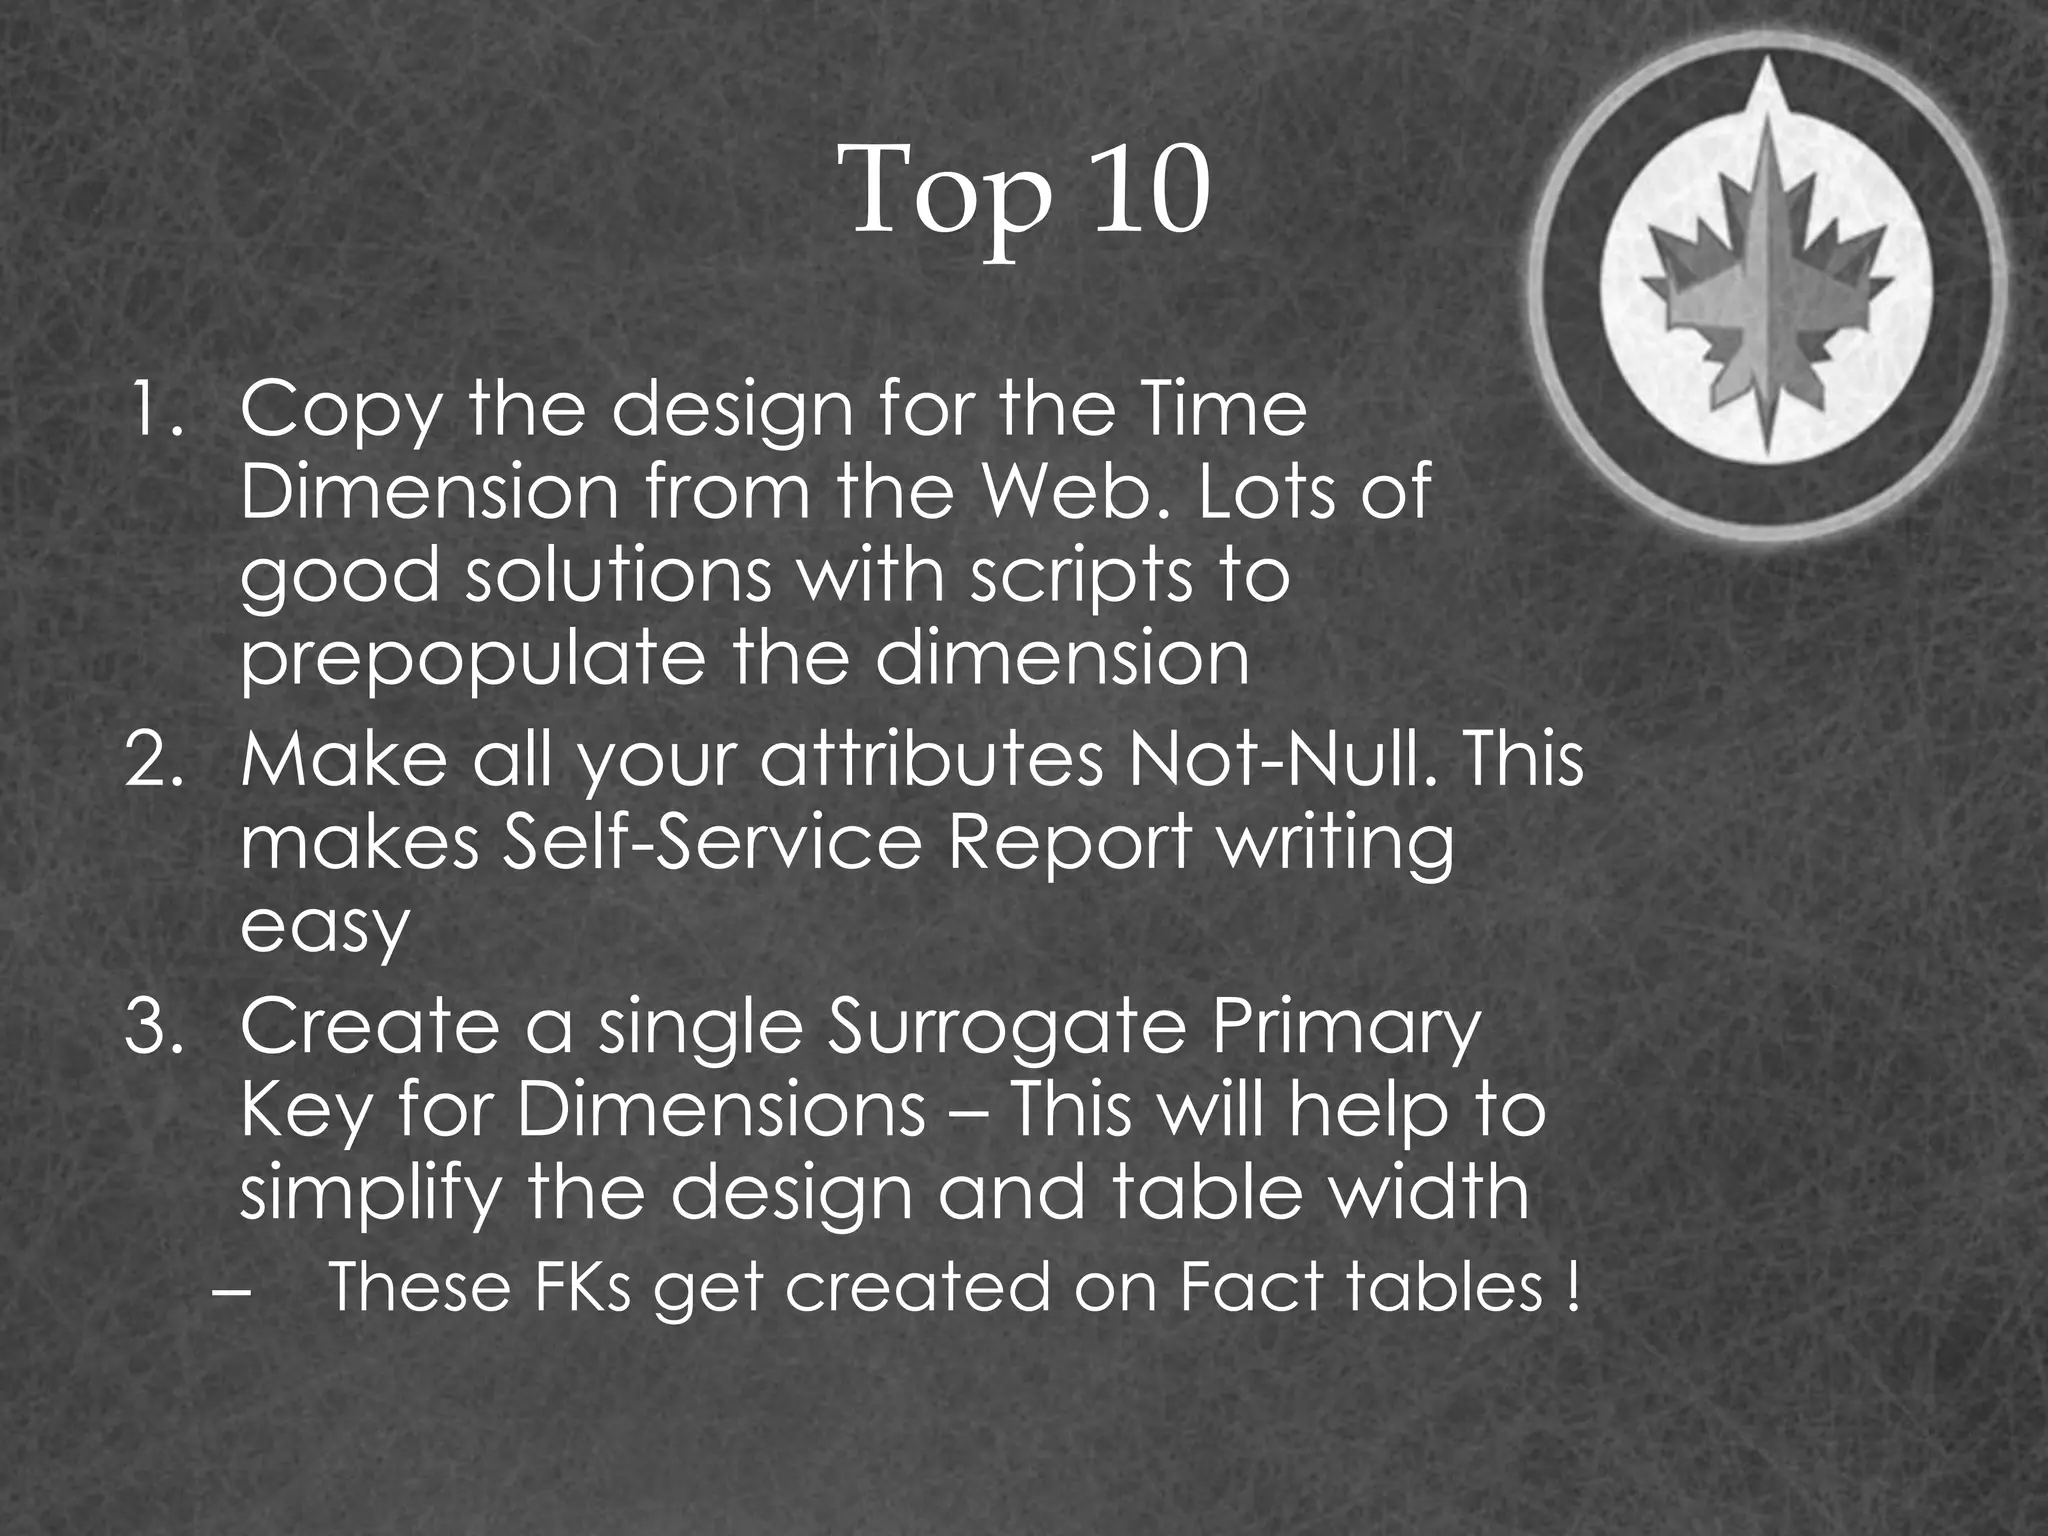
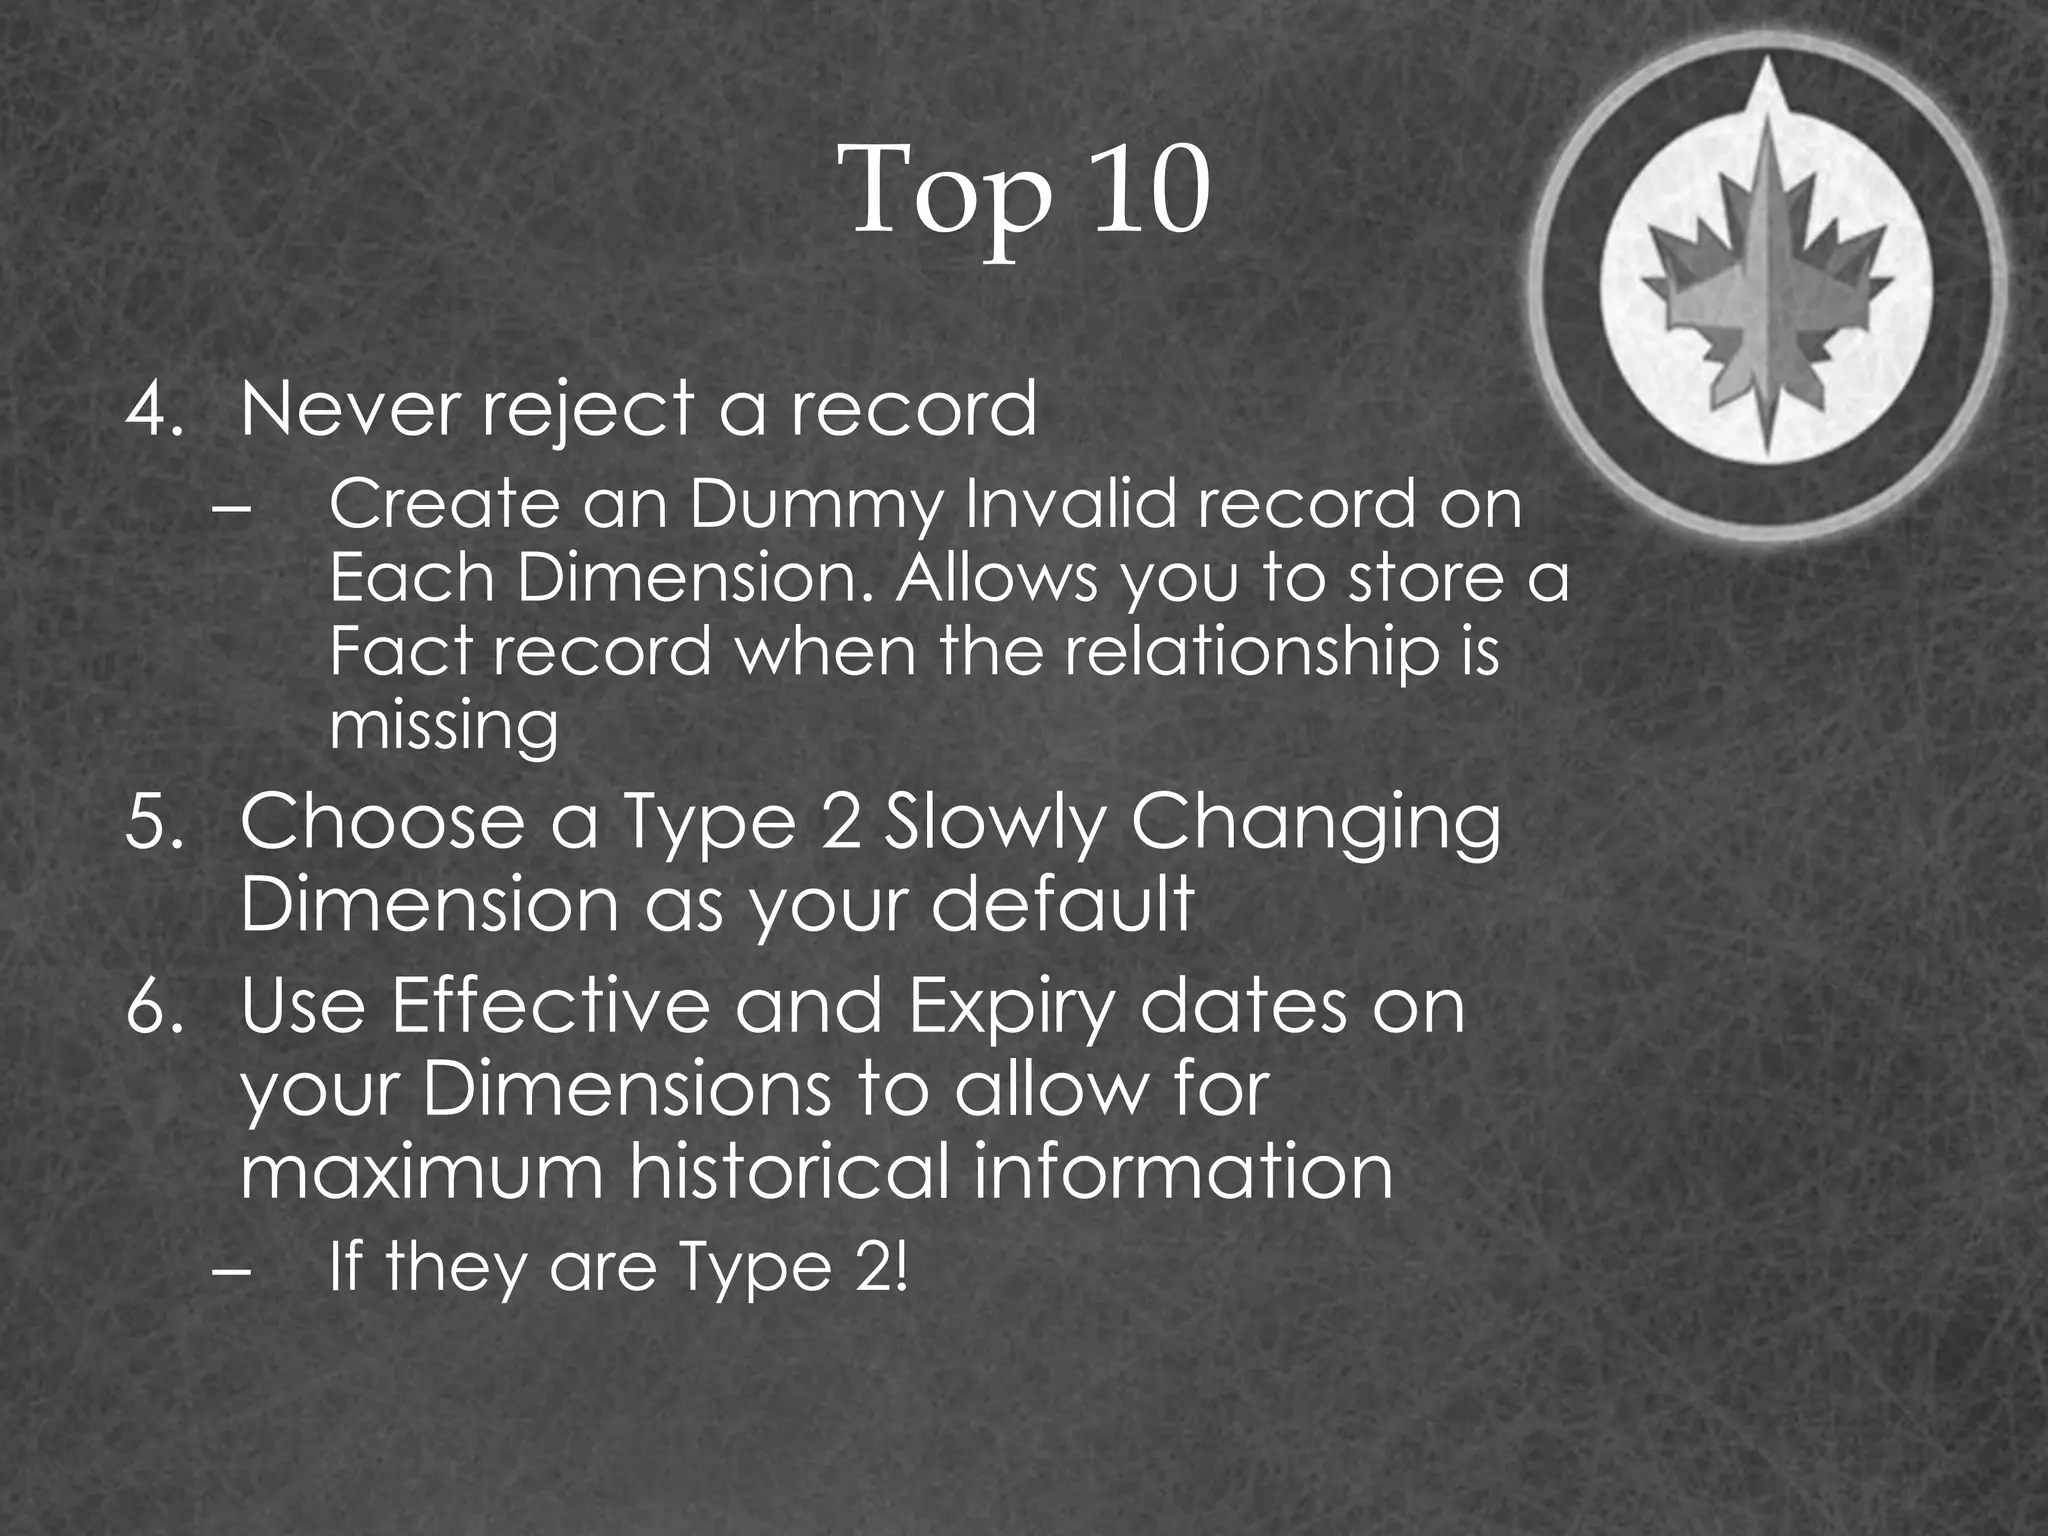
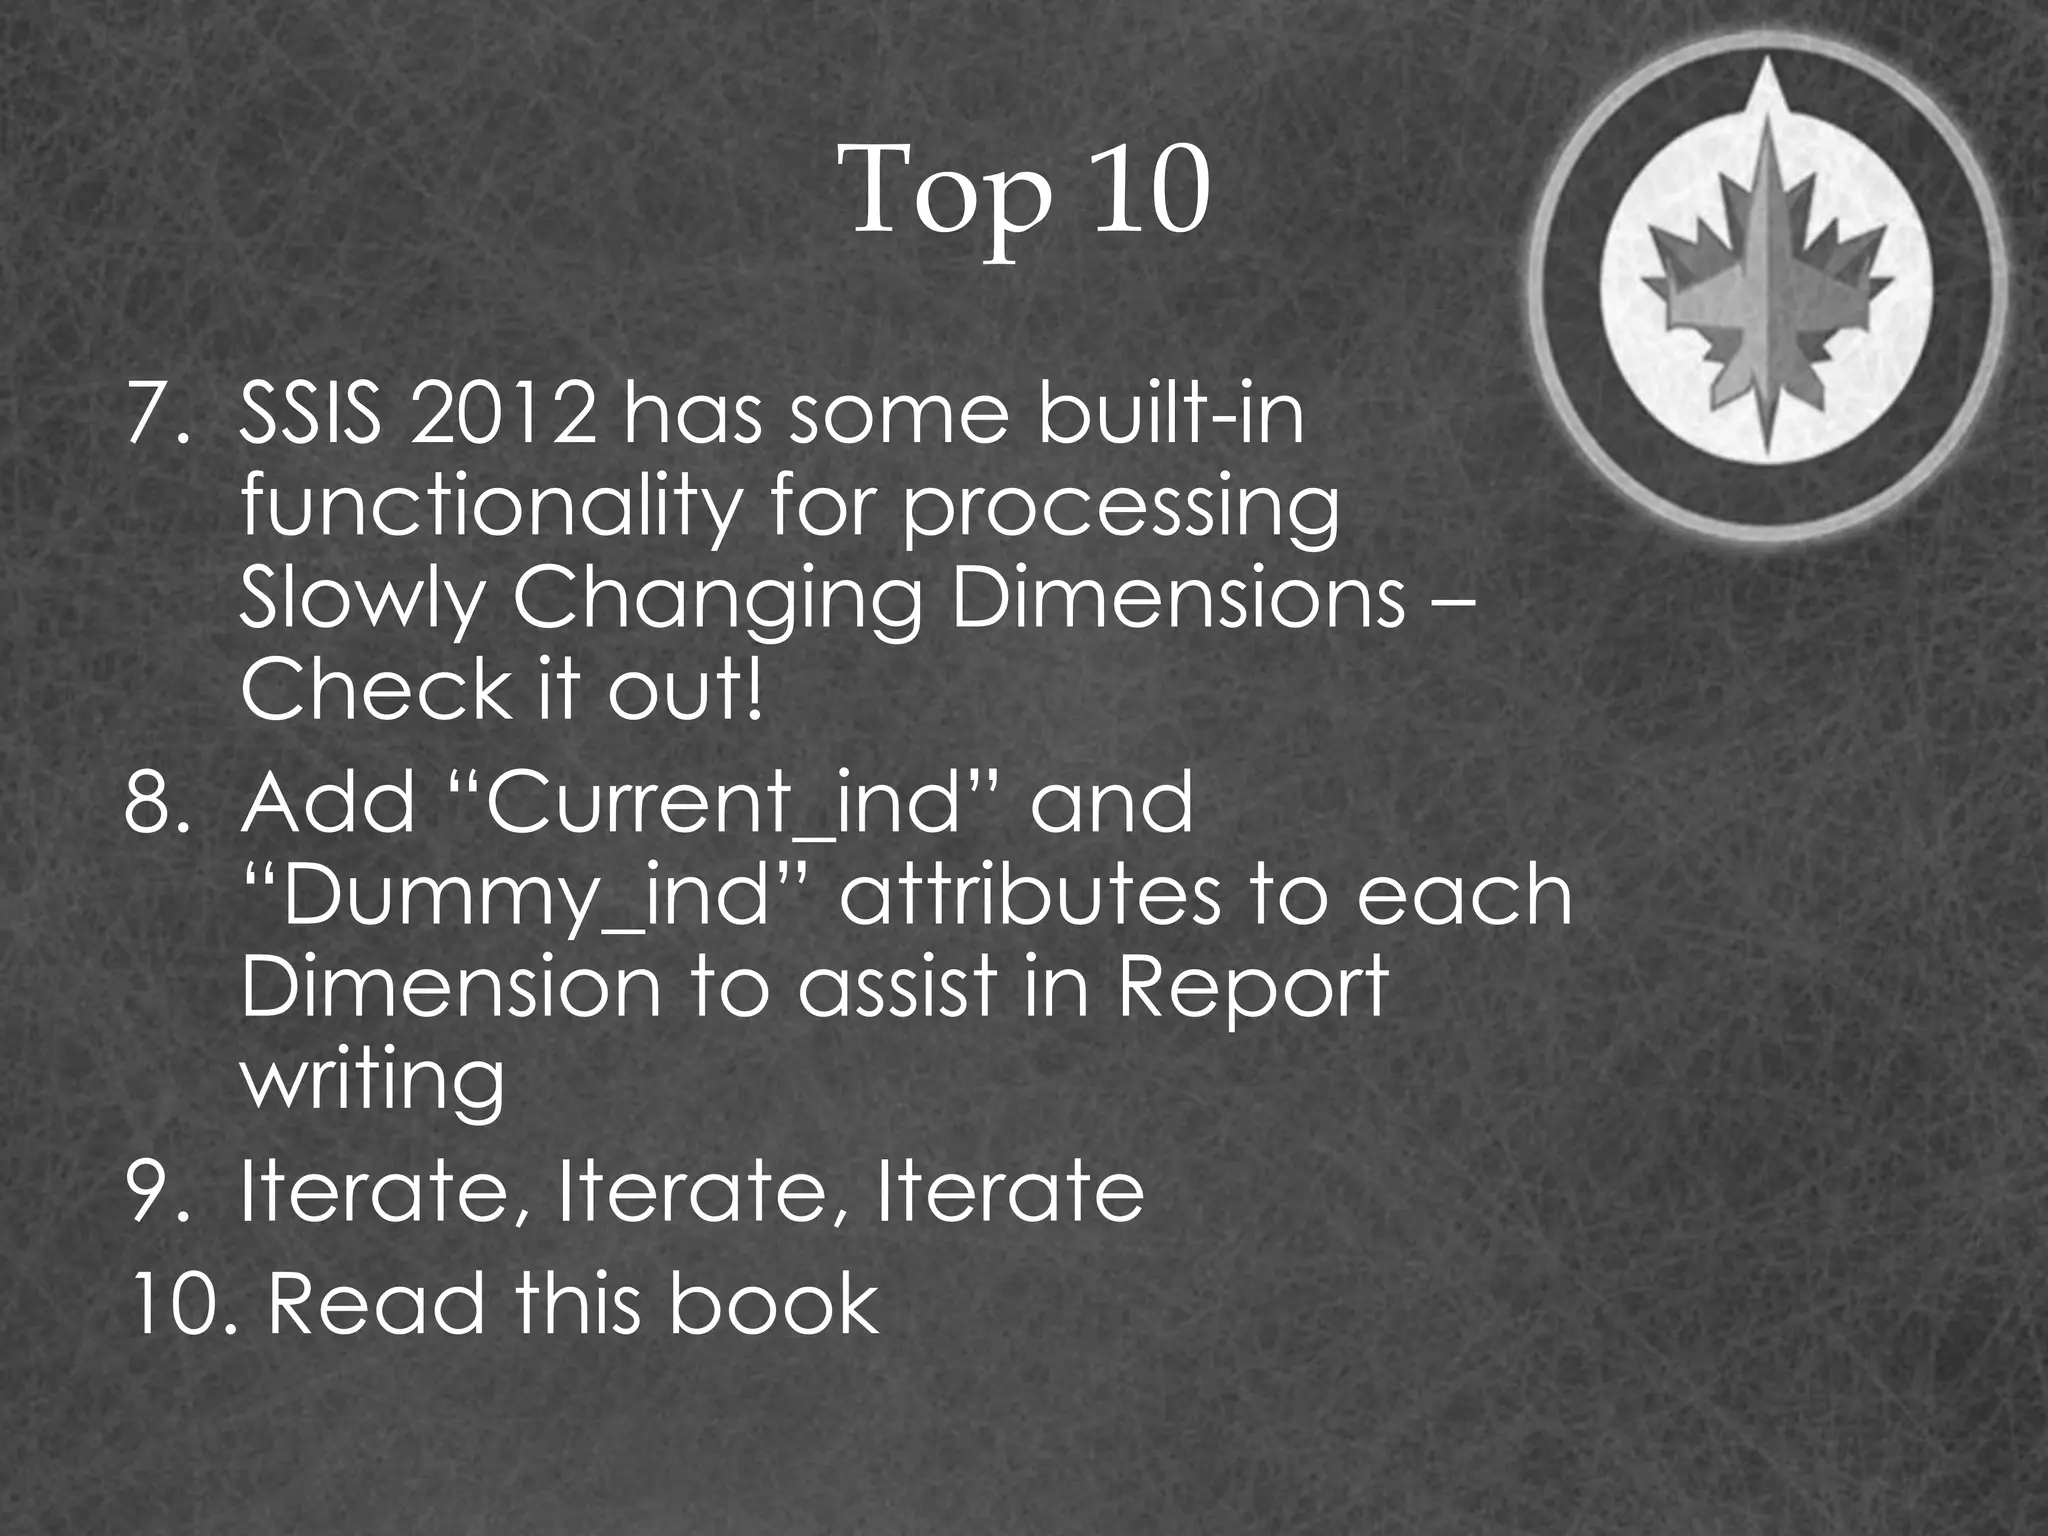
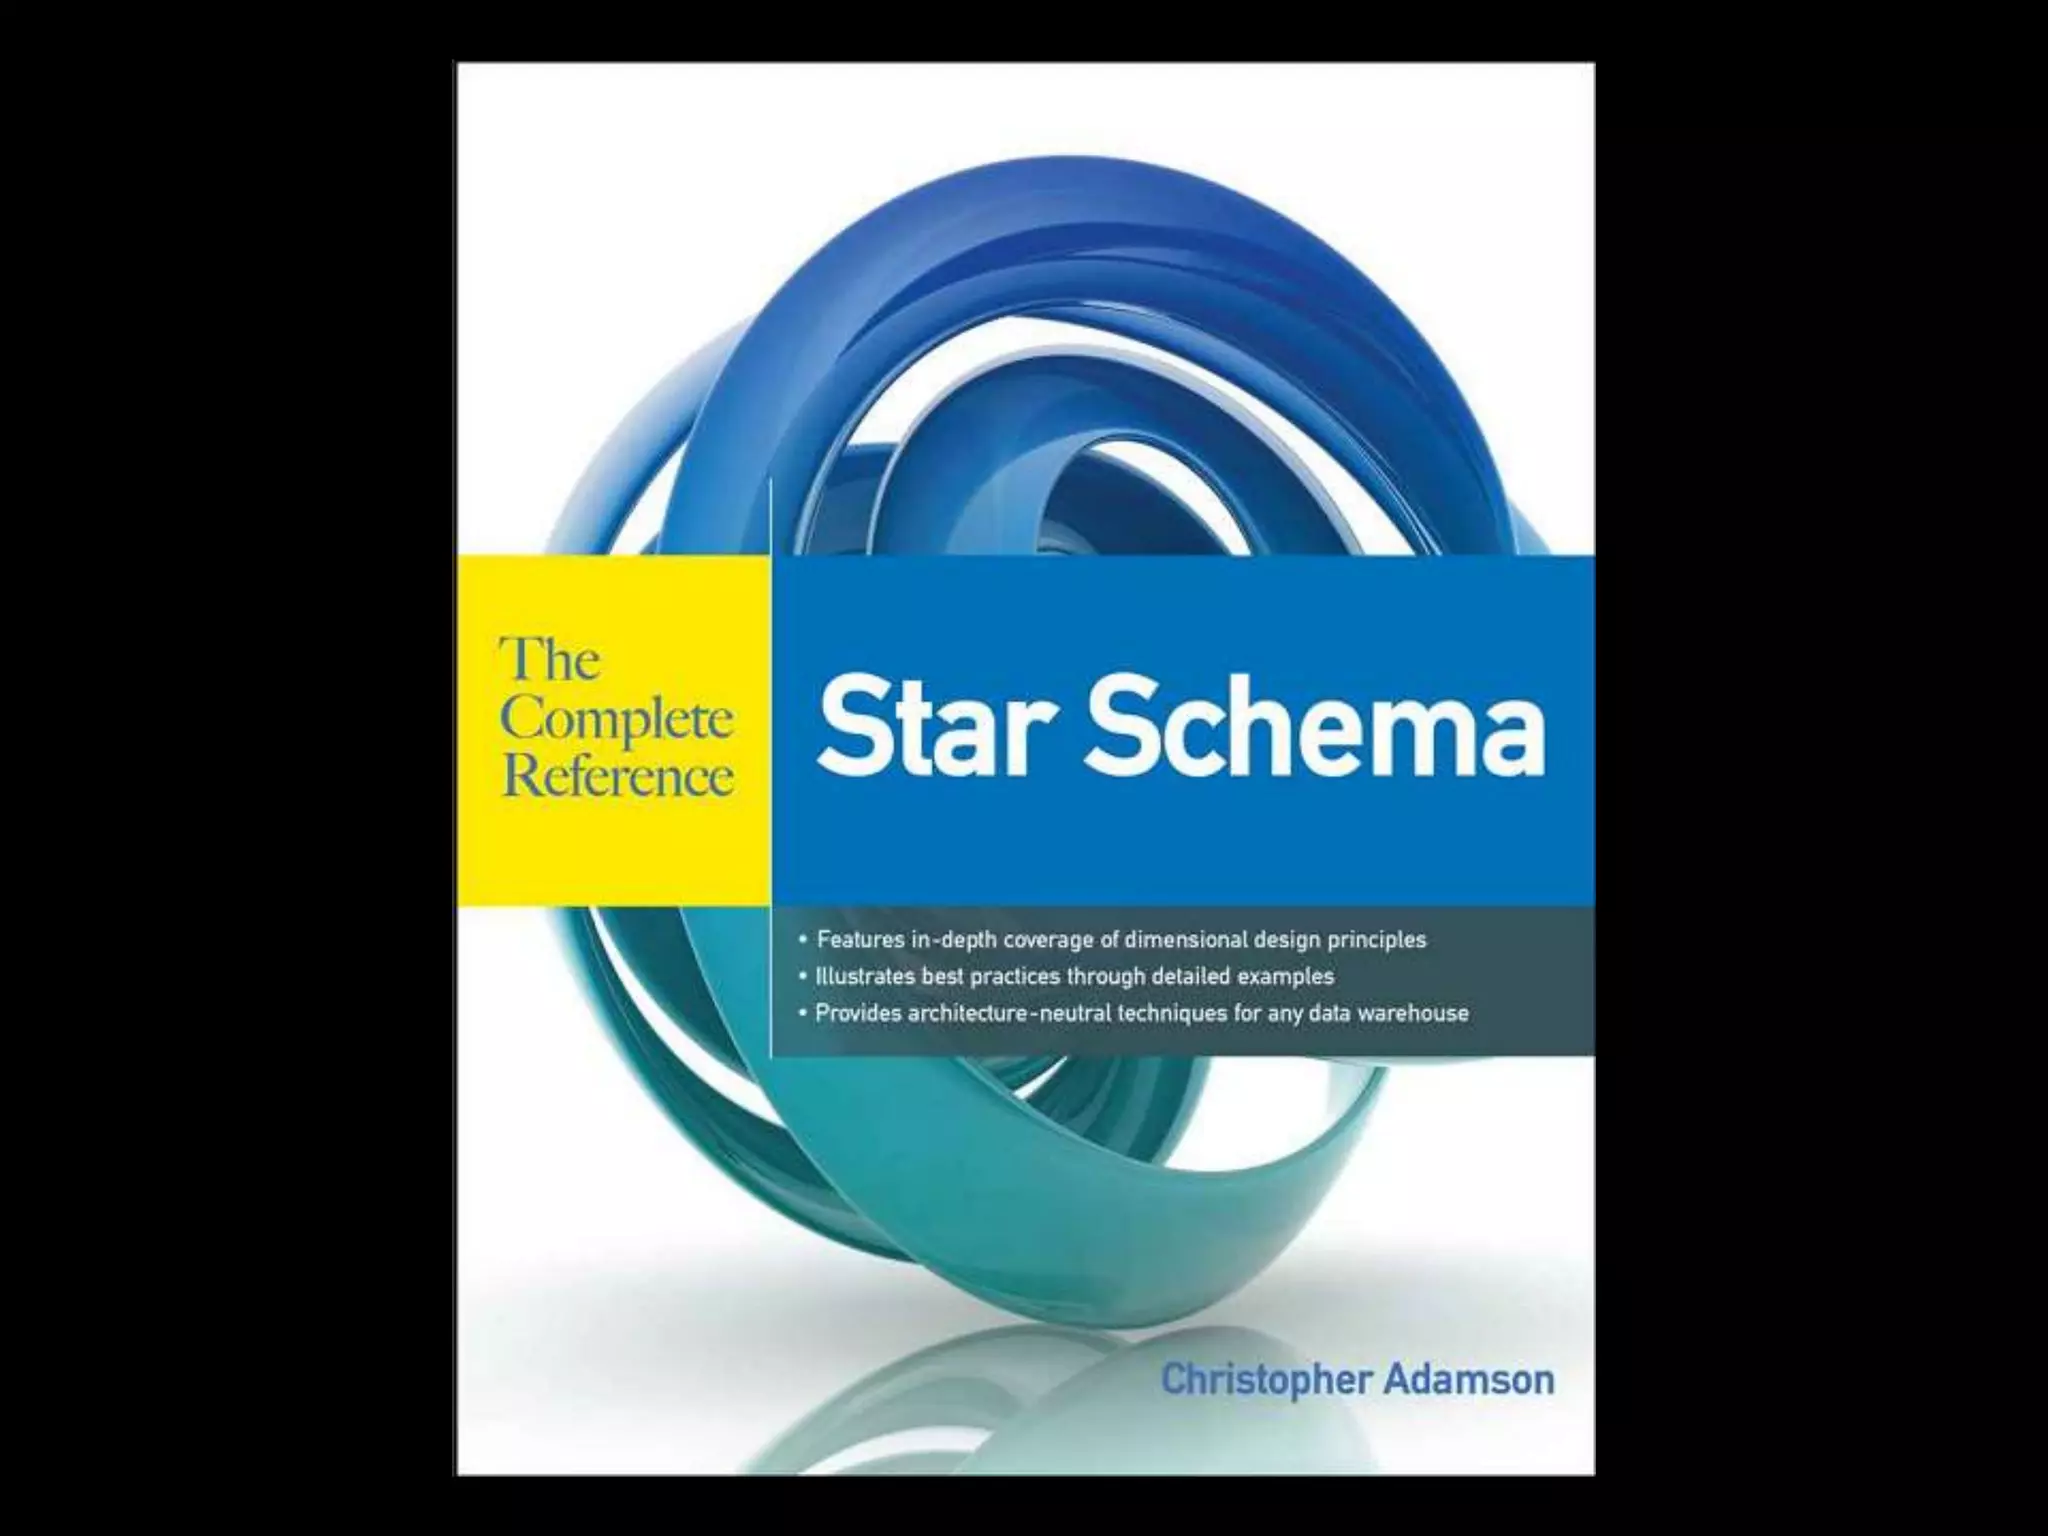
Dimensional Data Modeling
A Primer
SQL Saturday Madison – April 11,2015
@tbunio
tbunio@protegra.com
agilevoyageur.wordpress.com
www.protegra.com
Who Am I?
• Terry Bunio
• Data Base Administrator
– Oracle
– SQL Server 6,6.5,7,2000,2005,2008,2012
– Informix
– ADABAS
• Data Modeler/Architect
– Investors Group, LPL Financial, Manitoba Blue
Cross, Assante Financial, CI Funds, Mackenzie
Financial
– Normalized and Dimensional
• Agilist
– Innovation Gamer, Team Member, SQL
Developer, Test writer, Sticky Sticker, Project
Manager, PMO on SAP Implementation
Previous SQL
Saturday Presentations
• SQL Sat Winnipeg 2014
– Breaking Data – Stress test using Ostress
• SQL Sat Madison/Minneapolis 2014
– A data driven ETL test framework
• SQL Sat Minneapolis 2013
– Agile Data Warehouse
• SQL Sat Fargo 2013
– SSRS and SharePoint – there and back again
www.agilevoyageur.com
Agenda
• Data Modeling
– #1 mistake In Data Modeling
• Database Design Methods
• Dimensional concepts
– Facts
– Dimensions
• Complex Concept Introduction
• Why and How?
• My Top 10 Dimensional Modeling
Recommendations
Definition
• “A database model is a
specification describing how a
database is structured and
used” – Wikipedia
Definition
• “A data model describes how
the data entities are related to
each other in the real world” –
Terry (5 years ago)
• “A data model describes how
the data entities are related to
each other in the application” –
Terry (today)
Data Model
Characteristics
• Organize/Structure like Data
Elements
• Define relationships between
Data Entities
• Highly Cohesive
• Loosely Coupled
Anthropomorphism
#1 Mistake in
Data Modeling
• Modeling something to take
on human characteristics or
characteristics of our world
Amazon
Amazon
• Warehouse is organized totally
randomly
• Although humans think the items
should be ordered in some way, it
does not help storage or retrieval in
any way
– In fact in hurts it by creating ‘hot spots’ for
in demand items
Data Model
Anthropomorphism
• We sometimes create
objects in our Data Models
are they exist in the real
world, not in the applications
Data Model
Anthropomorphism
• This is usually the case for physical
objects in the real world
– Companies/Organizations
– People
– Addresses
– Phone Numbers
– Emails
Data Model
Anthropomorphism
• Why?
– Do we ever need to consolidate all
people, addresses, or emails?
• Rarely
– We usually report based on other filter
criteria
– So why do we try to place like real world
items on one table when applications
treat them differently?
Over Engineering
Over Engineering
• Additional flexibility that is not
required does not simplify the
solution, it overly complicates
the solution
Database Design
Methods
Two design
methods
• Relational
– Database normalization is the process of
organizing the fields and tables of
a relational database to
minimize redundancy and dependency.
Normalization usually involves dividing
large tables into smaller (and less
redundant) tables and defining
relationships between them. The
objective is to isolate data so that
additions, deletions, and modifications
of a field can be made in just one table
and then propagated through the rest
of the database via the defined
relationships.”
Two design
methods
• Dimensional
– Dimensional modeling always uses the
concepts of facts (measures), and
dimensions (context). Facts are
typically (but not always) numeric
values that can be aggregated, and
dimensions are groups of hierarchies
and descriptors that define the facts
Relational
Relational
• Relational Analysis
– Database design is usually in
Third Normal Form
– Database is optimized for
transaction processing. (OLTP)
– Normalized tables are
optimized for modification
rather than retrieval
Normal forms
• 1st - Under first normal form, all
occurrences of a record type must
contain the same number of fields.
• 2nd - Second normal form is violated
when a non-key field is a fact about a
subset of a key. It is only relevant when
the key is composite
• 3rd - Third normal form is violated when
a non-key field is a fact about another
non-key field
Source: William Kent - 1982
Dimensional
Dimensional
• Dimensional Analysis
– Star Schema/Snowflake
– Database is optimized for analytical
processing. (OLAP)
– Facts and Dimensions optimized for
retrieval
• Facts – Business events – Transactions
• Dimensions – context for Transactions
– People
– Accounts
– Products
– Date
Relational
• 3 Dimensions
• Spatial Model
– No historical components except for
transactional tables
• Relational – Models the one truth of
the data
– One account ‘11’
– One person ‘Terry Bunio’
– One transaction of ‘$100.00’ on April 10th
Dimensional
• 4 Dimensions
• Temporal Model
– All tables have a time component
• Dimensional – Models the data over
time
– Multiple versions of Accounts over time
– Multiple versions of people over time
– One transaction
• Transactions are already temporal
Kimball-lytes
• Bottom-up - incremental
– Operational systems feed the Data
Warehouse
– Data Warehouse is a corporate
dimensional model that Data Marts are
sourced from
– Data Warehouse is the consolidation of
Data Marts
– Sometimes the Data Warehouse is
generated from Subject area Data Marts
Inmon-ians
• Top-down
– Corporate Information Factory
– Operational systems feed the Data
Warehouse
– Enterprise Data Warehouse is a corporate
relational model that Data Marts are
sourced from
– Enterprise Data Warehouse is the source
of Data Marts
The gist…
• Kimball’s approach is easier
to implement as you are
dealing with separate subject
areas, but can be a
nightmare to integrate
• Inmon’s approach has more
upfront effort to avoid these
consistency problems, but
takes longer to implement.
Facts
Fact Tables
• Contains the measurements or
facts about a business process
• Are thin and deep
• Usually is:
– Business transaction
– Business Event
• The grain of a Fact table is the
level of the data recorded.
Fact Tables
• Contains the following
elements
– Primary Key - Surrogate
– Timestamp
– Measure or Metrics
• Transaction Amounts
– Foreign Keys to Dimensions
– Degenerate Dimensions
• Transaction indicators or Flags
Fact Tables
• Types of Measures
– Additive - Measures that can be
added across any dimensions.
• Amounts
– Non Additive - Measures that cannot
be added across any dimension.
• Rates
– Semi Additive - Measures that can
be added across some dimensions.
• Don’t have a good example
Fact Tables
• Types of Fact tables
– Transactional - A transactional table is the
most basic and fundamental. The grain
associated with a transactional fact table is
usually specified as "one row per line in a
transaction“.
– Periodic snapshots - The periodic snapshot, as
the name implies, takes a "picture of the
moment", where the moment could be any
defined period of time.
– Accumulating snapshots - This type of fact
table is used to show the activity of a process
that has a well-defined beginning and end,
e.g., the processing of an order. An order
moves through specific steps until it is fully
processed. As steps towards fulfilling the order
are completed, the associated row in the fact
table is updated.
Special Fact
Tables
• Degenerate Dimensions
– Degenerate Dimensions are
Dimensions that can typically
provide additional context about a
Fact
• For example, flags that describe a
transaction
• Degenerate Dimensions can
either be a separate Dimension
table or be collapsed onto the
Fact table
– My preference is the latter
Special Fact
Tables
• If Degenerate Dimensions are
not collapsed on a Fact table,
they are called Junk Dimensions
and remain a Dimension table
• Junk Dimensions can also have
attributes from different
dimensions
– Not recommended
Dimensions
Dimension Tables
• Unlike
fact tables, dimension tables
contain descriptive attributes
that are typically textual fields
• These attributes are designed to
serve two critical purposes:
– query constraining and/or filtering
– query result set labeling.
Source: Wikipedia
Dimension Tables
• Shallow and Wide
• Usually corresponds to entities
that the business interacts with
– People
– Locations
– Products
– Accounts
Time Dimension
Time Dimension
• All Dimensional Models need
a time component
• This is either a:
– Separate Time Dimension
(recommended)
– Time attributes on each Fact
Table
Dimension Tables
• Contains the following
elements
– Primary Key – Surrogate
– Business Natural Key
• Person ID
– Effective and Expiry Dates
– Descriptive Attributes
• Includes de-normalized reference
tables
Behavioural
Dimensions
• A Dimension that is
computed based on Facts
is termed a behavioural
dimension
Mini-Dimensions
Mini-Dimensions
• Splitting a Dimension up due
to the activity of change for
a set of attributes
• Helps to reduce the growth
of the Dimension table
Slowly Changing
Dimensions
• Type 1 – Overwrite the row
with the new values and
update the effective date
– Pre-existing Facts now refer to
the updated Dimension
– May cause inconsistent reports
Slowly Changing
Dimensions
• Type 2 – Insert a new Dimension row
with the new data and new
effective date
– Update the expiry date on the prior
row
• Don’t update old Facts that refer to
the old row
– Only new Facts will refer to this new
Dimension row
• Type 2 Slowly Changing Dimension
maintains the historical context of
the data
Slowly Changing
Dimensions
• A type 2 change results in
multiple dimension rows for a
given natural key
• A type 2 change results in
multiple dimension rows for a
given natural key
• A type 2 change results in
multiple dimension rows for a
given natural key
Slowly Changing
Dimensions
• No longer to I have one row to
represent:
– Account 10123
– Terry Bunio
– Sales Representative 11092
• This changes the mindset and query
syntax to retrieve data
Slowly Changing
Dimensions
• Type 3 – The Dimension stores
multiple versions for the attribute in
question
• This usually involves a current and
previous value for the attribute
• When a change occurs, no rows
are added but both the current
and previous attributes are
updated
• Like Type 1, Type 3 does not retain
full historical context
Slowly Changing
Dimensions
• You can also create hybrid
versions of Type 1, Type 2, and
Type 3 based on your business
requirements
Type 1/Type 2
Hybrid
• Most common hybrid
• Used when you need history
AND the current name for
some types of statutory
reporting
Frozen Attributes
• Some times it is required to
freeze some attributes so that
they are not Type 1, Type 2, or
Type 3
• Usually for audit or regulatory
requirements
Conformity
Recall - Kimball-lytes
• Bottom-up - incremental
– Operational systems feed the Data
Warehouse
– Data Warehouse is a corporate
dimensional model that Data Marts are
sourced from
– Data Warehouse is the consolidation of
Data Marts
– Sometimes the Data Warehouse is
generated from Subject area Data Marts
The problem
• Kimball’s approach can led
to Dimensions that are not
conforming
• This is due to the fact that
separate departments
define what a client or
product is
– Some times their definitions
do not agree
Conforming
Dimension
• A Dimension is said to be conforming
if:
– A conformed dimension is a set of data
attributes that have been physically
referenced in multiple database tables
using the same key value to refer to the
same structure, attributes, domain
values, definitions and concepts. A
conformed dimension cuts across many
facts.
• Dimensions are conformed when
they are either exactly the same
(including keys) or one is a perfect
subset of the other.
If you take one
thing away
• Ensure that your Dimensions
are conformed
Complexity
Complexity
• Most textbooks stop here only
show the simplest Dimensional
Models
• Unfortunately, I’ve never run
into a Dimensional Model like
that
Simple
More Complex
Real World
Complex Concept
Introduction
• Snowflake vs Star Schema
• Multi-Valued Dimensions and
Bridges
• Multi-Valued Attributes
• Factless Facts
• Recursive Hierarchies
Snowflake vs
Star Schema
Snowflake vs
Star Schema
Snowflake vs
Star Schema
• These extra table are termed
outriggers
• They are used to address real world
complexities with the data
– Excessive row length
– Repeating groups of data within the
Dimension
• I will use outriggers in a limited way for
repeating data
Multi-Valued
Dimensions
• Multi-Valued Dimensions are
when a Fact needs to
connect more than once to a
Dimension
– Primary Sales Representative
– Secondary Sales Representative
Multi-Valued
Dimensions
• Two possible solutions
– Create copies of the Dimensions
for each role
– Create a Bridge table to resolve
the many to many relationship
Multi-Valued
Dimensions
Bridge Tables
Bridge Tables
• Bridge Tables can be used to
resolve any many to many
relationships
• This is frequently required with
more complex data areas
• These bridge tables need to be
considered a Dimension and they
need to use the same Slowly
Changing Dimension Design as
the base Dimension
– My Recommendation
Multi-Valued
Attributes
• In some cases, you will need to
keep multiple values for an
attribute or sets of attributes
• Three solutions
– Outriggers or Snowflake (1:M)
– Bridge Table (M:M)
– Repeat attributes on the
Dimension
• Simplest solution but can be hard to
query and causes long record length
Factless Facts
• Fact table with no metrics or
measures
• Used for two purposes:
– Records the occurrence of
activities. Although no facts are
stored explicitly, these events can
be counted, producing meaningful
process measurements.
– Records significant information that
is not part of a business activity.
Examples of conditions include
eligibility of people for programs
and the assignment of Sales
Representatives to Clients
Hierarchies and Recursive
Hierarchies
Hierarchies and
Recursive Hierarchies
• We would need a separate
session to cover this topic
• Solution involves defining
Dimension tables to record
the Hierarchy with a special
solution to address the Slowly
Changing Dimension
Hierarchy
• Any change in the Hierarchy
can result in needing to
duplicate the Hierarchy
downstream
Why?
• Why Dimensional Model?
• Allows for a concise representation
of data for reporting. This is
especially important for Self-Service
Reporting
– We reduced from 400+ tables in our
Operational Data Store to 60+ tables
in our Data Warehouse
– Aligns with real world business
concepts
Why?
• The most important reason –
– Requires detailed and deeper
understanding of the data
– Validates the solution
– Uncovers inconsistencies and
errors in the Normalized Model
• Easy for inconsistencies and errors
to hide in 400+ tables
• No place to hide when those
tables are reduced down
Why?
• Ultimately there must be a
business requirement for a
temporal data model and not
just a spatial one.
• Although you could go through
the exercise to validate your
understanding and not
implement the Dimensional
Data Model
How?
How?
• Start with your simplest Dimension
and Fact tables and define the
Natural Keys for them
– i.e. People, Product, Transaction,
Time
• De-Normalize Reference tables to
Dimensions (And possibly Facts
based on how large the Fact
tables will be)
– I place both codes and descriptions
on the Dimension and Fact tables
• Look to De-normalize other tables
with the same Cardinality into one
Dimension
– Validate the Natural Keys still define
one row
How?
• Don’t force entities on the same
Dimension
– Tempting but you will find it doesn’t
represent the data and will cause
issues for loading or retrieval
– Bridge table or mini-snowflakes are
not bad
• I don’t like a deep snowflake, but
shallow snowflakes can be appropriate
• Don’t fall into the Star-
Schema/Snowflake Holy War – Let your
data define the solution
How?
• Iterate, Iterate, Iterate
– Your initial solution will be wrong
– Create it and start to define the load
process and reports
– You will learn more by using the data than
months of analysis to try and get the
model right
Top 10
Top 10
1. Copy the design for the Time
Dimension from the Web. Lots of
good solutions with scripts to
prepopulate the dimension
2. Make all your attributes Not-Null. This
makes Self-Service Report writing
easy
3. Create a single Surrogate Primary
Key for Dimensions – This will help to
simplify the design and table width
– These FKs get created on Fact tables !
Top 10
4. Never reject a record
– Create an Dummy Invalid record on
Each Dimension. Allows you to store a
Fact record when the relationship is
missing
5. Choose a Type 2 Slowly Changing
Dimension as your default
6. Use Effective and Expiry dates on
your Dimensions to allow for
maximum historical information
– If they are Type 2!
Top 10
7. SSIS 2012 has some built-in
functionality for processing
Slowly Changing Dimensions –
Check it out!
8. Add “Current_ind” and
“Dummy_ind” attributes to each
Dimension to assist in Report
writing
9. Iterate, Iterate, Iterate
10. Read this book
Whew! Questions?

Dimensional modeling primer - SQL Saturday Madison - April 11th, 2015

  • 1.
    Dimensional Data Modeling APrimer SQL Saturday Madison – April 11,2015
  • 2.
  • 3.
    Who Am I? •Terry Bunio • Data Base Administrator – Oracle – SQL Server 6,6.5,7,2000,2005,2008,2012 – Informix – ADABAS • Data Modeler/Architect – Investors Group, LPL Financial, Manitoba Blue Cross, Assante Financial, CI Funds, Mackenzie Financial – Normalized and Dimensional • Agilist – Innovation Gamer, Team Member, SQL Developer, Test writer, Sticky Sticker, Project Manager, PMO on SAP Implementation
  • 4.
    Previous SQL Saturday Presentations •SQL Sat Winnipeg 2014 – Breaking Data – Stress test using Ostress • SQL Sat Madison/Minneapolis 2014 – A data driven ETL test framework • SQL Sat Minneapolis 2013 – Agile Data Warehouse • SQL Sat Fargo 2013 – SSRS and SharePoint – there and back again
  • 12.
  • 13.
    Agenda • Data Modeling –#1 mistake In Data Modeling • Database Design Methods • Dimensional concepts – Facts – Dimensions • Complex Concept Introduction • Why and How? • My Top 10 Dimensional Modeling Recommendations
  • 14.
    Definition • “A databasemodel is a specification describing how a database is structured and used” – Wikipedia
  • 15.
    Definition • “A datamodel describes how the data entities are related to each other in the real world” – Terry (5 years ago) • “A data model describes how the data entities are related to each other in the application” – Terry (today)
  • 16.
    Data Model Characteristics • Organize/Structurelike Data Elements • Define relationships between Data Entities • Highly Cohesive • Loosely Coupled
  • 17.
  • 18.
    #1 Mistake in DataModeling • Modeling something to take on human characteristics or characteristics of our world
  • 19.
  • 20.
    Amazon • Warehouse isorganized totally randomly • Although humans think the items should be ordered in some way, it does not help storage or retrieval in any way – In fact in hurts it by creating ‘hot spots’ for in demand items
  • 21.
    Data Model Anthropomorphism • Wesometimes create objects in our Data Models are they exist in the real world, not in the applications
  • 22.
    Data Model Anthropomorphism • Thisis usually the case for physical objects in the real world – Companies/Organizations – People – Addresses – Phone Numbers – Emails
  • 23.
    Data Model Anthropomorphism • Why? –Do we ever need to consolidate all people, addresses, or emails? • Rarely – We usually report based on other filter criteria – So why do we try to place like real world items on one table when applications treat them differently?
  • 24.
  • 25.
    Over Engineering • Additionalflexibility that is not required does not simplify the solution, it overly complicates the solution
  • 26.
  • 27.
    Two design methods • Relational –Database normalization is the process of organizing the fields and tables of a relational database to minimize redundancy and dependency. Normalization usually involves dividing large tables into smaller (and less redundant) tables and defining relationships between them. The objective is to isolate data so that additions, deletions, and modifications of a field can be made in just one table and then propagated through the rest of the database via the defined relationships.”
  • 28.
    Two design methods • Dimensional –Dimensional modeling always uses the concepts of facts (measures), and dimensions (context). Facts are typically (but not always) numeric values that can be aggregated, and dimensions are groups of hierarchies and descriptors that define the facts
  • 29.
  • 30.
    Relational • Relational Analysis –Database design is usually in Third Normal Form – Database is optimized for transaction processing. (OLTP) – Normalized tables are optimized for modification rather than retrieval
  • 31.
    Normal forms • 1st- Under first normal form, all occurrences of a record type must contain the same number of fields. • 2nd - Second normal form is violated when a non-key field is a fact about a subset of a key. It is only relevant when the key is composite • 3rd - Third normal form is violated when a non-key field is a fact about another non-key field Source: William Kent - 1982
  • 32.
  • 33.
    Dimensional • Dimensional Analysis –Star Schema/Snowflake – Database is optimized for analytical processing. (OLAP) – Facts and Dimensions optimized for retrieval • Facts – Business events – Transactions • Dimensions – context for Transactions – People – Accounts – Products – Date
  • 34.
    Relational • 3 Dimensions •Spatial Model – No historical components except for transactional tables • Relational – Models the one truth of the data – One account ‘11’ – One person ‘Terry Bunio’ – One transaction of ‘$100.00’ on April 10th
  • 35.
    Dimensional • 4 Dimensions •Temporal Model – All tables have a time component • Dimensional – Models the data over time – Multiple versions of Accounts over time – Multiple versions of people over time – One transaction • Transactions are already temporal
  • 38.
    Kimball-lytes • Bottom-up -incremental – Operational systems feed the Data Warehouse – Data Warehouse is a corporate dimensional model that Data Marts are sourced from – Data Warehouse is the consolidation of Data Marts – Sometimes the Data Warehouse is generated from Subject area Data Marts
  • 39.
    Inmon-ians • Top-down – CorporateInformation Factory – Operational systems feed the Data Warehouse – Enterprise Data Warehouse is a corporate relational model that Data Marts are sourced from – Enterprise Data Warehouse is the source of Data Marts
  • 40.
    The gist… • Kimball’sapproach is easier to implement as you are dealing with separate subject areas, but can be a nightmare to integrate • Inmon’s approach has more upfront effort to avoid these consistency problems, but takes longer to implement.
  • 41.
  • 42.
    Fact Tables • Containsthe measurements or facts about a business process • Are thin and deep • Usually is: – Business transaction – Business Event • The grain of a Fact table is the level of the data recorded.
  • 43.
    Fact Tables • Containsthe following elements – Primary Key - Surrogate – Timestamp – Measure or Metrics • Transaction Amounts – Foreign Keys to Dimensions – Degenerate Dimensions • Transaction indicators or Flags
  • 44.
    Fact Tables • Typesof Measures – Additive - Measures that can be added across any dimensions. • Amounts – Non Additive - Measures that cannot be added across any dimension. • Rates – Semi Additive - Measures that can be added across some dimensions. • Don’t have a good example
  • 45.
    Fact Tables • Typesof Fact tables – Transactional - A transactional table is the most basic and fundamental. The grain associated with a transactional fact table is usually specified as "one row per line in a transaction“. – Periodic snapshots - The periodic snapshot, as the name implies, takes a "picture of the moment", where the moment could be any defined period of time. – Accumulating snapshots - This type of fact table is used to show the activity of a process that has a well-defined beginning and end, e.g., the processing of an order. An order moves through specific steps until it is fully processed. As steps towards fulfilling the order are completed, the associated row in the fact table is updated.
  • 46.
    Special Fact Tables • DegenerateDimensions – Degenerate Dimensions are Dimensions that can typically provide additional context about a Fact • For example, flags that describe a transaction • Degenerate Dimensions can either be a separate Dimension table or be collapsed onto the Fact table – My preference is the latter
  • 47.
    Special Fact Tables • IfDegenerate Dimensions are not collapsed on a Fact table, they are called Junk Dimensions and remain a Dimension table • Junk Dimensions can also have attributes from different dimensions – Not recommended
  • 48.
  • 49.
    Dimension Tables • Unlike facttables, dimension tables contain descriptive attributes that are typically textual fields • These attributes are designed to serve two critical purposes: – query constraining and/or filtering – query result set labeling. Source: Wikipedia
  • 50.
    Dimension Tables • Shallowand Wide • Usually corresponds to entities that the business interacts with – People – Locations – Products – Accounts
  • 51.
  • 52.
    Time Dimension • AllDimensional Models need a time component • This is either a: – Separate Time Dimension (recommended) – Time attributes on each Fact Table
  • 53.
    Dimension Tables • Containsthe following elements – Primary Key – Surrogate – Business Natural Key • Person ID – Effective and Expiry Dates – Descriptive Attributes • Includes de-normalized reference tables
  • 54.
    Behavioural Dimensions • A Dimensionthat is computed based on Facts is termed a behavioural dimension
  • 55.
  • 56.
    Mini-Dimensions • Splitting aDimension up due to the activity of change for a set of attributes • Helps to reduce the growth of the Dimension table
  • 57.
    Slowly Changing Dimensions • Type1 – Overwrite the row with the new values and update the effective date – Pre-existing Facts now refer to the updated Dimension – May cause inconsistent reports
  • 58.
    Slowly Changing Dimensions • Type2 – Insert a new Dimension row with the new data and new effective date – Update the expiry date on the prior row • Don’t update old Facts that refer to the old row – Only new Facts will refer to this new Dimension row • Type 2 Slowly Changing Dimension maintains the historical context of the data
  • 59.
    Slowly Changing Dimensions • Atype 2 change results in multiple dimension rows for a given natural key • A type 2 change results in multiple dimension rows for a given natural key • A type 2 change results in multiple dimension rows for a given natural key
  • 60.
    Slowly Changing Dimensions • Nolonger to I have one row to represent: – Account 10123 – Terry Bunio – Sales Representative 11092 • This changes the mindset and query syntax to retrieve data
  • 61.
    Slowly Changing Dimensions • Type3 – The Dimension stores multiple versions for the attribute in question • This usually involves a current and previous value for the attribute • When a change occurs, no rows are added but both the current and previous attributes are updated • Like Type 1, Type 3 does not retain full historical context
  • 62.
    Slowly Changing Dimensions • Youcan also create hybrid versions of Type 1, Type 2, and Type 3 based on your business requirements
  • 63.
    Type 1/Type 2 Hybrid •Most common hybrid • Used when you need history AND the current name for some types of statutory reporting
  • 64.
    Frozen Attributes • Sometimes it is required to freeze some attributes so that they are not Type 1, Type 2, or Type 3 • Usually for audit or regulatory requirements
  • 65.
  • 66.
    Recall - Kimball-lytes •Bottom-up - incremental – Operational systems feed the Data Warehouse – Data Warehouse is a corporate dimensional model that Data Marts are sourced from – Data Warehouse is the consolidation of Data Marts – Sometimes the Data Warehouse is generated from Subject area Data Marts
  • 67.
    The problem • Kimball’sapproach can led to Dimensions that are not conforming • This is due to the fact that separate departments define what a client or product is – Some times their definitions do not agree
  • 68.
    Conforming Dimension • A Dimensionis said to be conforming if: – A conformed dimension is a set of data attributes that have been physically referenced in multiple database tables using the same key value to refer to the same structure, attributes, domain values, definitions and concepts. A conformed dimension cuts across many facts. • Dimensions are conformed when they are either exactly the same (including keys) or one is a perfect subset of the other.
  • 69.
    If you takeone thing away • Ensure that your Dimensions are conformed
  • 70.
  • 71.
    Complexity • Most textbooksstop here only show the simplest Dimensional Models • Unfortunately, I’ve never run into a Dimensional Model like that
  • 72.
  • 73.
  • 74.
  • 75.
    Complex Concept Introduction • Snowflakevs Star Schema • Multi-Valued Dimensions and Bridges • Multi-Valued Attributes • Factless Facts • Recursive Hierarchies
  • 76.
  • 77.
  • 78.
    Snowflake vs Star Schema •These extra table are termed outriggers • They are used to address real world complexities with the data – Excessive row length – Repeating groups of data within the Dimension • I will use outriggers in a limited way for repeating data
  • 79.
    Multi-Valued Dimensions • Multi-Valued Dimensionsare when a Fact needs to connect more than once to a Dimension – Primary Sales Representative – Secondary Sales Representative
  • 80.
    Multi-Valued Dimensions • Two possiblesolutions – Create copies of the Dimensions for each role – Create a Bridge table to resolve the many to many relationship
  • 81.
  • 82.
  • 83.
    Bridge Tables • BridgeTables can be used to resolve any many to many relationships • This is frequently required with more complex data areas • These bridge tables need to be considered a Dimension and they need to use the same Slowly Changing Dimension Design as the base Dimension – My Recommendation
  • 84.
    Multi-Valued Attributes • In somecases, you will need to keep multiple values for an attribute or sets of attributes • Three solutions – Outriggers or Snowflake (1:M) – Bridge Table (M:M) – Repeat attributes on the Dimension • Simplest solution but can be hard to query and causes long record length
  • 85.
    Factless Facts • Facttable with no metrics or measures • Used for two purposes: – Records the occurrence of activities. Although no facts are stored explicitly, these events can be counted, producing meaningful process measurements. – Records significant information that is not part of a business activity. Examples of conditions include eligibility of people for programs and the assignment of Sales Representatives to Clients
  • 86.
  • 87.
    Hierarchies and Recursive Hierarchies •We would need a separate session to cover this topic • Solution involves defining Dimension tables to record the Hierarchy with a special solution to address the Slowly Changing Dimension Hierarchy • Any change in the Hierarchy can result in needing to duplicate the Hierarchy downstream
  • 88.
    Why? • Why DimensionalModel? • Allows for a concise representation of data for reporting. This is especially important for Self-Service Reporting – We reduced from 400+ tables in our Operational Data Store to 60+ tables in our Data Warehouse – Aligns with real world business concepts
  • 89.
    Why? • The mostimportant reason – – Requires detailed and deeper understanding of the data – Validates the solution – Uncovers inconsistencies and errors in the Normalized Model • Easy for inconsistencies and errors to hide in 400+ tables • No place to hide when those tables are reduced down
  • 90.
    Why? • Ultimately theremust be a business requirement for a temporal data model and not just a spatial one. • Although you could go through the exercise to validate your understanding and not implement the Dimensional Data Model
  • 91.
  • 92.
    How? • Start withyour simplest Dimension and Fact tables and define the Natural Keys for them – i.e. People, Product, Transaction, Time • De-Normalize Reference tables to Dimensions (And possibly Facts based on how large the Fact tables will be) – I place both codes and descriptions on the Dimension and Fact tables • Look to De-normalize other tables with the same Cardinality into one Dimension – Validate the Natural Keys still define one row
  • 93.
    How? • Don’t forceentities on the same Dimension – Tempting but you will find it doesn’t represent the data and will cause issues for loading or retrieval – Bridge table or mini-snowflakes are not bad • I don’t like a deep snowflake, but shallow snowflakes can be appropriate • Don’t fall into the Star- Schema/Snowflake Holy War – Let your data define the solution
  • 94.
    How? • Iterate, Iterate,Iterate – Your initial solution will be wrong – Create it and start to define the load process and reports – You will learn more by using the data than months of analysis to try and get the model right
  • 95.
  • 96.
    Top 10 1. Copythe design for the Time Dimension from the Web. Lots of good solutions with scripts to prepopulate the dimension 2. Make all your attributes Not-Null. This makes Self-Service Report writing easy 3. Create a single Surrogate Primary Key for Dimensions – This will help to simplify the design and table width – These FKs get created on Fact tables !
  • 97.
    Top 10 4. Neverreject a record – Create an Dummy Invalid record on Each Dimension. Allows you to store a Fact record when the relationship is missing 5. Choose a Type 2 Slowly Changing Dimension as your default 6. Use Effective and Expiry dates on your Dimensions to allow for maximum historical information – If they are Type 2!
  • 98.
    Top 10 7. SSIS2012 has some built-in functionality for processing Slowly Changing Dimensions – Check it out! 8. Add “Current_ind” and “Dummy_ind” attributes to each Dimension to assist in Report writing 9. Iterate, Iterate, Iterate 10. Read this book
  • 101.