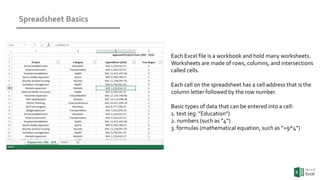
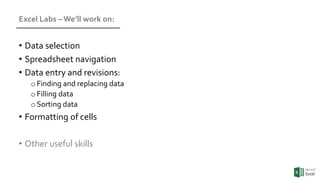
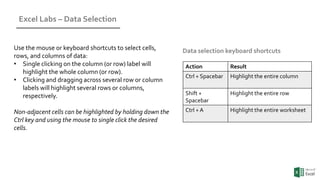
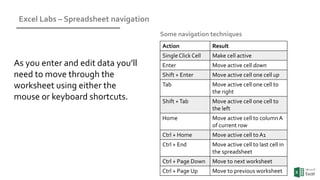
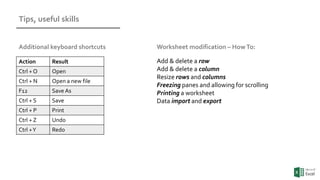
This courseware will introduce you to basics in working with Excel Spreadsheets. It'll serve as a compliment to the in-lab sessions that will be held during the data journalism training session - Voter's Count - in Kumasi
Ms excel basic about Data, graph and pivot table Alomgir Hossain
Microsoft Excel can be used to store, organize, and manipulate data. It allows data to be organized in workbooks containing worksheets with rows and columns made up of cells. Excel contains various built-in functions, formulas, charts, and data analysis tools. This document provides an overview of Excel's basic features and functions, how to enter and format data, use formulas and functions, sort and filter data, insert and delete rows/columns, and create basic charts and graphs. It demonstrates the core capabilities of Excel for organizing and analyzing data.
This document provides an introduction to Microsoft Excel. It begins with opening Excel and navigating within workbooks and worksheets. It describes entering different types of data like numbers, text, formulas. It discusses selecting cells, entering and editing data, copying and moving data using fill handle. It also covers saving workbooks in compatibility mode to allow opening in older Excel versions. The document is presented by Abdulbasit H. Mhdi and contains guidance, instructions and screenshots to explain key Excel concepts.
This document provides information about Microsoft Excel, including:
- Excel is an electronic spreadsheet program that allows users to create graphs, worksheets, and perform calculations.
- It has features like calculation, graphing tools, pivot tables, and a macro programming language called VBA.
- Excel is useful for tasks like data entry, data manipulation, formulas, analysis, and automatic graphing.
- The document then reviews parts of the Excel window and interface like ribbons, tabs, and cells.
- It provides instructions on opening, saving, and manipulating Excel files and worksheets.
This document provides an introduction and tutorial for Microsoft Excel. It begins with an overview of Excel and what it can be used for, such as budget creation, data analysis, and presenting information. It then discusses key Excel components like the ribbon menu, cells, columns, rows, and worksheets. The document provides instructions for common tasks like navigating, entering data, formatting text and cells, inserting and deleting rows and columns, sorting data, and printing. It concludes by explaining how to copy and paste formatting between cells using tools like the format painter.
Sorting arranges records in a specific sequence such as ascending or descending order. Filtering compares records against criteria and hides non-matching records, allowing the user to edit, format, copy or chart matching records without affecting others. In Excel, sorting and filtering can be done by data type including number, text, date and color. Filters can compare fields for criteria like equals, less than, greater than, begins with and contains.
Excel can be used for calculations, data management, charts and graphs. It contains worksheets organized into rows and columns within a workbook. Each worksheet has cells located at the intersection of rows and columns that can be referenced by their address. Data is entered into cells and basic navigation uses keyboard shortcuts like tab, arrow keys, page up/down and Ctrl+home. Cells, rows and columns can be selected using the mouse or keyboard for editing.
This document provides an overview of key Excel concepts and tasks, including:
1) Excel is a program used to enter and analyze quantitative data in spreadsheets. It allows what-if analysis by changing values to assess impacts.
2) The tutorial covers navigating and exploring Excel, entering data, formulas and functions, formatting cells, inserting and deleting rows/columns/worksheets, and printing worksheets.
3) Formulas use operators to combine values from cells and return a single result. Functions are predefined formulas like SUM to simplify calculations.
The document discusses spreadsheets and Microsoft Excel. It defines a spreadsheet as a configuration of rows and columns, also known as a worksheet. Spreadsheets are used to calculate and compare numerical or financial data. Microsoft Excel, part of the Microsoft Office suite, allows users to understand and work with spreadsheets. The document reviews the history and features of different Excel versions. It provides an overview of basic spreadsheet concepts such as workbooks, worksheets, cells, and cell references. It also reviews keyboard shortcuts for navigating within a spreadsheet.
How to use Hlookup find an exact match Excel Advise
In this presentation we are telling you guys that In Microsoft Excel How to use Hlookup find an exact match.
The H in HLOOKUP stands for horizontal.
Hlookup Function is used to search a value in another Table and if found return the corresponding value of that table for the specified row.
You can lookup value in one of the two following ways:
Range Lookup
Range lookup is used when you want to search for ranges, it will look for nearest minimum value from the first row of the table.
Exact Lookup
We use this kind of lookups when we need to seek exact value.
Lookup value is the value to be found in the first row of the table. It can be a number, text or cell address..
Table array is a range where you want to find your lookup value.
Row num is the row number in table array from which the matching value will be returned
Range lookup is a logical value that specifies whether you want HLOOKUP to find an exact match or an approximate match.
if range lookup is true then it will return you exact match or an approximate matching value. And if range lookup is false it will give you exact match.
This document provides a 3-paragraph summary of a PowerPoint presentation on Excel:
The presentation introduces Excel as a software program developed by Microsoft that allows users to organize and calculate data in a spreadsheet. It describes the basic Excel interface including worksheets, cells, formulas, and functions. Common functions like SUM, AVERAGE, MIN, and MAX are explained. The presentation also covers formatting text and numbers, inserting shapes and pictures, printing options, and other Excel features.
Excel functions and formulas are demonstrated including relative and absolute cell references. Logical IF functions are introduced to conditionally format cells based on comparisons. Syntax for IF functions is provided. Common Excel elements like toolbars, menus, sorting, and conditional formatting
This document provides an overview of the basic features and interface of Microsoft Excel, including how to open and save worksheets, customize Excel, modify worksheets by formatting cells and adding formulas and functions, and sort and filter data. It describes the main parts of the Excel interface such as the ribbon, formula bar, rows and columns, scroll bars, and sheet tabs. It also explains how to exit Excel.
Microsoft Excel is the world's most widely used spreadsheet program and part of the Microsoft Office suite. Excel excels at creating charts, solving numerical problems, and handling non-numerical problems. Formulas in Excel use mathematical instructions and references to cells or ranges to perform calculations using operators, constants, and functions. Scenarios in Excel allow users to model different outcomes by changing inputs and seeing updated results.
Adobe Illustrator: 6 Essential Tips and ToolsNguyet Minh
Adobe Illustrator allows full control and editing of an artwork. Since it is so customizable, many potentials of what you can do with just simple tools are not so obvious. Let's go through the 6 tools in Illustrator you might not know.
Adobe Illustrator CS6 was used to demonstrate.
Types of charts in Excel and How to use themVijay Perepa
There are different Chart types and some times we face difficulty to find which chart is suitable for a specific Data set. In this series of Videos, we have discussed about each chart type and when to use etc.
Microsoft Excel allows users to organize data into spreadsheets. It contains workbooks with multiple worksheets made of cells organized into rows and columns. Excel provides functions to perform calculations and analyze data. Users can format worksheets, insert charts and images, and print selections of cells or entire worksheets. Formulas using built-in functions can easily calculate and manipulate data in Excel.
Excel is a spreadsheet application from Microsoft. It allows users to enter data, calculate values, and format cells. The latest version is Excel 2013. Excel uses workbooks that contain worksheets where data is entered into cells organized in columns and rows. Formulas can be used to perform calculations with functions. Data is formatted for appearance. A sample worksheet is created to track student course information and calculate GPA.
This Excel tutorial document provides instructions on how to perform common tasks in Microsoft Excel, including:
1) Opening and closing workbooks, navigating through worksheets, selecting cells, entering and formatting data, inserting and deleting cells and rows/columns, printing, creating formulas, using functions, moving data, finding and replacing values, and adding borders and shading.
2) It describes the main parts of the Excel interface such as the title bar, menu bar, toolbar, worksheet, scroll bars, and sheet tabs.
3) Step-by-step instructions are provided for common tasks with an emphasis on selecting options from drop-down menus or using keyboard shortcuts for efficient navigation and editing.
The document is a tutorial for using Microsoft Excel. It provides step-by-step instructions on how to navigate the Excel interface and use basic functions. The tutorial covers topics such as navigating the Excel screen, entering formulas and data, formatting worksheets, creating charts, and using keyboard shortcuts. It also includes explanations and instructions for common Excel tasks like opening and saving files, editing data, printing worksheets, and more.
A spreadsheet is an arrangement of cells organized in columns and rows that is used to store and manipulate data. A workbook contains one or more spreadsheets. Microsoft Excel is the most common program used to create spreadsheets. Spreadsheets have rows, columns, and cells identified by letters and numbers. Formulas use mathematical operators and cell references to perform calculations within a spreadsheet. Functions are predefined formulas that perform common tasks like summing a range of cells. Common uses of spreadsheets include budgets, grades, financial statements, data analysis, inventory, and forecasts.
Microsoft Paint is a basic image editing program that comes pre-installed with Windows operating systems. It allows users to create and edit pictures using a variety of drawing tools and shapes in different colors. Paint has no cost to users since it's included with Windows and offers digital sketching, photo editing, and text capabilities through tools like pencils, airbrushes, and shapes. The program is designed to be easy and fun to use for creating simple images and graphics.
This document provides an overview of Microsoft Excel basics, including defining key terms like worksheet and workbook, identifying the parts of a worksheet, opening and saving workbooks, entering and editing data, searching and replacing values, zooming and printing worksheets, and closing files. The objectives are to learn the basic functions and navigation of Excel in order to effectively manage and analyze data in spreadsheets.
The document provides an overview of Microsoft Excel, including:
- Excel is used to organize and manipulate numerical data in electronic spreadsheets. It allows users to perform calculations, create charts and graphs, and format information.
- The Excel interface includes tabs for worksheets, a title bar, menu bar, and toolbars for common functions like formatting and calculations.
- Key functions covered include entering and formatting data, creating formulas for calculations, sorting and filtering data, inserting charts and graphs, printing worksheets, and using keyboard shortcuts.
Microsoft Access is a powerful program for creating and managing databases. It allows users to construct tables with fields and records to organize data. Users can view and manipulate this data in a table or in alternate views like forms and reports. Forms present data from tables in a graphical interface, allowing users to easily add, update and delete records. Reports take the data and present it in a printed format designed by the user. Overall, Microsoft Access provides tools for structuring, editing, and presenting database information in an intuitive interface.
1. This document provides instructions for using basic Microsoft Excel functions like opening Excel, navigating the ribbon interface, entering data into cells, formatting cells, using autofill, and other common tasks.
2. It explains the different parts of the Excel interface like tabs, groups, commands, and describes the different data types Excel recognizes.
3. The document provides step-by-step examples for tasks like entering text and numbers, selecting cells, cutting/copying/pasting data, inserting and deleting rows and columns, and using basic formatting options.
The document provides an introduction to Excel including its definition, basic components, and functions. It outlines how to create workbooks and worksheets, navigate within a spreadsheet, enter and format data, create formulas, and print graphs and charts. The key topics covered include the Excel interface and toolbars, entering and editing data, basic navigation techniques, formatting cells and numbers, building formulas using AutoSum, and a four-step process for inserting charts.
CorelDraw is a professional vector graphics software that includes additional tools like Corel TRACE and Corel PHOTO-PAINT. It uses Windows shortcuts and allows for custom shortcuts. The workspace can be configured by defining page size. There are basic drawing tools like Freehand, Rectangle, Ellipse, and Polygon tools. Dockers provide quick access to commands and allow modifying objects. The Transformation Docker precisely moves, rotates, mirrors, sizes, and skews objects. Fills and outlines can be set and objects aligned using various methods in the Arrange menu.
The document discusses charts and graphs used in business. It explains that charts and graphs communicate and clarify spreadsheet information by emphasizing and categorizing data in a format that can be quickly analyzed. It distinguishes between charts and graphs, with graphs being features that plot data within a chart. The document provides examples of chart components and different chart types used in business analysis.
Microsoft Excel and PowerPoint are common programs used for data analysis and presentations. Excel allows users to organize and calculate data across spreadsheets, while PowerPoint enables the creation of digital slideshows and presentations. Both Excel and PowerPoint are part of the Microsoft Office suite of productivity applications.
A spreadsheet is a grid of rows and columns used to organize and analyze numerical data in cells. A workbook contains one or more spreadsheets and allows users to perform calculations on the data. Spreadsheets are commonly used for household budgets, grades, finances, and payroll in businesses. A spreadsheet displays data in cells that are identified by their column letter and row number. A range refers to a group of adjacent cells, while the cell address specifies a single cell's location using its column and row.
Spreadsheets have evolved from simple paper ledgers used by merchants to complex computer programs like Excel. The first electronic spreadsheet was VisiCalc, created in 1979. It popularized the grid-based interface and was succeeded by Lotus 1-2-3 in 1983. Microsoft Excel, first released in 1985, became the dominant spreadsheet as it transitioned to Windows. Excel continues advancing with new data analysis tools and versions that work on mobile devices, ensuring spreadsheets remain a key tool for organizing and calculating data.
This document provides an introduction and overview of key features in Microsoft Word 2007:
1) It describes how to launch Word and explains the main components of the Word window, including the title bar, ribbon, ruler, text area, and scroll bars.
2) It discusses how to perform common formatting tasks like adding bullets and numbers to lists, bolding and italicizing text, and using the undo and redo buttons.
3) It covers how to change page settings such as orientation, size, and margins. It also explains how to add page numbers in different locations.
4) The document provides instructions for inserting page breaks and changing the document view to print layout. It concludes by mentioning how to preview
Uses & applications of microsoft excel in vph researchDr Alok Bharti
Microsoft Excel is a spreadsheet application that allows users to enter and organize data into columns and rows, perform calculations with formulas, and visualize data through graphs and charts. It consists of worksheets where data is entered into cells that are organized by columns and rows. Common functions include formatting cells, filtering and sorting data, and using formulas to analyze data through calculations and pivot tables to examine relationships between variables.
This document provides an overview of key aspects of Microsoft Excel including:
- Excel is a widely used spreadsheet program that allows users to store, organize, and analyze information using workbooks, worksheets, and cells.
- The document reviews Excel interfaces such as the ribbon, toolbars, and shortcuts to help navigate and perform tasks more efficiently.
- Common functions and features like formulas, formatting, filtering, sorting, conditional formatting, and protecting sheets are described to understand how to manipulate and present data.
- Best practices for working with dates, times, and functions are covered to help properly store, display, and calculate dates and times in Excel.
Excel is an application used to create spreadsheets containing numerical values, formulas, and charts. It allows users to enter data into cells organized into rows and columns and perform calculations on that data. The basic elements of an Excel file include worksheets containing grids of cells organized by column letters and row numbers, grouped together in workbooks. Formulas and functions can be used to calculate and analyze the data in cells. Common tasks like formatting, sorting, conditional formatting, and summarizing data help users understand and visualize information in Excel spreadsheets.
This document defines key terms related to the Excel user interface and workbooks. It describes:
1) The main components of the Excel interface including the title bar, menus, toolbars, worksheet, cells, and sheet tabs.
2) How workbooks contain worksheets made up of columns and rows that intersect to form cells.
3) How to navigate within and between worksheets using keyboard shortcuts, scroll bars, and sheet tabs.
Excel is a spreadsheet program used to store and analyze data. It contains workbooks made up of individual worksheets. The Excel window displays components like the active cell, column headings, formula bar, and sheet tabs. Formulas in Excel always begin with an equal sign and can contain arithmetic operators and functions. Users can enter, format, navigate between and manipulate data and cells using various keyboard shortcuts, mouse clicks, menus and toolbars in Excel.
This document provides an overview of Microsoft Excel, including how to navigate worksheets, enter data, select cells and ranges, use formulas, and fill cells. The key points covered are navigating within and between worksheets, entering text, values, and formulas, selecting cells by clicking and dragging or using keyboard shortcuts, copying and pasting formulas, and using the fill handle to efficiently copy cell contents across a range. Functions for financial, logical, and date calculations are also mentioned.
This document provides an overview of spreadsheets and Microsoft Excel. It discusses how Excel allows users to perform calculations, organize and analyze data. Common uses of spreadsheets include sales, accounting, scheduling and inventory. The document then reviews Excel basics like worksheets, cells, formatting, sorting, inserting/deleting rows and columns. It provides instructions for entering labels and values, cutting/copying/pasting, and formatting cells.
Microsoft Excel can be used to create and manage spreadsheets called workbooks. A workbook contains individual worksheets where data and formulas can be entered into cells. Excel allows users to navigate between cells, worksheets, and workbooks using keys, mouse clicks, and navigation buttons. It also provides tools for formatting, inserting, deleting, and moving cells and worksheets to organize spreadsheet data.
For full text article go to : http://www.excel-microsoft-excel.com/excel-for-dummies/
This article on "Excel for dummies" showcases basic yet important tools of Excel - ut copy paste and important shortcuts etc that can be useful in the daily life.
This document defines a spreadsheet and its purpose. It begins by stating that a spreadsheet is a program that organizes data into rows and columns to perform operations on numerical data easily. Examples are given of where spreadsheets can be used, such as for statistics, budgeting, and keeping accounts. The elements of the Excel window like the title bar, menu bar, and worksheet tabs are identified. Finally, it describes the basic components of a spreadsheet including rows, columns, cells, and the different types of information - like labels, values, and formulas - that can be entered into cells.
NCompass Live - Aug. 22, 2018
http://nlc.nebraska.gov/ncompasslive/
Microsoft Excel has a variety of uses in the library world from keeping track of budgets or managing program registrations to viewing circulation or collection statistics. Learn some hints and tips for working with already existing spreadsheets as well as building your own. We’ll also take a look at Google Sheets and see how that compares with Excel.
Presenter: Megan Boggs, Seward (NE) Memorial Library.
The document provides an overview of key features in Microsoft Excel 2007, including spreadsheets, the ribbon interface, formulas, charts, and other formatting and analysis tools. It describes spreadsheet components like workbooks, worksheets, and cells. It explains the ribbon tabs and groups that contain formatting and function tools. It also provides instructions for common tasks like entering formulas, creating charts, formatting cells and text, hiding and arranging worksheets, and printing worksheets.
ms excel for mba first sem students of dr hs gour university sagar(m.p)gaurav jain
This document provides an overview and introduction to Microsoft Excel. It discusses the Excel screen layout including titles bars, menus, toolbars, and worksheets. It describes how to navigate and enter data into cells. Various Excel functions are also outlined such as formulas for addition, subtraction, multiplication and division. Other topics covered include formatting worksheets, creating charts, printing, and keyboard shortcuts. The document serves as a basic guide for getting started using Excel.
The document provides an introduction to Excel including its definition, basic components, and functions. It outlines how to create workbooks and worksheets, navigate within a spreadsheet, enter and format data, create formulas, and print graphs and charts. The key steps covered are how to create a new workbook, add and name worksheets, enter and edit data, use basic formatting tools, build formulas using AutoSum, and insert charts in 4 steps selecting data, chart type, labels, and location.
The document provides an introduction to Microsoft Excel by covering key topics such as the Excel interface, entering and editing data, building formulas and functions, formatting cells and data, and printing. It explains how to open and save Excel files, navigate and select cells, clear cell contents, copy and move data, and get help. Formulas, functions, formatting, and printing are described in more detail.
This document provides an overview of Microsoft Excel and its various features and functions. It discusses the layout and components of a spreadsheet, including rows, columns, cells, worksheets and ribbons. It describes how to enter and modify cell data, insert and delete rows and columns, and use basic formulas and functions like SUM. The document is intended as a guide for using Excel and highlights its applications in fields like accounting, auditing, taxation and data analysis.
The document discusses the major components of the Excel window and how to navigate and work with Excel spreadsheets. It describes key Excel concepts like workbooks, worksheets, cells, formulas, and charts. It also provides instructions for common Excel tasks like entering data, selecting ranges, inserting and deleting rows/columns, moving cells, printing, and using the Chart Wizard to create graphs.
This document provides an introduction to using Microsoft Excel for an accounting course. It explains basic spreadsheet concepts and Excel features such as cells, columns, rows, formatting, entering data, altering cell sizes, inserting/deleting rows and columns, and using cut, copy and paste. Students are instructed to create a proper spreadsheet for accounting purposes based on a provided guide.
The document provides an agenda for teaching basic Excel skills. It will cover the essential Home tab functions for basic tasks like formatting, sorting, and filtering. It will also cover more advanced skills like inserting objects, charts and using keyboard shortcuts to work more efficiently. The goal is for learners to feel comfortable creating and formatting a basic spreadsheet and practicing useful techniques.
Similar to Introduction to Basic Spreadsheets (20)
06-04-2024 - NYC Tech Week - Discussion on Vector Databases, Unstructured Data and AI
Discussion on Vector Databases, Unstructured Data and AI
https://www.meetup.com/unstructured-data-meetup-new-york/
This meetup is for people working in unstructured data. Speakers will come present about related topics such as vector databases, LLMs, and managing data at scale. The intended audience of this group includes roles like machine learning engineers, data scientists, data engineers, software engineers, and PMs.This meetup was formerly Milvus Meetup, and is sponsored by Zilliz maintainers of Milvus.
Beyond the Basics of A/B Tests: Highly Innovative Experimentation Tactics You...Aggregage
This webinar will explore cutting-edge, less familiar but powerful experimentation methodologies which address well-known limitations of standard A/B Testing. Designed for data and product leaders, this session aims to inspire the embrace of innovative approaches and provide insights into the frontiers of experimentation!
Codeless Generative AI Pipelines
(GenAI with Milvus)
https://ml.dssconf.pl/user.html#!/lecture/DSSML24-041a/rate
Discover the potential of real-time streaming in the context of GenAI as we delve into the intricacies of Apache NiFi and its capabilities. Learn how this tool can significantly simplify the data engineering workflow for GenAI applications, allowing you to focus on the creative aspects rather than the technical complexities. I will guide you through practical examples and use cases, showing the impact of automation on prompt building. From data ingestion to transformation and delivery, witness how Apache NiFi streamlines the entire pipeline, ensuring a smooth and hassle-free experience.
Timothy Spann
https://www.youtube.com/@FLaNK-Stack
https://medium.com/@tspann
https://www.datainmotion.dev/
milvus, unstructured data, vector database, zilliz, cloud, vectors, python, deep learning, generative ai, genai, nifi, kafka, flink, streaming, iot, edge
Analysis insight about a Flyball dog competition team's performanceroli9797
Insight of my analysis about a Flyball dog competition team's last year performance. Find more: https://github.com/rolandnagy-ds/flyball_race_analysis/tree/main
Predictably Improve Your B2B Tech Company's Performance by Leveraging DataKiwi Creative
Harness the power of AI-backed reports, benchmarking and data analysis to predict trends and detect anomalies in your marketing efforts.
Peter Caputa, CEO at Databox, reveals how you can discover the strategies and tools to increase your growth rate (and margins!).
From metrics to track to data habits to pick up, enhance your reporting for powerful insights to improve your B2B tech company's marketing.
- - -
This is the webinar recording from the June 2024 HubSpot User Group (HUG) for B2B Technology USA.
Watch the video recording at https://youtu.be/5vjwGfPN9lw
Sign up for future HUG events at https://events.hubspot.com/b2b-technology-usa/
Global Situational Awareness of A.I. and where its headedvikram sood
You can see the future first in San Francisco.
Over the past year, the talk of the town has shifted from $10 billion compute clusters to $100 billion clusters to trillion-dollar clusters. Every six months another zero is added to the boardroom plans. Behind the scenes, there’s a fierce scramble to secure every power contract still available for the rest of the decade, every voltage transformer that can possibly be procured. American big business is gearing up to pour trillions of dollars into a long-unseen mobilization of American industrial might. By the end of the decade, American electricity production will have grown tens of percent; from the shale fields of Pennsylvania to the solar farms of Nevada, hundreds of millions of GPUs will hum.
The AGI race has begun. We are building machines that can think and reason. By 2025/26, these machines will outpace college graduates. By the end of the decade, they will be smarter than you or I; we will have superintelligence, in the true sense of the word. Along the way, national security forces not seen in half a century will be un-leashed, and before long, The Project will be on. If we’re lucky, we’ll be in an all-out race with the CCP; if we’re unlucky, an all-out war.
Everyone is now talking about AI, but few have the faintest glimmer of what is about to hit them. Nvidia analysts still think 2024 might be close to the peak. Mainstream pundits are stuck on the wilful blindness of “it’s just predicting the next word”. They see only hype and business-as-usual; at most they entertain another internet-scale technological change.
Before long, the world will wake up. But right now, there are perhaps a few hundred people, most of them in San Francisco and the AI labs, that have situational awareness. Through whatever peculiar forces of fate, I have found myself amongst them. A few years ago, these people were derided as crazy—but they trusted the trendlines, which allowed them to correctly predict the AI advances of the past few years. Whether these people are also right about the next few years remains to be seen. But these are very smart people—the smartest people I have ever met—and they are the ones building this technology. Perhaps they will be an odd footnote in history, or perhaps they will go down in history like Szilard and Oppenheimer and Teller. If they are seeing the future even close to correctly, we are in for a wild ride.
Let me tell you what we see.
STATATHON: Unleashing the Power of Statistics in a 48-Hour Knowledge Extravag...sameer shah
"Join us for STATATHON, a dynamic 2-day event dedicated to exploring statistical knowledge and its real-world applications. From theory to practice, participants engage in intensive learning sessions, workshops, and challenges, fostering a deeper understanding of statistical methodologies and their significance in various fields."
State of Artificial intelligence Report 2023kuntobimo2016
Artificial intelligence (AI) is a multidisciplinary field of science and engineering whose goal is to create intelligent machines.
We believe that AI will be a force multiplier on technological progress in our increasingly digital, data-driven world. This is because everything around us today, ranging from culture to consumer products, is a product of intelligence.
The State of AI Report is now in its sixth year. Consider this report as a compilation of the most interesting things we’ve seen with a goal of triggering an informed conversation about the state of AI and its implication for the future.
We consider the following key dimensions in our report:
Research: Technology breakthroughs and their capabilities.
Industry: Areas of commercial application for AI and its business impact.
Politics: Regulation of AI, its economic implications and the evolving geopolitics of AI.
Safety: Identifying and mitigating catastrophic risks that highly-capable future AI systems could pose to us.
Predictions: What we believe will happen in the next 12 months and a 2022 performance review to keep us honest.
4th Modern Marketing Reckoner by MMA Global India & Group M: 60+ experts on W...Social Samosa
The Modern Marketing Reckoner (MMR) is a comprehensive resource packed with POVs from 60+ industry leaders on how AI is transforming the 4 key pillars of marketing – product, place, price and promotions.
The Building Blocks of QuestDB, a Time Series Databasejavier ramirez
Talk Delivered at Valencia Codes Meetup 2024-06.
Traditionally, databases have treated timestamps just as another data type. However, when performing real-time analytics, timestamps should be first class citizens and we need rich time semantics to get the most out of our data. We also need to deal with ever growing datasets while keeping performant, which is as fun as it sounds.
It is no wonder time-series databases are now more popular than ever before. Join me in this session to learn about the internal architecture and building blocks of QuestDB, an open source time-series database designed for speed. We will also review a history of some of the changes we have gone over the past two years to deal with late and unordered data, non-blocking writes, read-replicas, or faster batch ingestion.
End-to-end pipeline agility - Berlin Buzzwords 2024Lars Albertsson
We describe how we achieve high change agility in data engineering by eliminating the fear of breaking downstream data pipelines through end-to-end pipeline testing, and by using schema metaprogramming to safely eliminate boilerplate involved in changes that affect whole pipelines.
A quick poll on agility in changing pipelines from end to end indicated a huge span in capabilities. For the question "How long time does it take for all downstream pipelines to be adapted to an upstream change," the median response was 6 months, but some respondents could do it in less than a day. When quantitative data engineering differences between the best and worst are measured, the span is often 100x-1000x, sometimes even more.
A long time ago, we suffered at Spotify from fear of changing pipelines due to not knowing what the impact might be downstream. We made plans for a technical solution to test pipelines end-to-end to mitigate that fear, but the effort failed for cultural reasons. We eventually solved this challenge, but in a different context. In this presentation we will describe how we test full pipelines effectively by manipulating workflow orchestration, which enables us to make changes in pipelines without fear of breaking downstream.
Making schema changes that affect many jobs also involves a lot of toil and boilerplate. Using schema-on-read mitigates some of it, but has drawbacks since it makes it more difficult to detect errors early. We will describe how we have rejected this tradeoff by applying schema metaprogramming, eliminating boilerplate but keeping the protection of static typing, thereby further improving agility to quickly modify data pipelines without fear.
2. Objectives for this session
• Understand what spreadsheets are
• Fundamental operations in Excel
• Learn essential tasks
• Data manipulation – tips and tricks
3. What Are Spreadsheets
The computer equivalent of a paper ledger sheet.
It’s an electronic document in which data is arranged in rows and
columns.This data can be manipulated and used in calculations.
4. Why Spreadsheets Matter
• Easy formatting of data
• Organize data by sorting it
• Name ranges of data and use those range names in
formulas
• Use cell references rather than values in formulas
• Generation of charts and graphs
• Other reasons?
7. Excel Spreadsheet Layout
View Options and Zoom ControlStatus Bar and Sheets
Ribbon
Row Column
Scroll Bar
Quick AccessToolbar Window Controls & Help
8. Understanding the Ribbon
• File – managing files
• Home – common tools
• Insert – insertion of objects (pictures, charts etc.)
• Page Layout – printing and structure of page
• Formulas – functions, calculations
• Data – working with data
• Review – spell checks, protection, sharing
• View – how Excel appears on your screen
9. Spreadsheet Basics
Each Excel file is a workbook and hold many worksheets.
Worksheets are made of rows, columns, and intersections
called cells.
Each cell on the spreadsheet has a cell address that is the
column letter followed by the row number.
Basic types of data that can be entered into a cell:
1. text (eg. ”Education”)
2. numbers (such as ”4”)
3. formulas (mathematical equation, such as ”=9*4”)
10. Excel Labs – We’ll work on:
• Data selection
• Spreadsheet navigation
• Data entry and revisions:
oFinding and replacing data
oFilling data
oSorting data
• Formatting of cells
• Other useful skills
11. Excel Labs – Data Selection
Action Result
Ctrl + Spacebar Highlight the entire column
Shift +
Spacebar
Highlight the entire row
Ctrl + A Highlight the entire worksheet
Data selection keyboard shortcutsUse the mouse or keyboard shortcuts to select cells,
rows, and columns of data:
• Single clicking on the column (or row) label will
highlight the whole column (or row).
• Clicking and dragging across several row or column
labels will highlight several rows or columns,
respectively.
Non-adjacent cells can be highlighted by holding down the
Ctrl key and using the mouse to single click the desired
cells.
12. Excel Labs – Spreadsheet navigation
As you enter and edit data you’ll
need to move through the
worksheet using either the
mouse or keyboard shortcuts.
Action Result
Single Click Cell Make cell active
Enter Move active cell down
Shift + Enter Move active cell one cell up
Tab Move active cell one cell to
the right
Shift +Tab Move active cell one cell to
the left
Home Move active cell to column A
of current row
Ctrl + Home Move active cell to A1
Ctrl + End Move active cell to last cell in
the spreadsheet
Ctrl + Page Down Move to next worksheet
Ctrl + Page Up Move to previous worksheet
Some navigation techniques
13. Excel Labs – Entry and revision
Using Cut, Copy and Paste
Using the drag-and-drop method to move data:
1. Select the cells you wish to move
2. Point to an outside border of the cell
3. Click and drag the cell(s) to the new location
The data is removed from its original location
and overwrites the contents in the destination
location, just as when you apply cut and paste.
Action Result
Ctrl + C Copy
Ctrl + X Cut
Ctrl +V Paste
Cut, Copy and Paste Shortcuts
14. Excel Labs – Find and replace data
Action Result
Ctrl + F Find
Ctrl + H Replace
Find and Replace shortcuts
Using Find or Replace from the Edit drop
menu allows you to quickly find and/or
replace text or numbers in multiple cells
15. Excel Labs – Filling data
Autofill feature allows you to quickly fill in commonly
used series of data, such as repetitive or sequential data.
To use Autofill:
1. Type in the first few elements of the series in order
for Autofill to distinguish the pattern (eg. 2, 4, 6)
2. Highlight cells distinguishing the series
3. Select the (cross) handle at the bottom right corner of
the cell with the left mouse and drag it down across
as many rows as you want to fill
4. Release mouse button when done
Can also Autofill across columns by dragging right instead
16. Excel Labs – Sorting data & formatting
Action Result
Ctrl + B Bold
Ctrl + I Italicize
Ctrl + U Underline
Ctrl + 5 Strikethrough
Shift + Ctrl + $ Format as currency with 2 decimal places
Shift + Ctrl + % Format as percent with no decimal places
Formatting keyboard shortcuts
Formatting options
Using the Format Cells Dialog Box
Working with Format Painter
Conditional formatting of cells
Working with Styles
Sorting Data
Sort in the Ascending & DescendingOrder
Working with Sort Dialog Box
Non-alphabetic or numeric sort
17. Tips, useful skills
Action Result
Ctrl + O Open
Ctrl + N Open a new file
F12 Save As
Ctrl + S Save
Ctrl + P Print
Ctrl + Z Undo
Ctrl +Y Redo
Additional keyboard shortcuts
Add & delete a row
Add & delete a column
Resize rows and columns
Freezing panes and allowing for scrolling
Printing a worksheet
Data import and export
Worksheet modification – HowTo:
Data in a spreadsheet can be manipulated and used in calculations.
format your data
organize your data by sorting it
name ranges of data and use the range names in formulas and navigation for automatic updating
use cell references rather than values in formulas allowing you to adjust formulas as you copy and move them across the spreadsheet;
Generate charts and graphs illustrating your data;
automate and customize procedures by using macros.
Each Excel file is a workbook that can hold many worksheets.
Each worksheet (i.e. spreadsheet) is made up of – rows (horizontal; designated by numbers), – columns (vertical; designated by letters), – and their intersections, which are called cells.
The letters and numbers of the columns and rows (called labels) are displayed in gray buttons across the top and left side of the worksheet.
Each cell on the spreadsheet has a cell address that is the column letter followed by the row number.
1 SECTION 1. INTRODUCTION 2 – Example: the very first cell address in the worksheet is A1 (column A, row 1).
There are three basic types of data that can be entered into a cell:
1. text (text with no numerical values, such as ”Days”),
2. numbers (just a number/a constant value, such as ”5”),
3. and formulas (a mathematical equation used to calculate a result, such as ”=5+3”) – NOTE: All formulas MUST begin with an equal sign (=) in order to be calculated.
To add a row to a worksheet: select Rows from the Insert drop menu, OR highlight the row(s) by clicking on the row label(s), right-click with the mouse and choose Insert.
To delete a row from a worksheet: highlight the row(s) by clicking on the row label(s), and select Delete cells from the Edit drop menu, OR, right-click with the mouse and choose Delete.