Downloaded 28 times


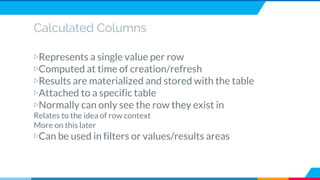
![Calculated Columns
▷GrossMargin = Sales[Price] – Sales[Cost]](https://image.slidesharecdn.com/1daxtraining-180421110218/85/Data-Analysis-Expressions-DAX-Training-16-320.jpg)
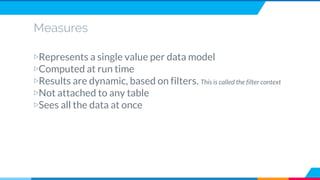
![Measures
▷TotalQuantity := SUM(Sales[Quantity])](https://image.slidesharecdn.com/1daxtraining-180421110218/85/Data-Analysis-Expressions-DAX-Training-18-320.jpg)


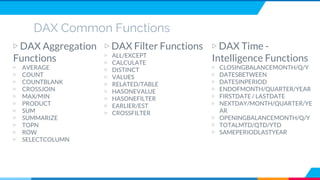
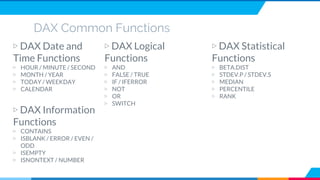
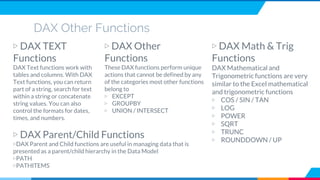
This document contains confidential information from Arocom Solutions Private Limited intended only for the addressee. It discusses an upcoming training on Data Analysis Expressions (DAX), Power Query, and Power BI. The agenda includes introductions, an overview of DAX and how it differs from Excel, common DAX functions, calculated columns and measures, and exercises. DAX is a functional formula language for data analysis within Excel data models that allows for aggregation, filtering, and time intelligence operations.