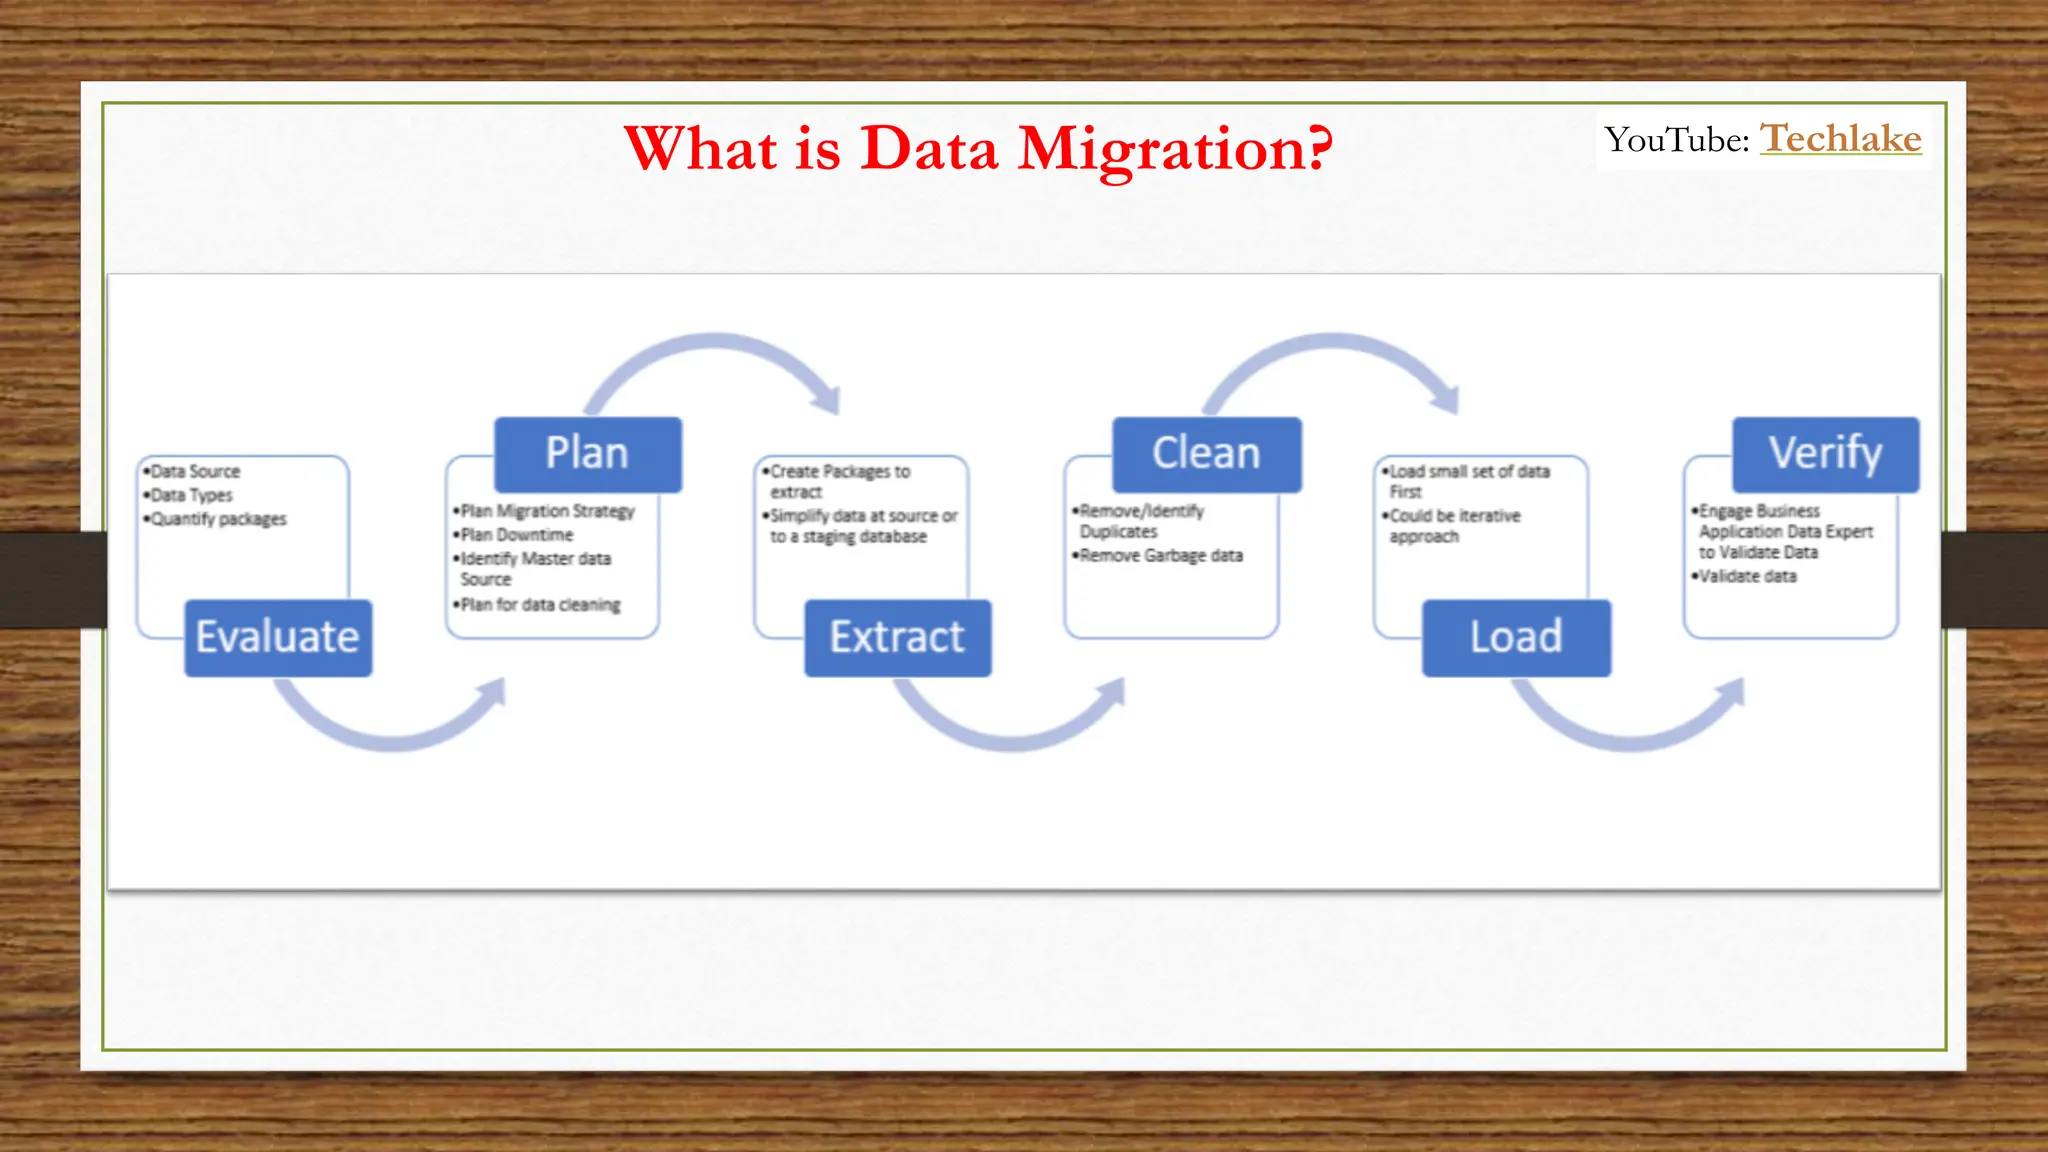
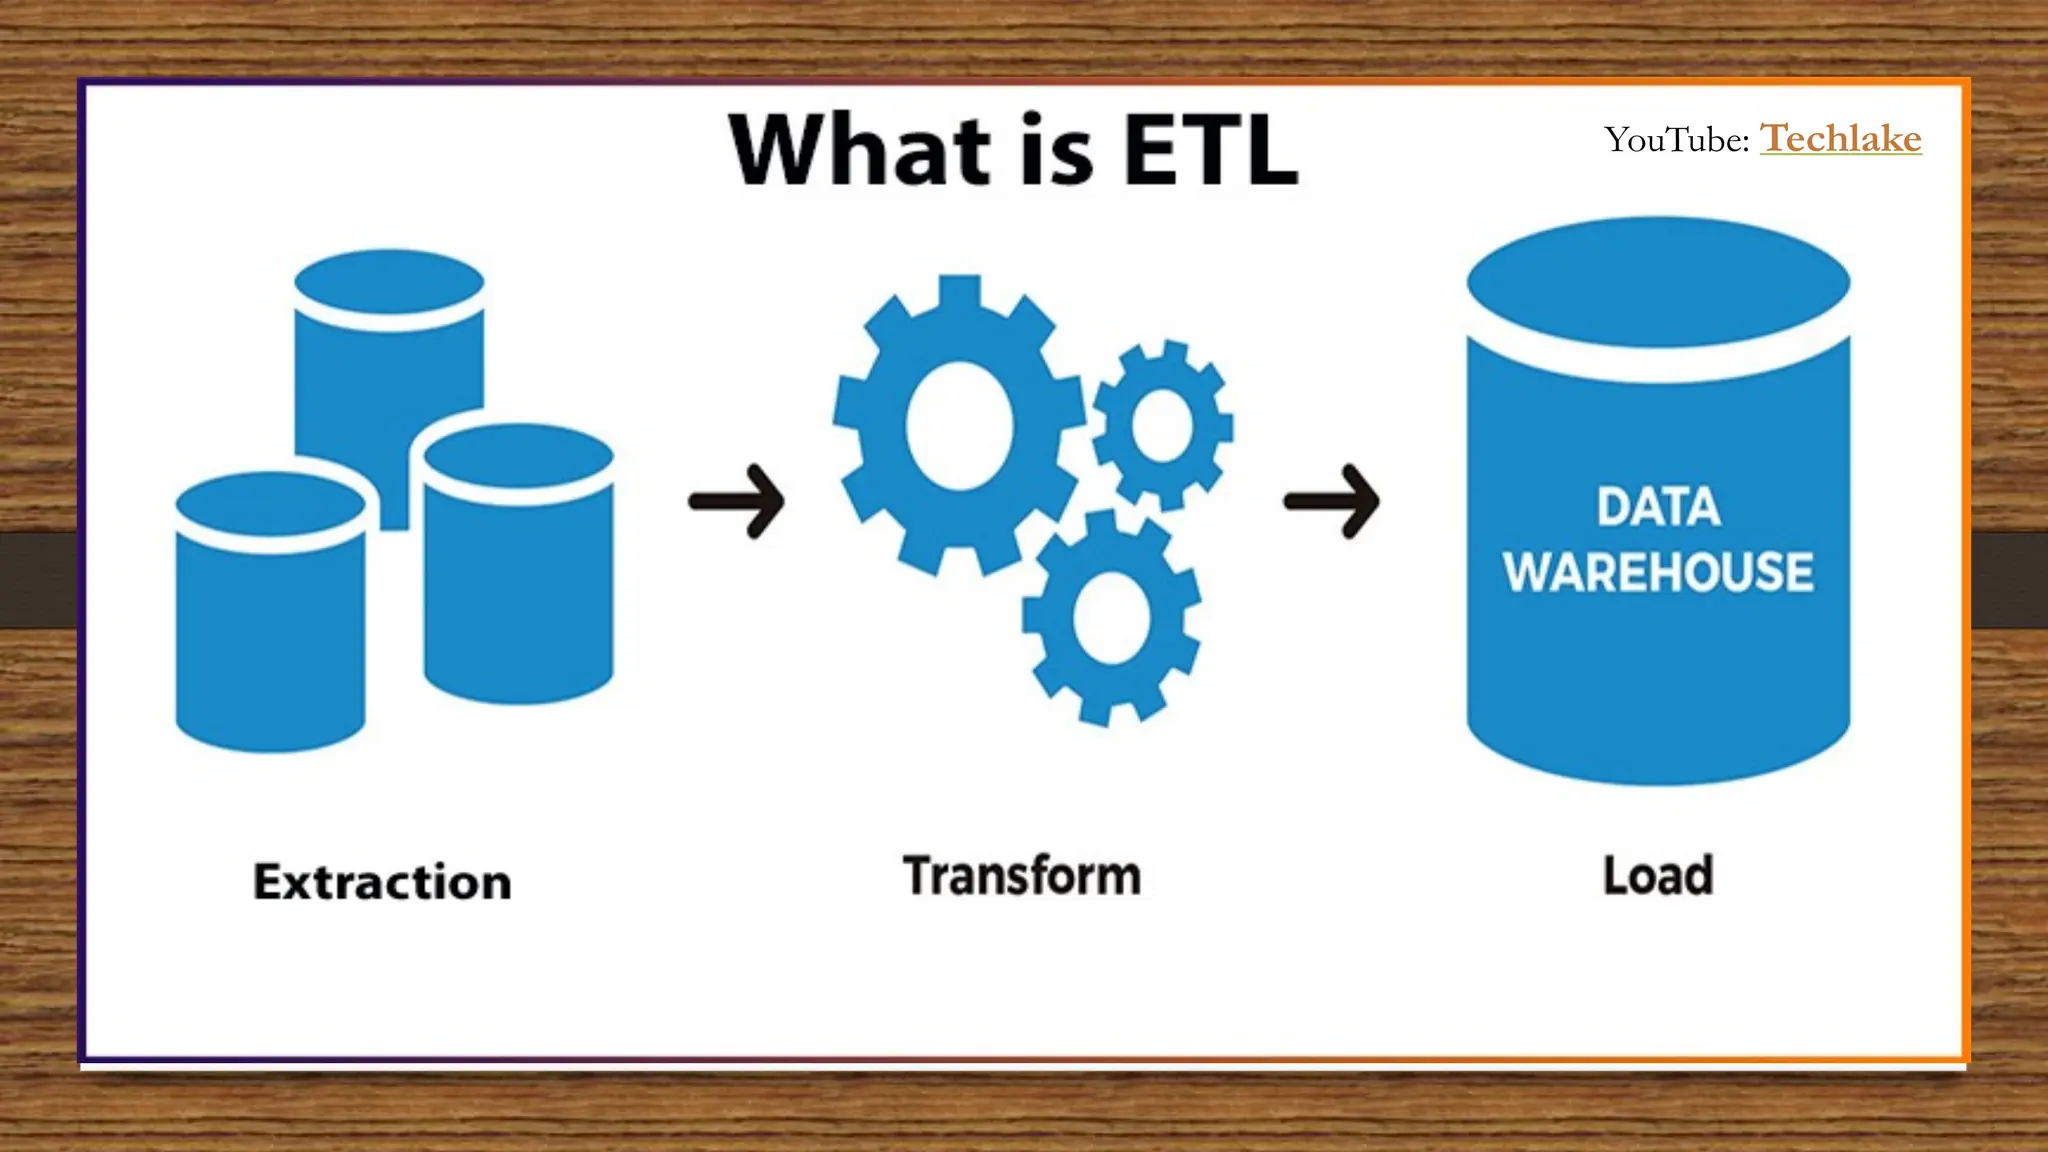
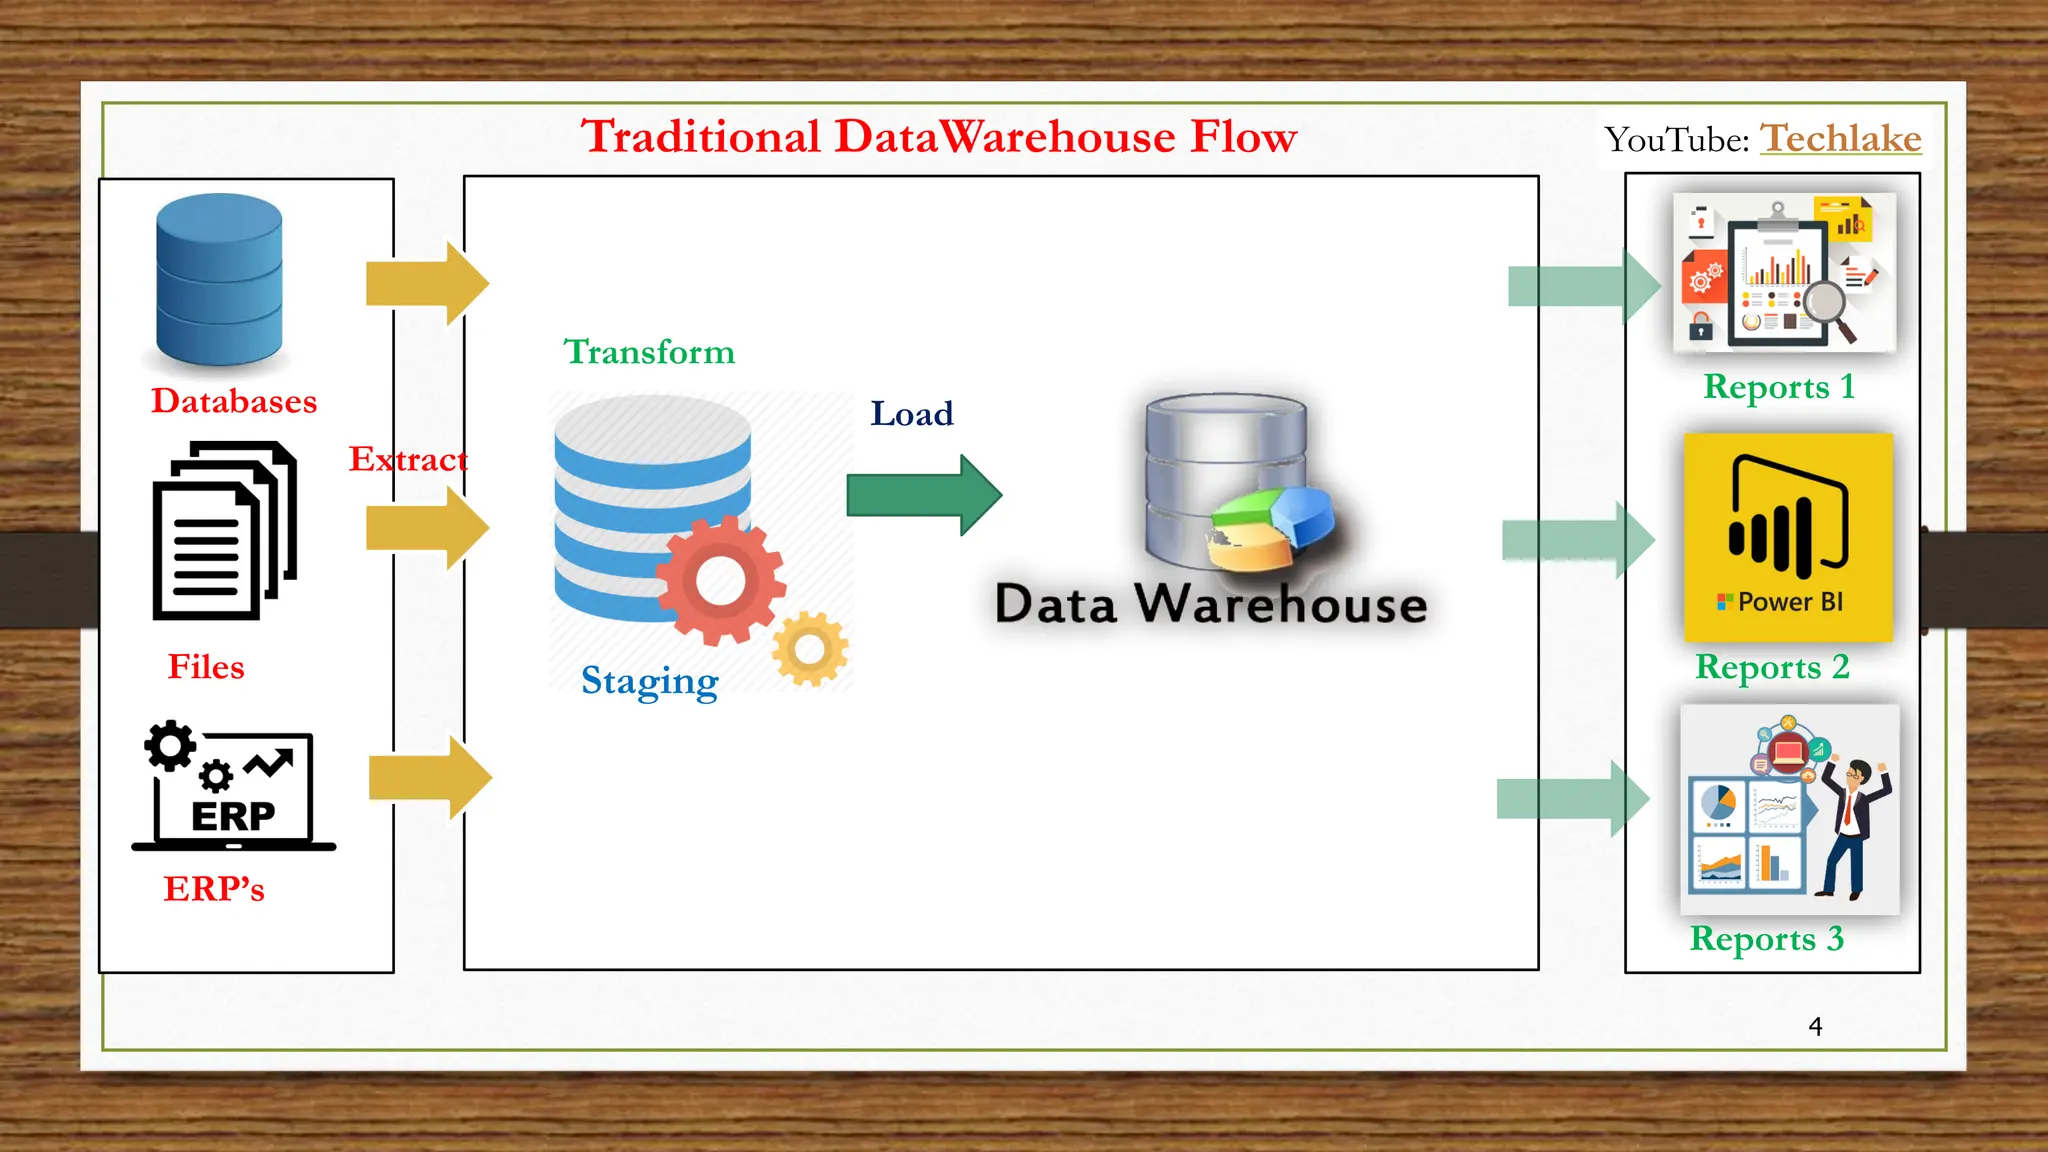
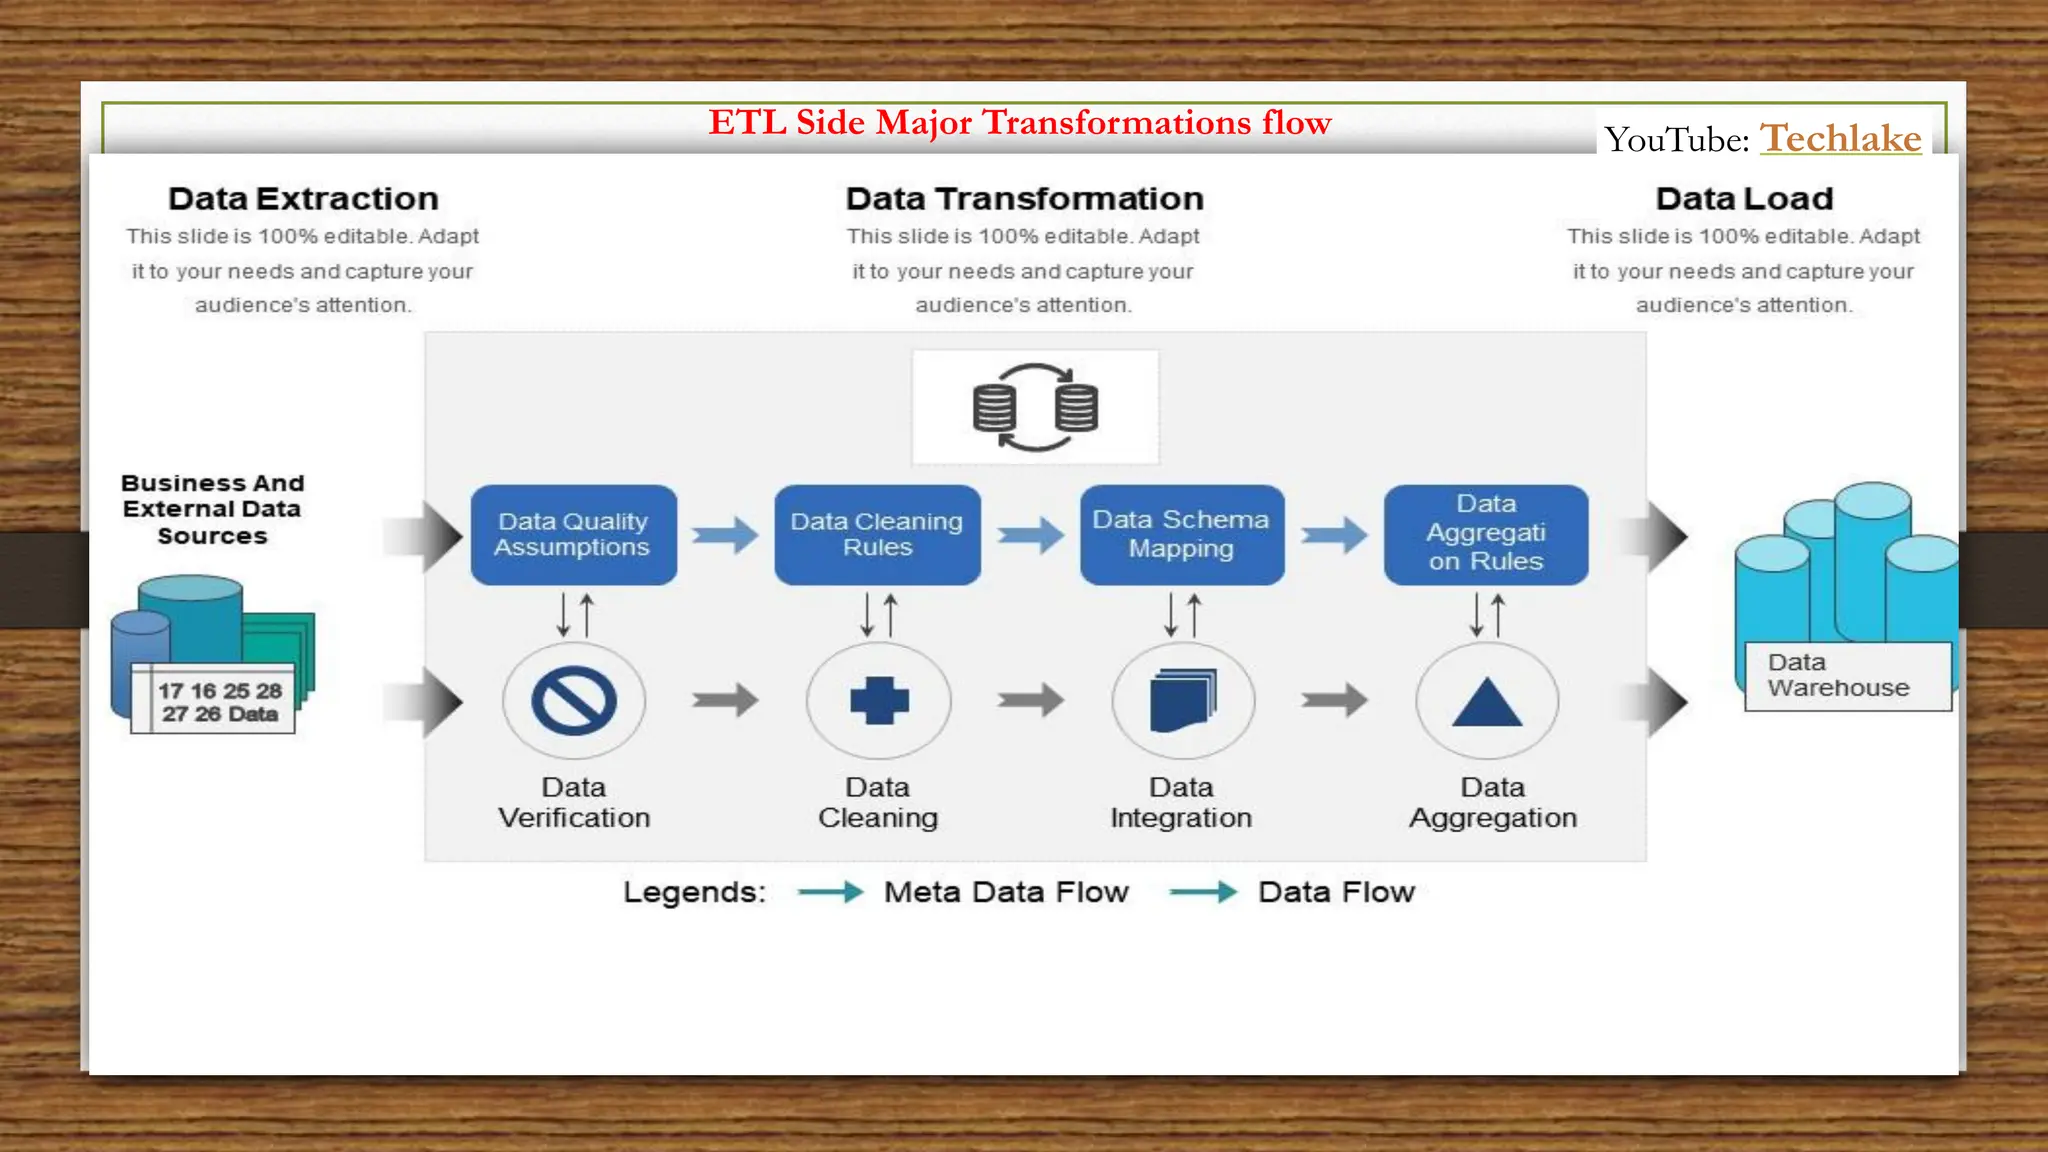
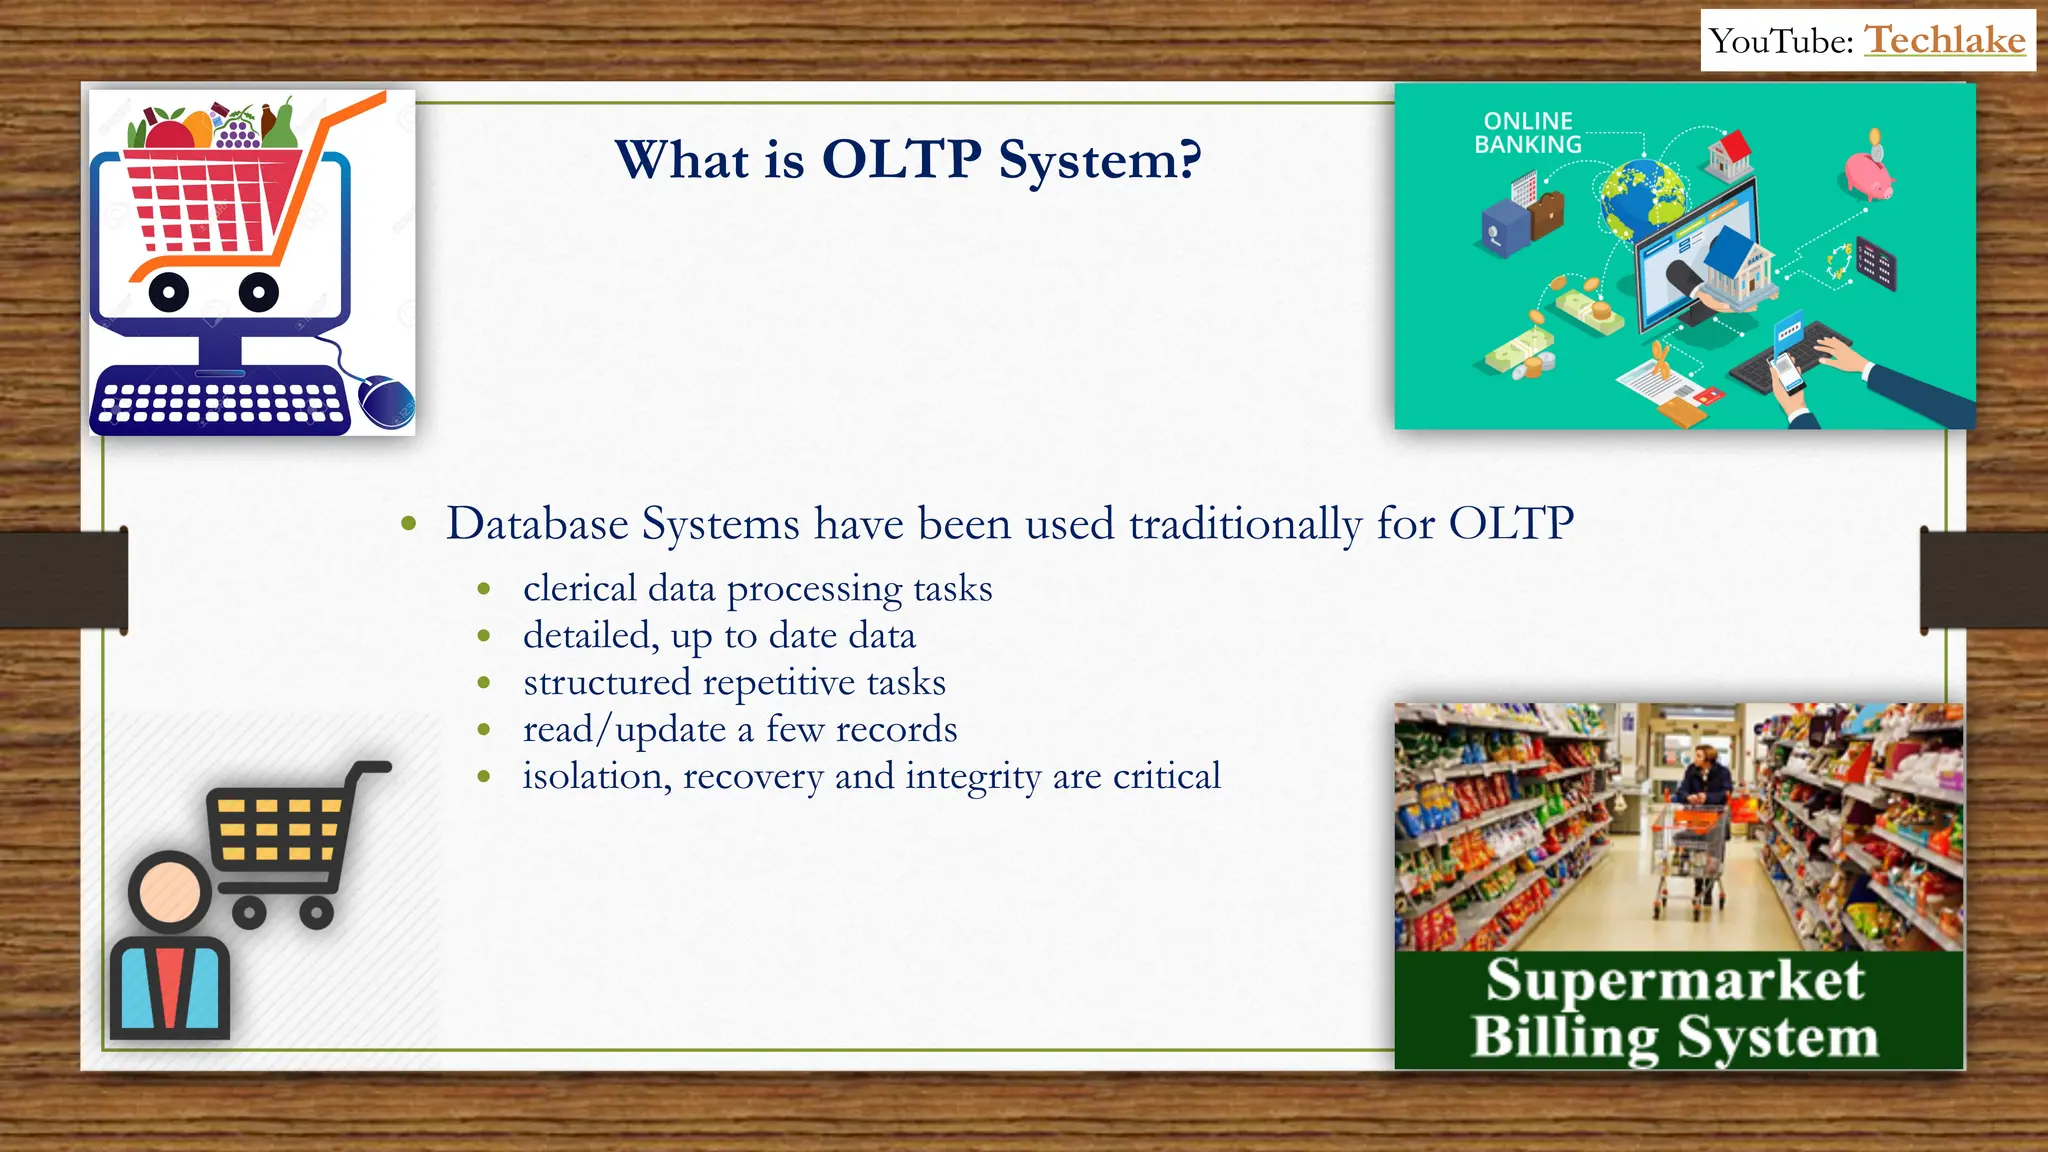
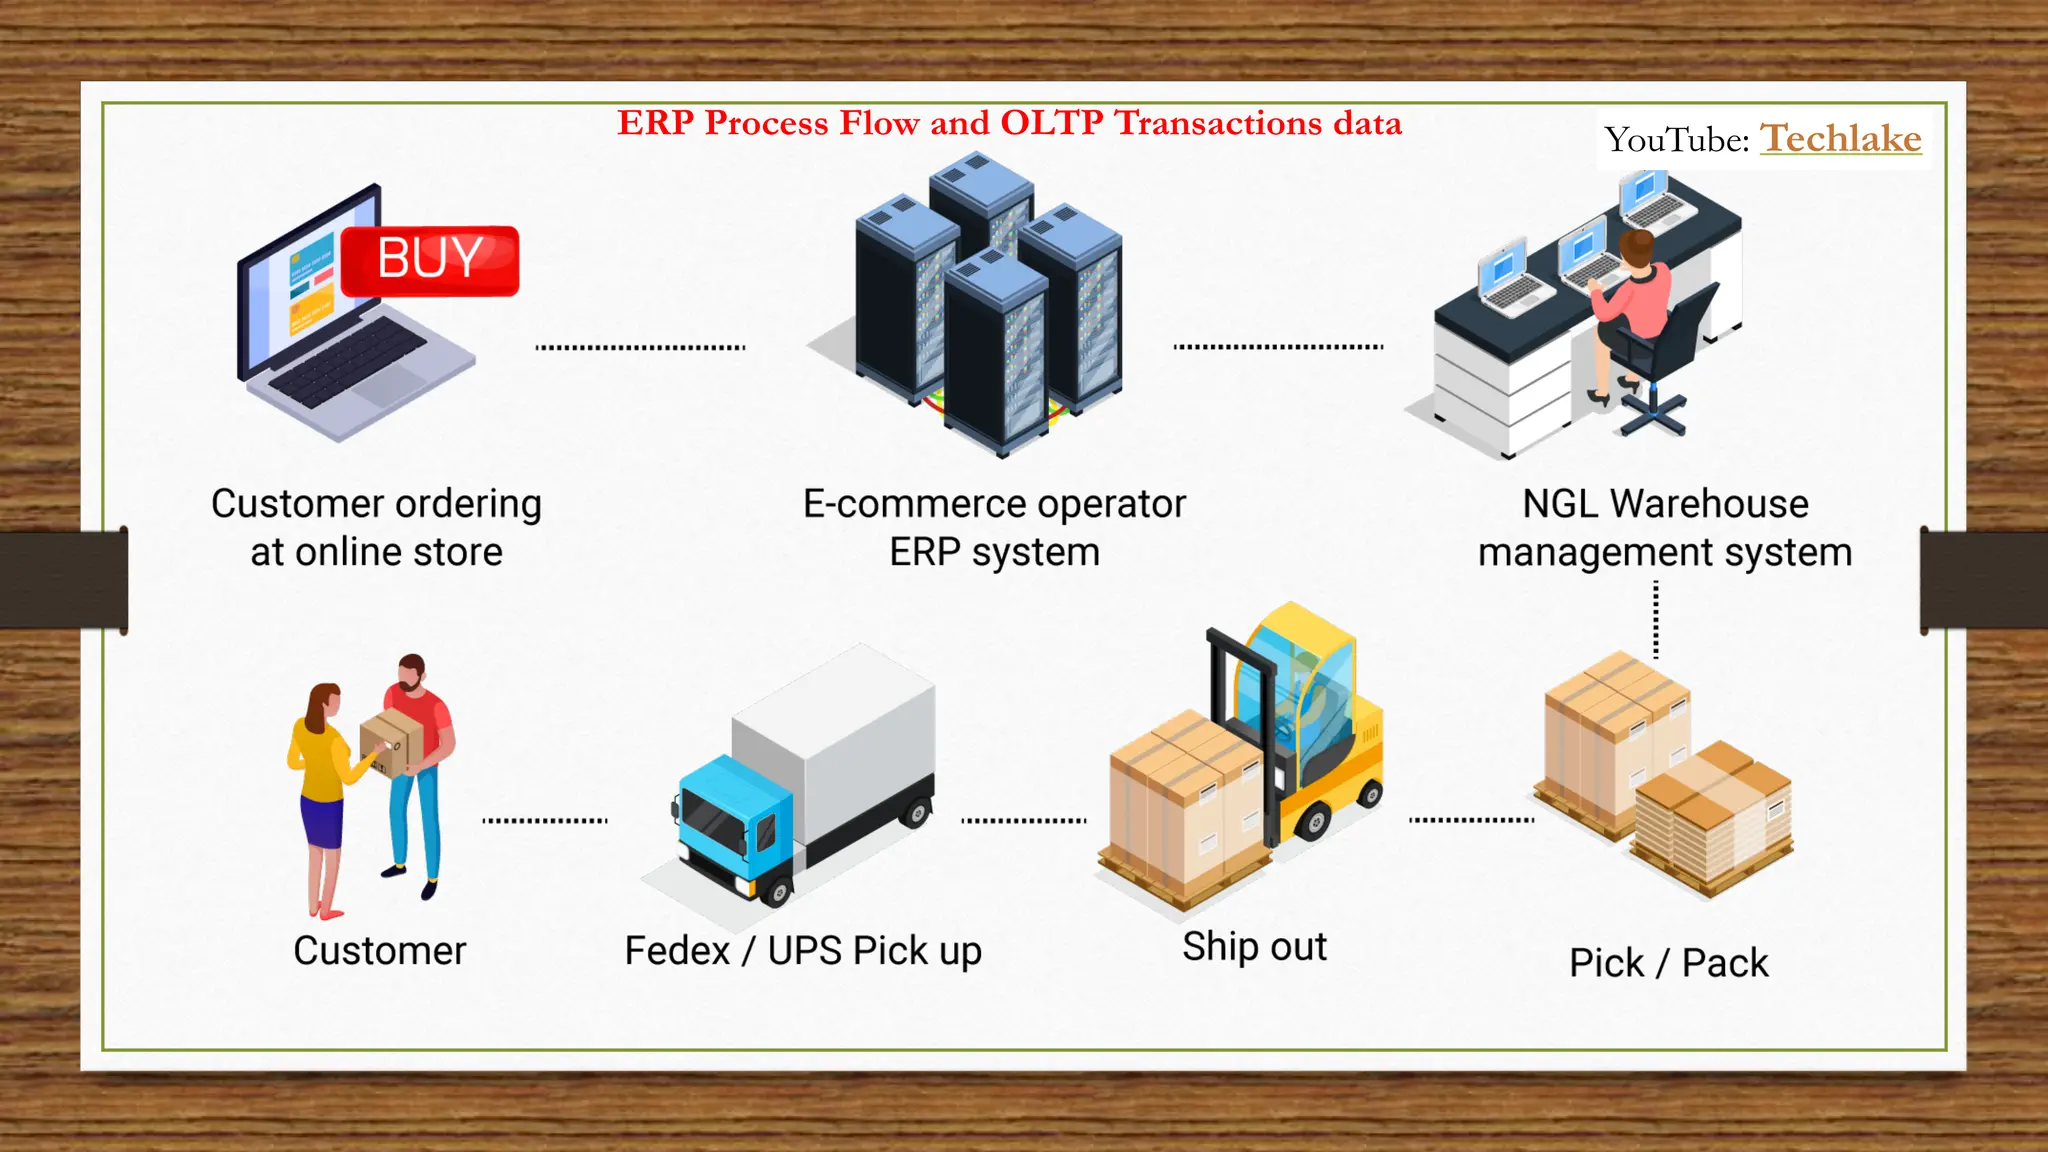
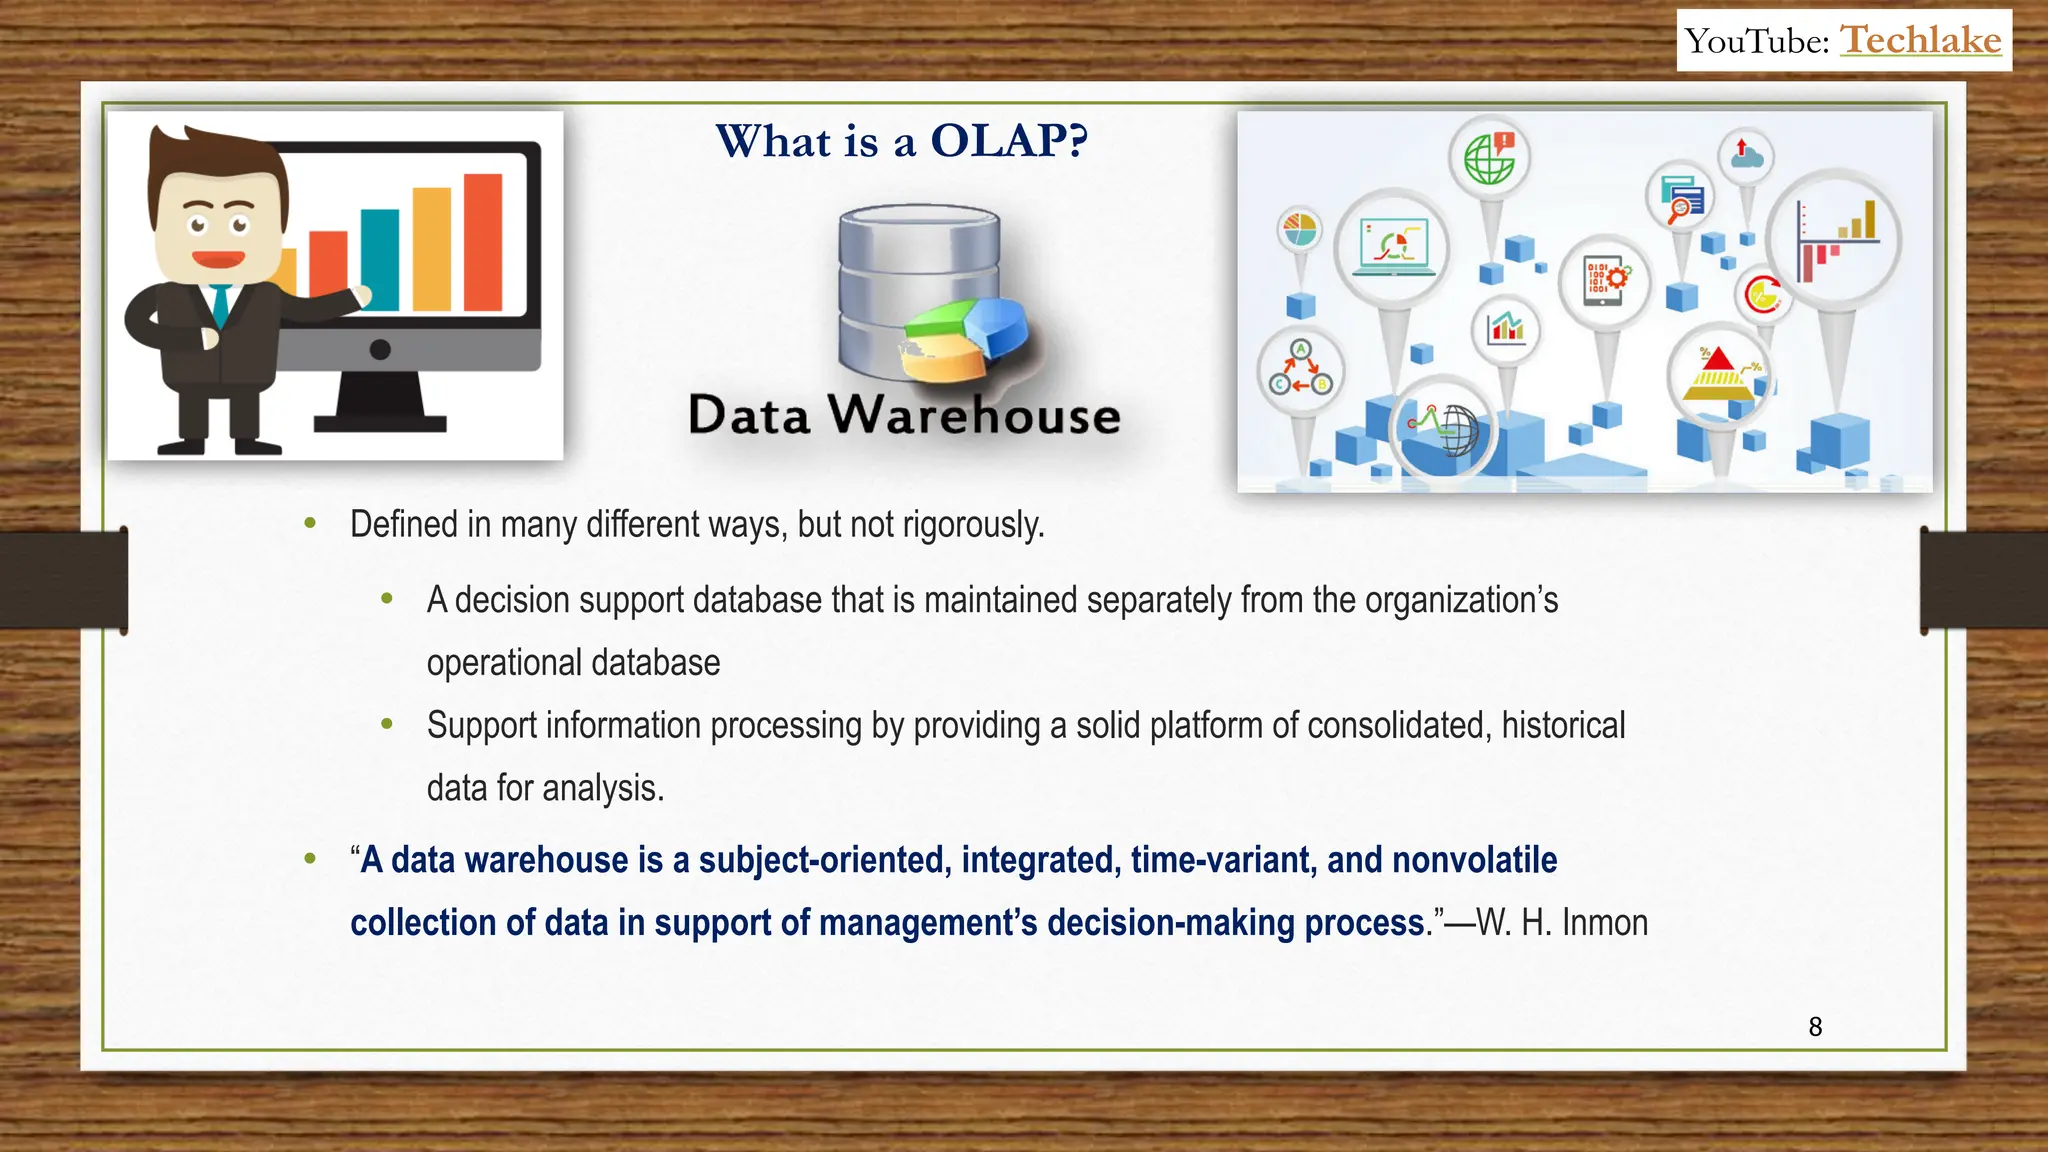
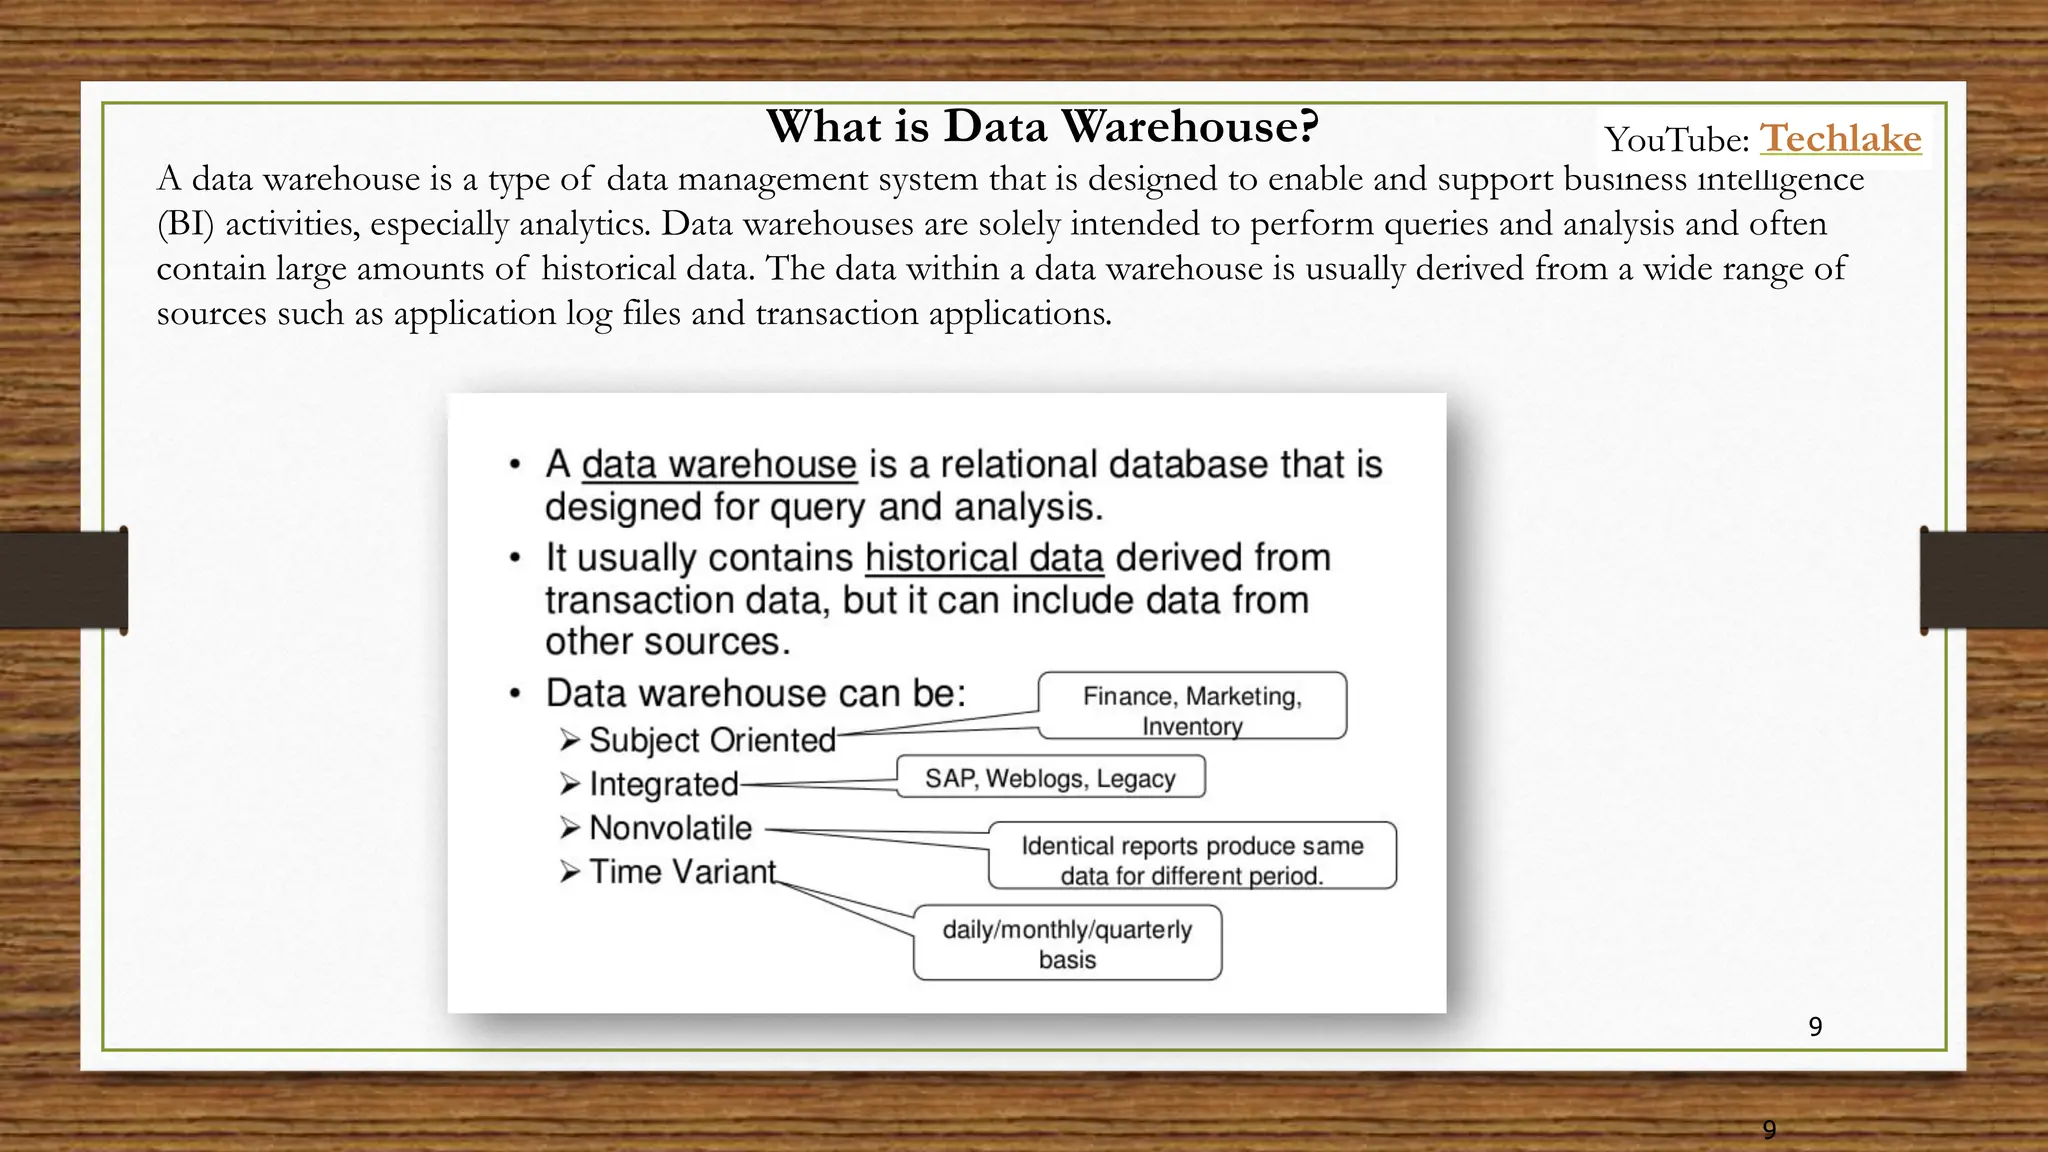
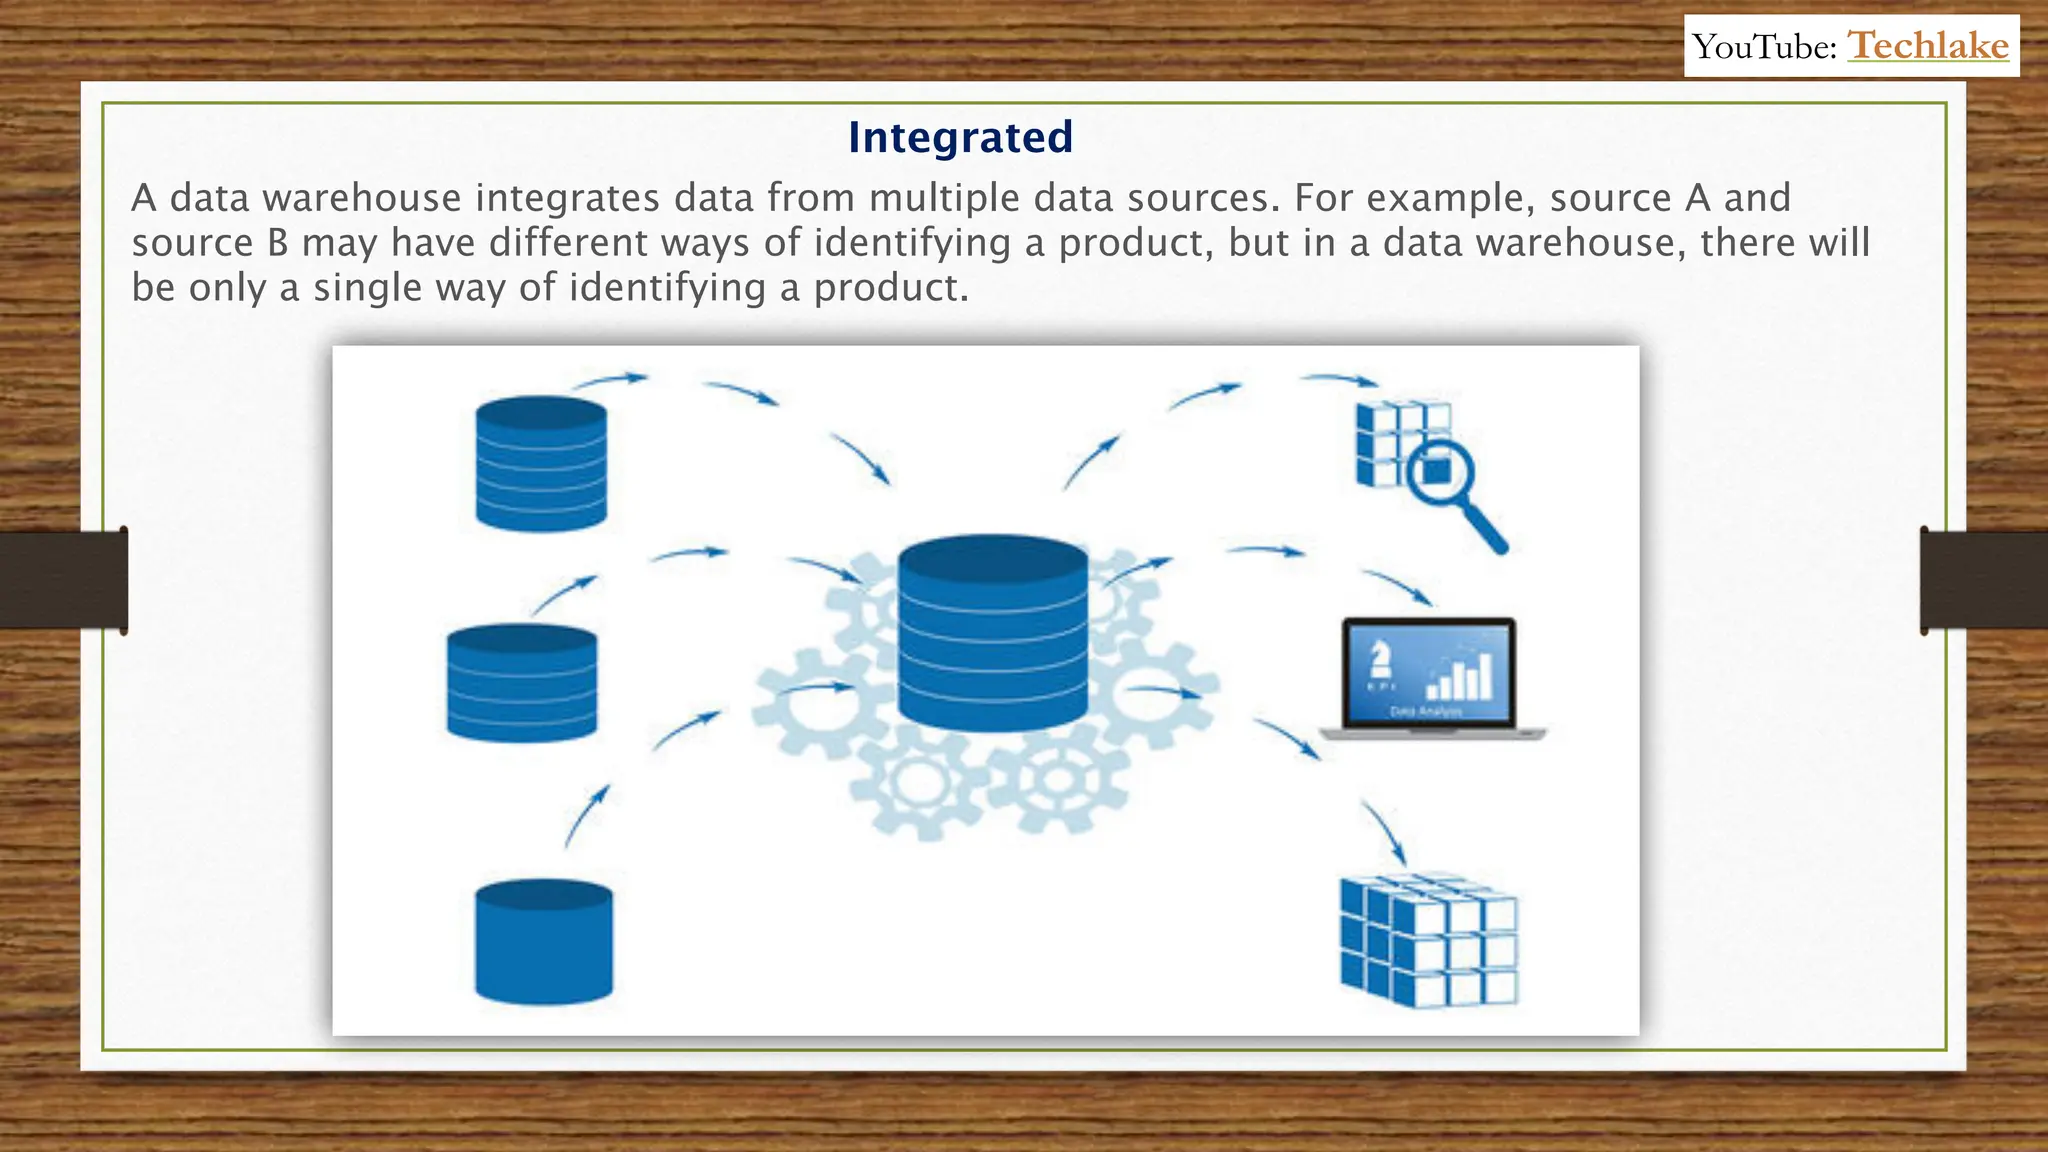
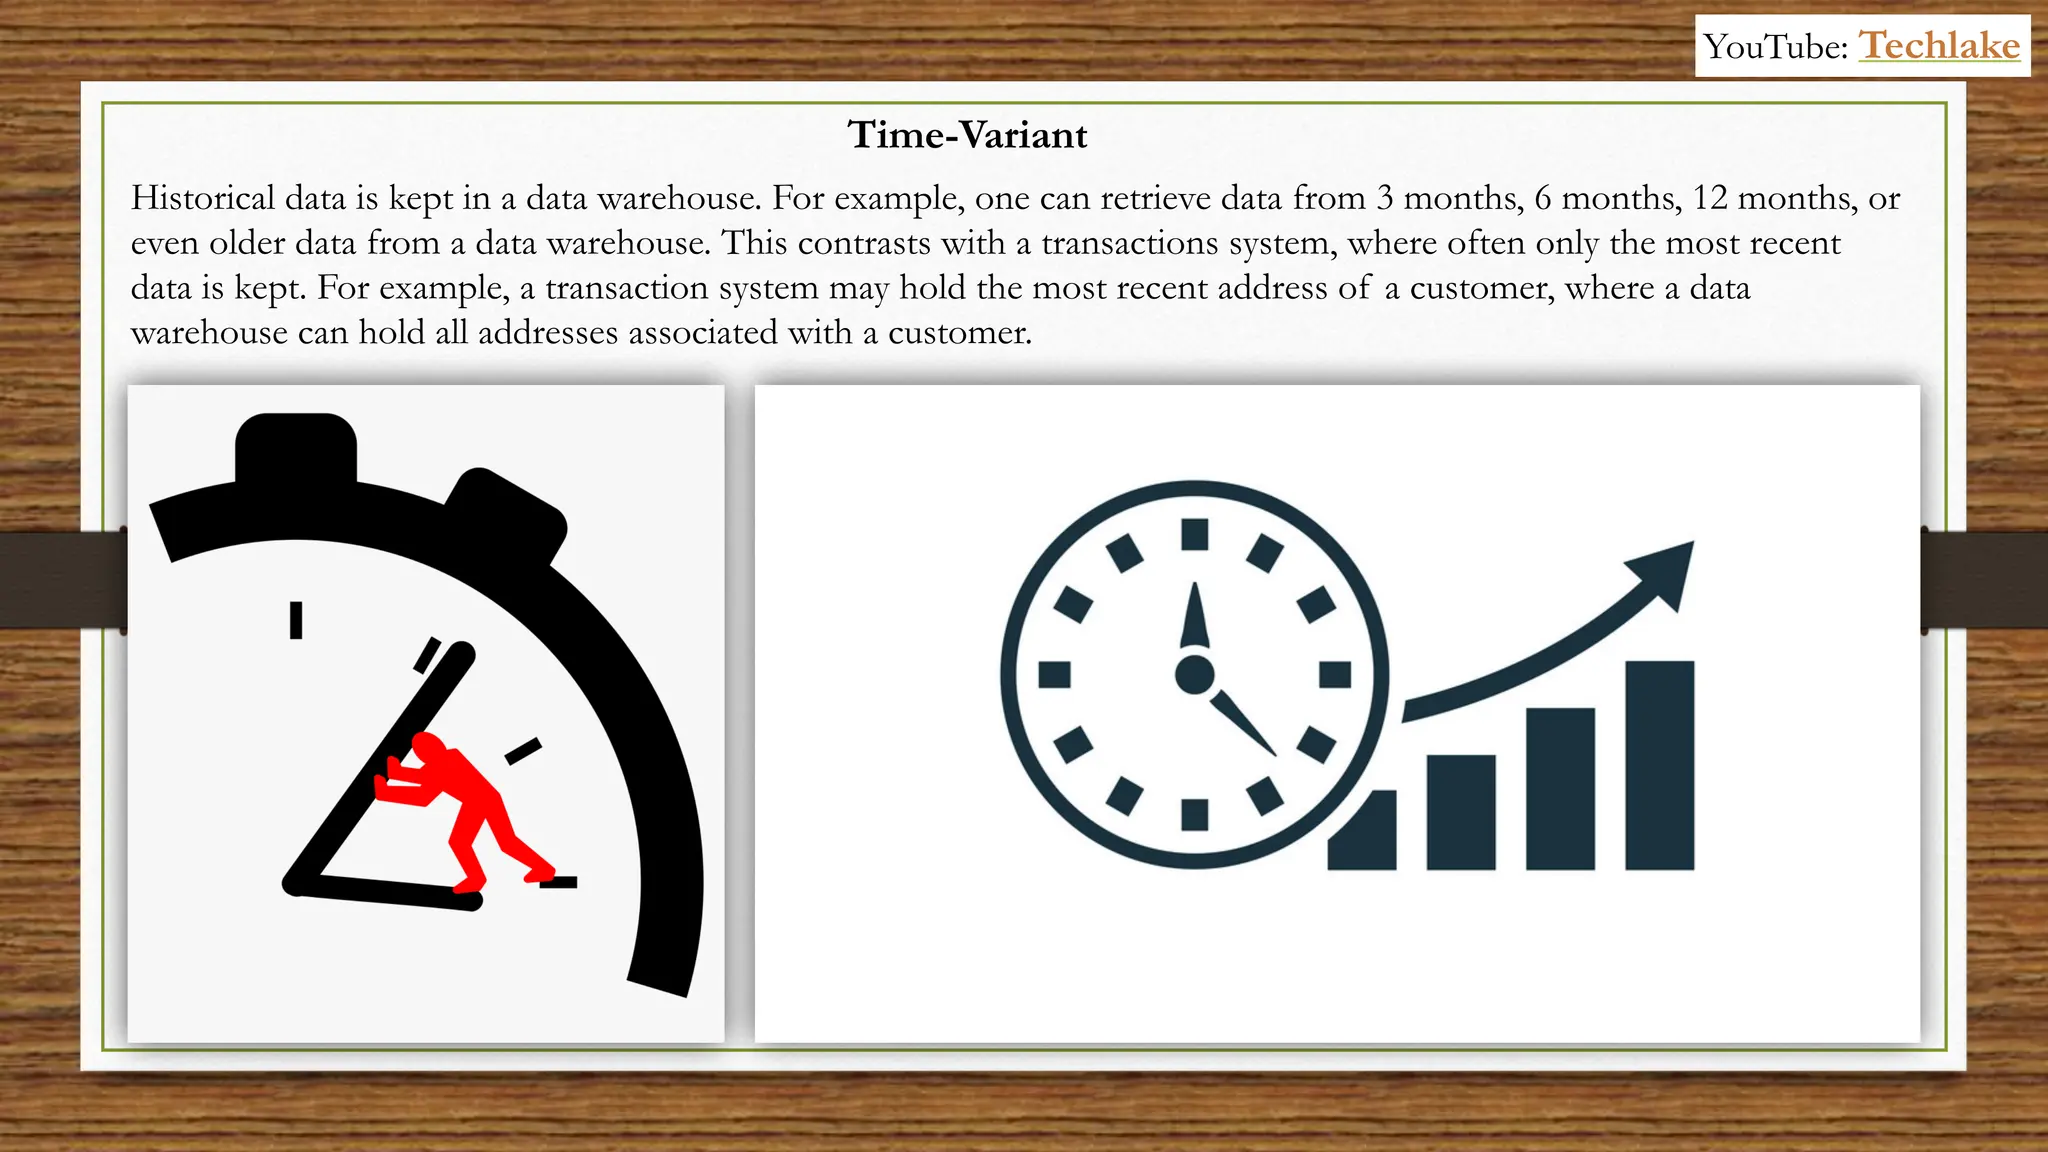
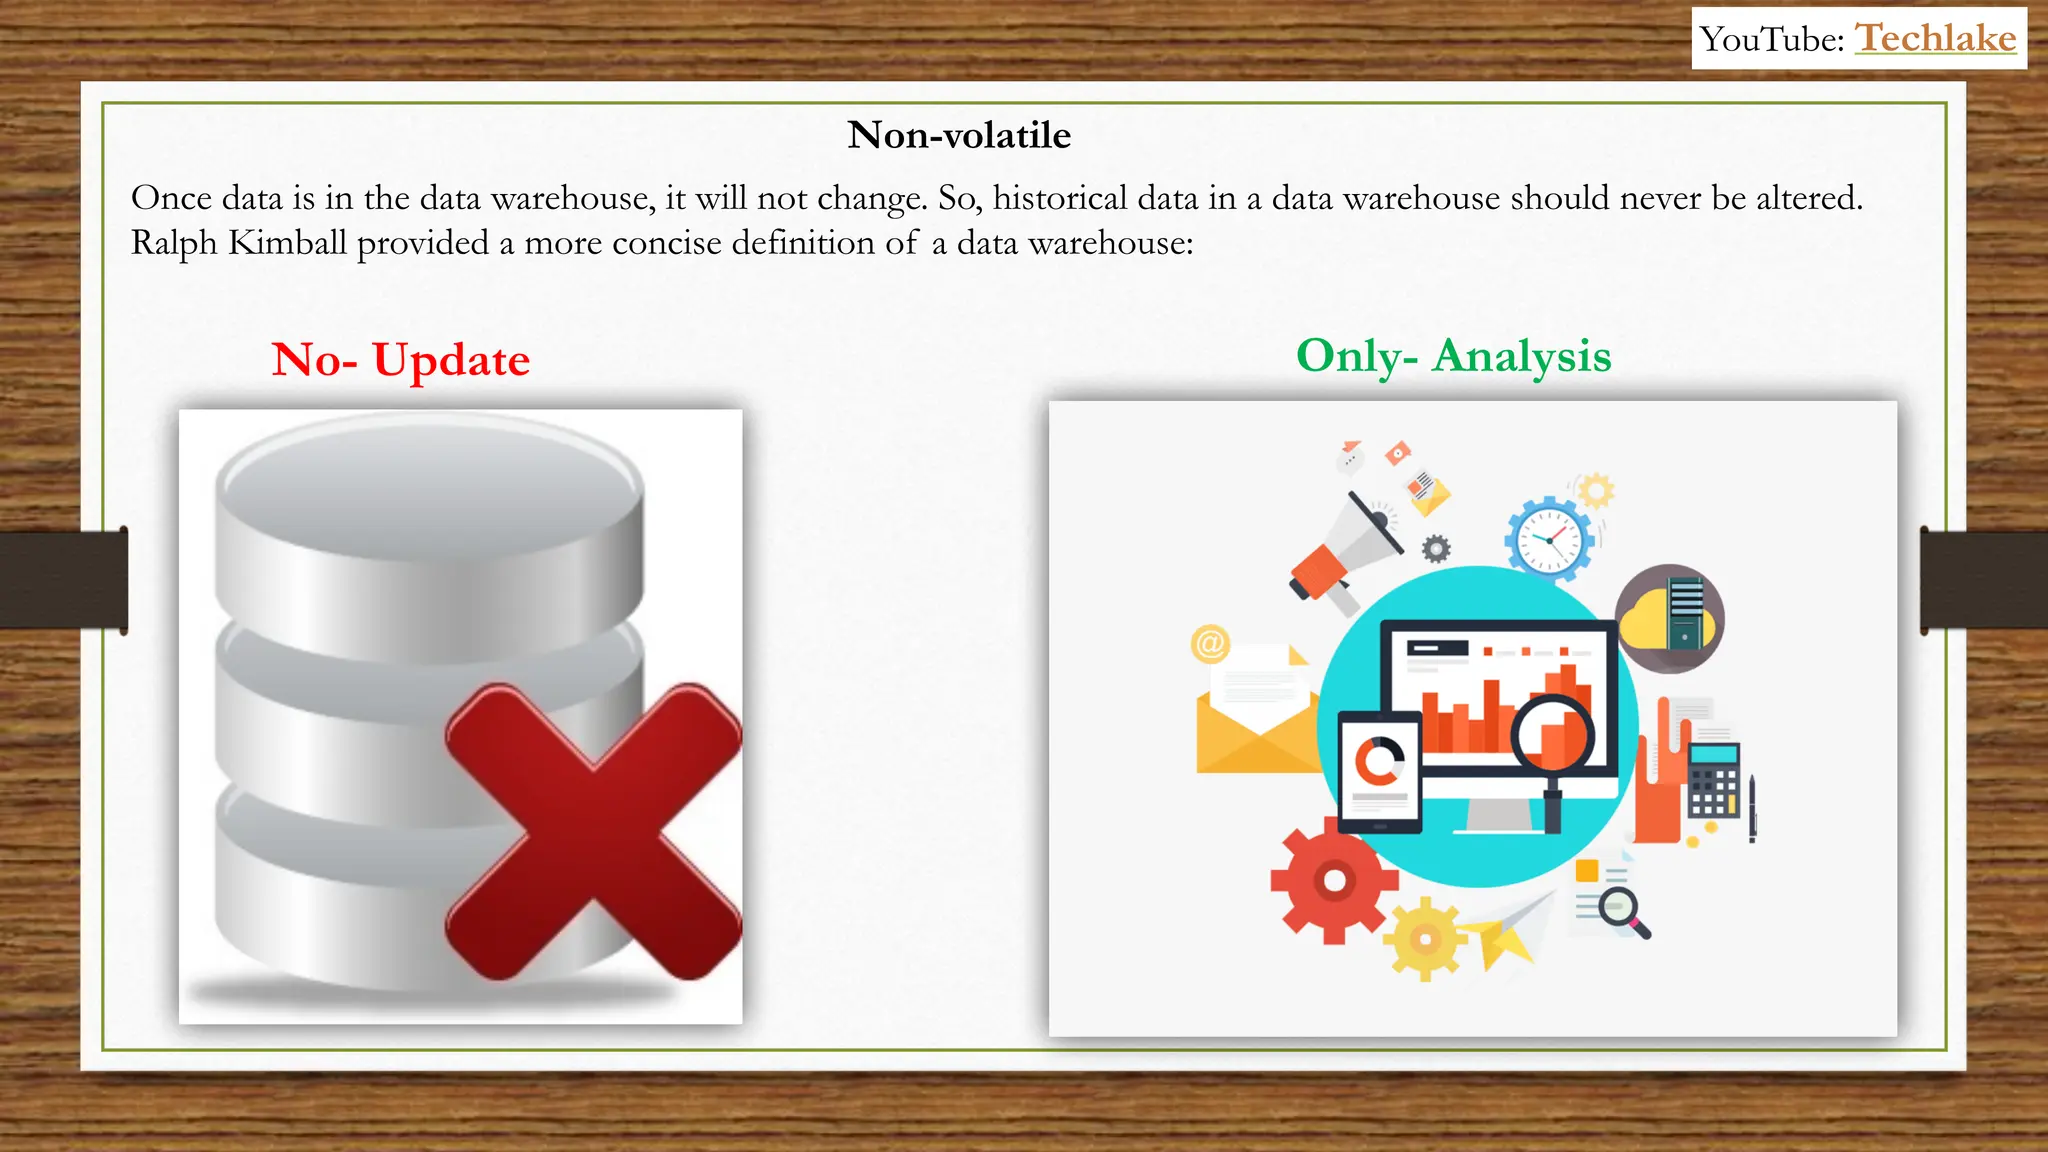
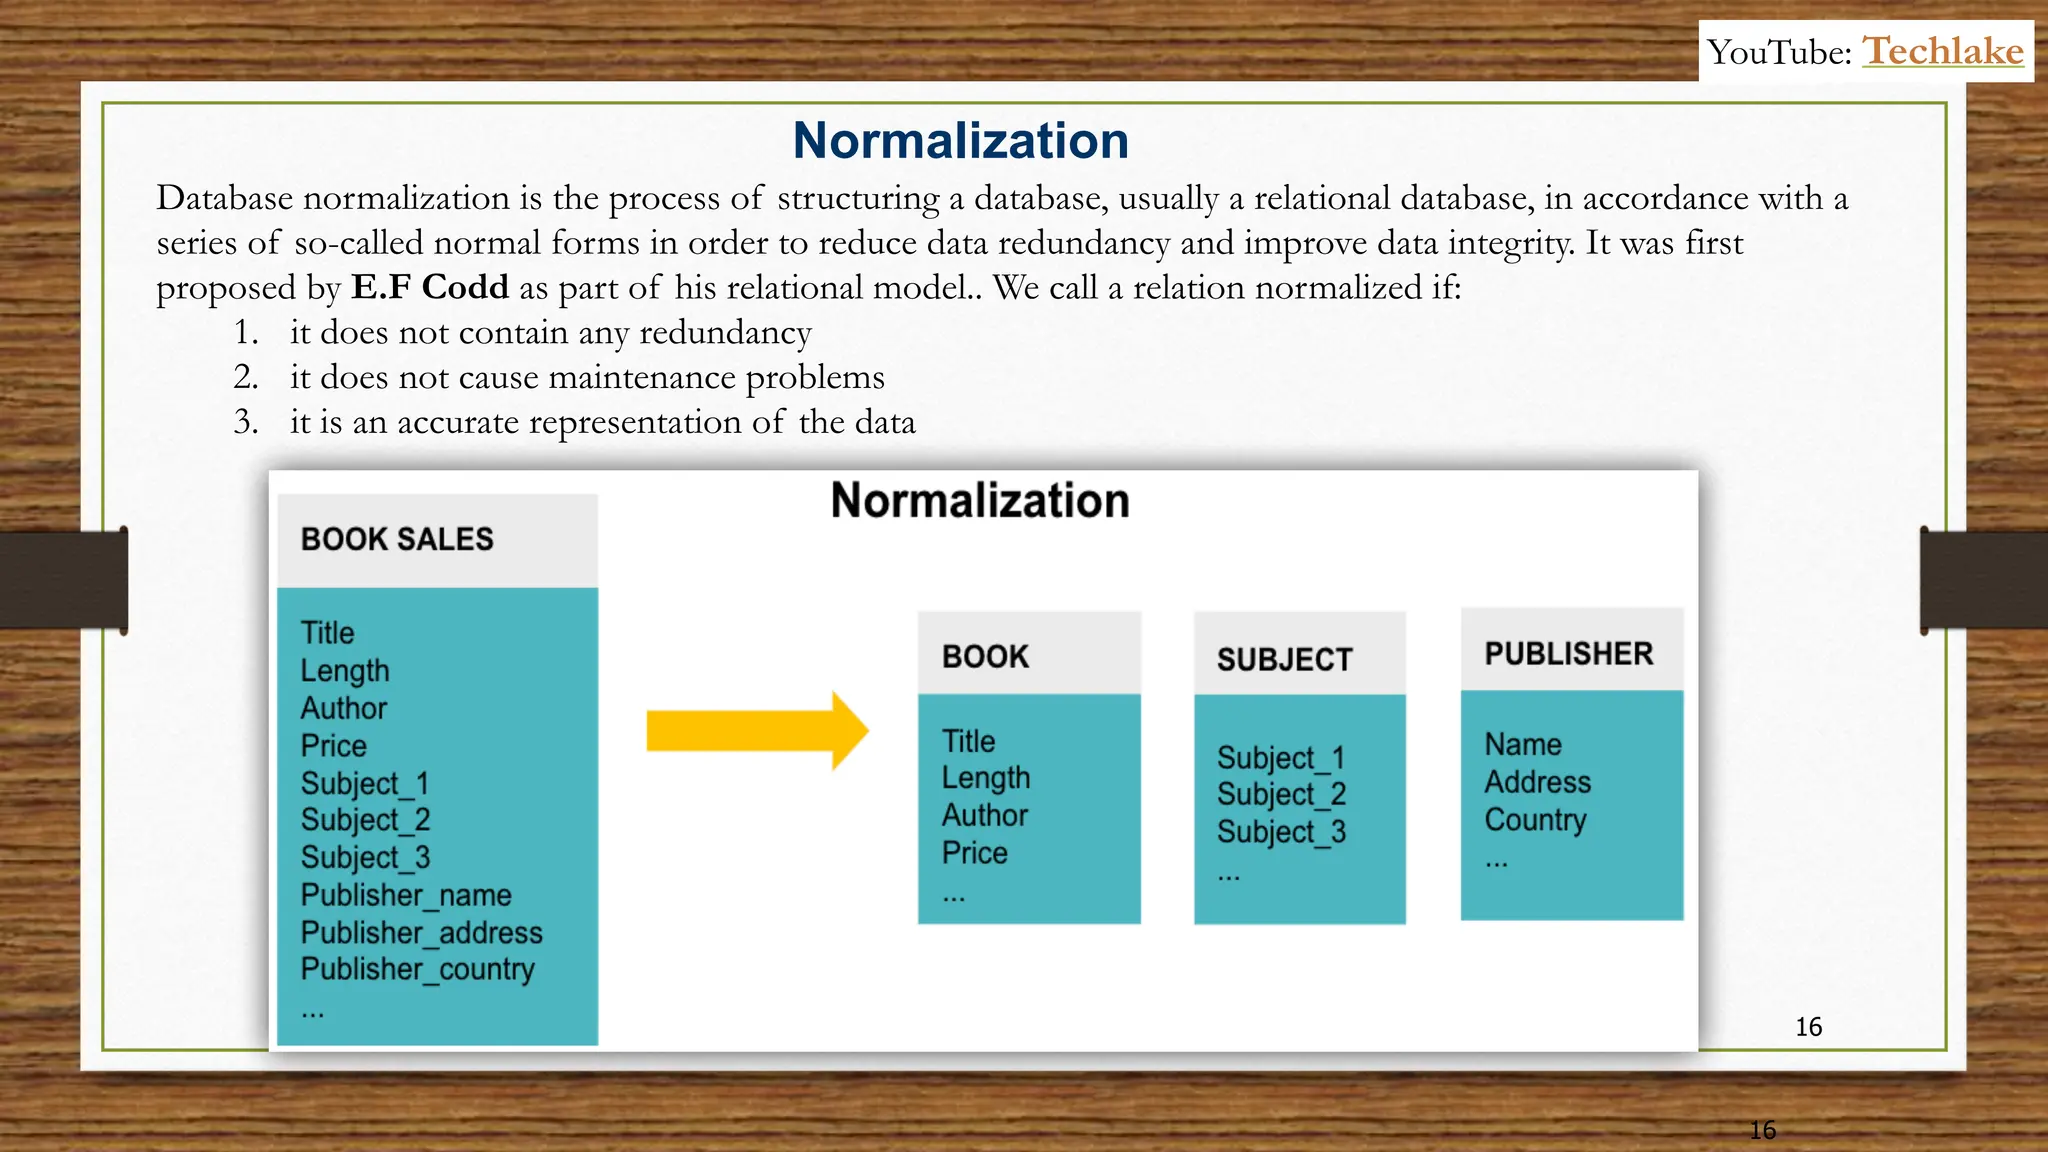
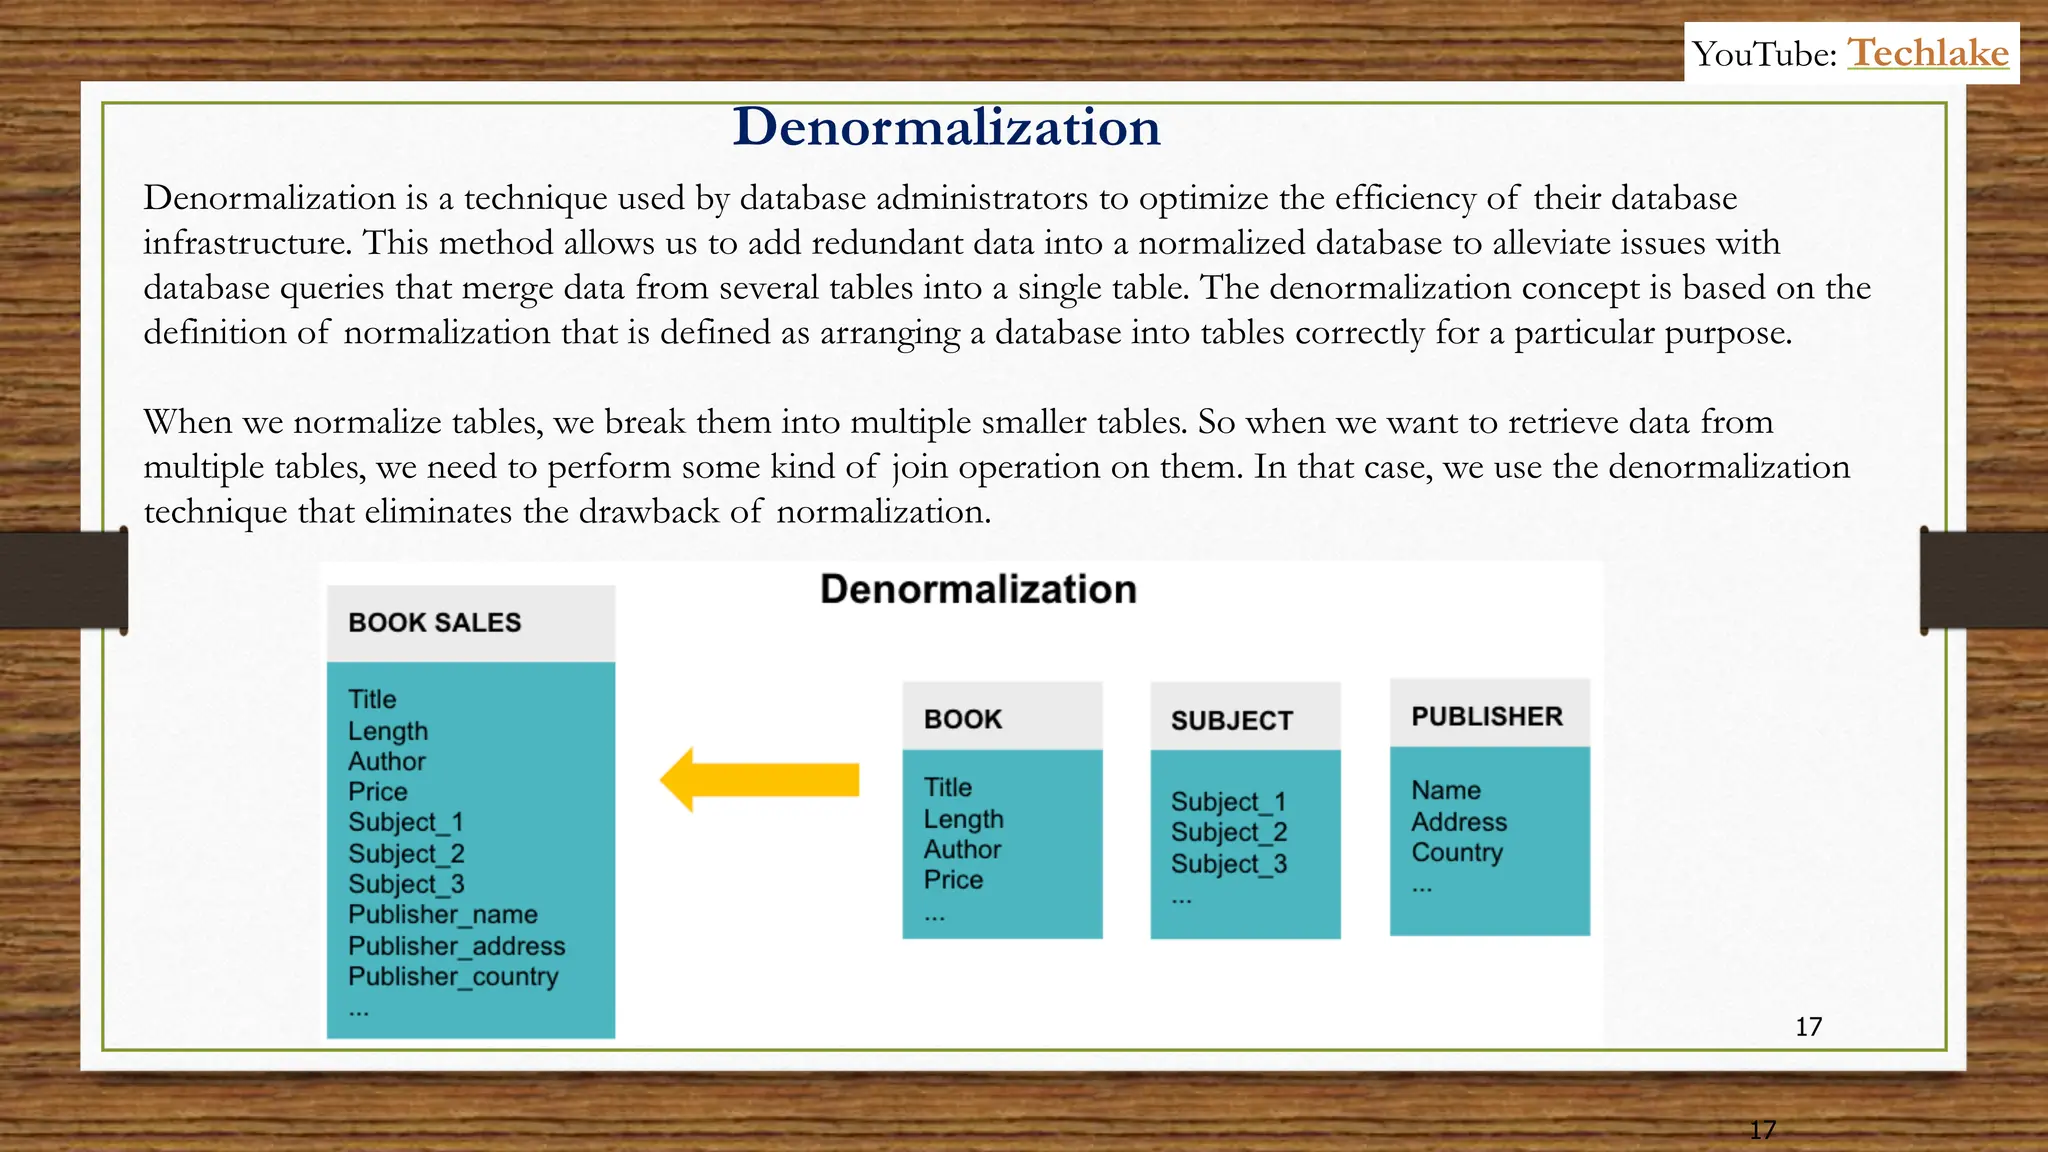
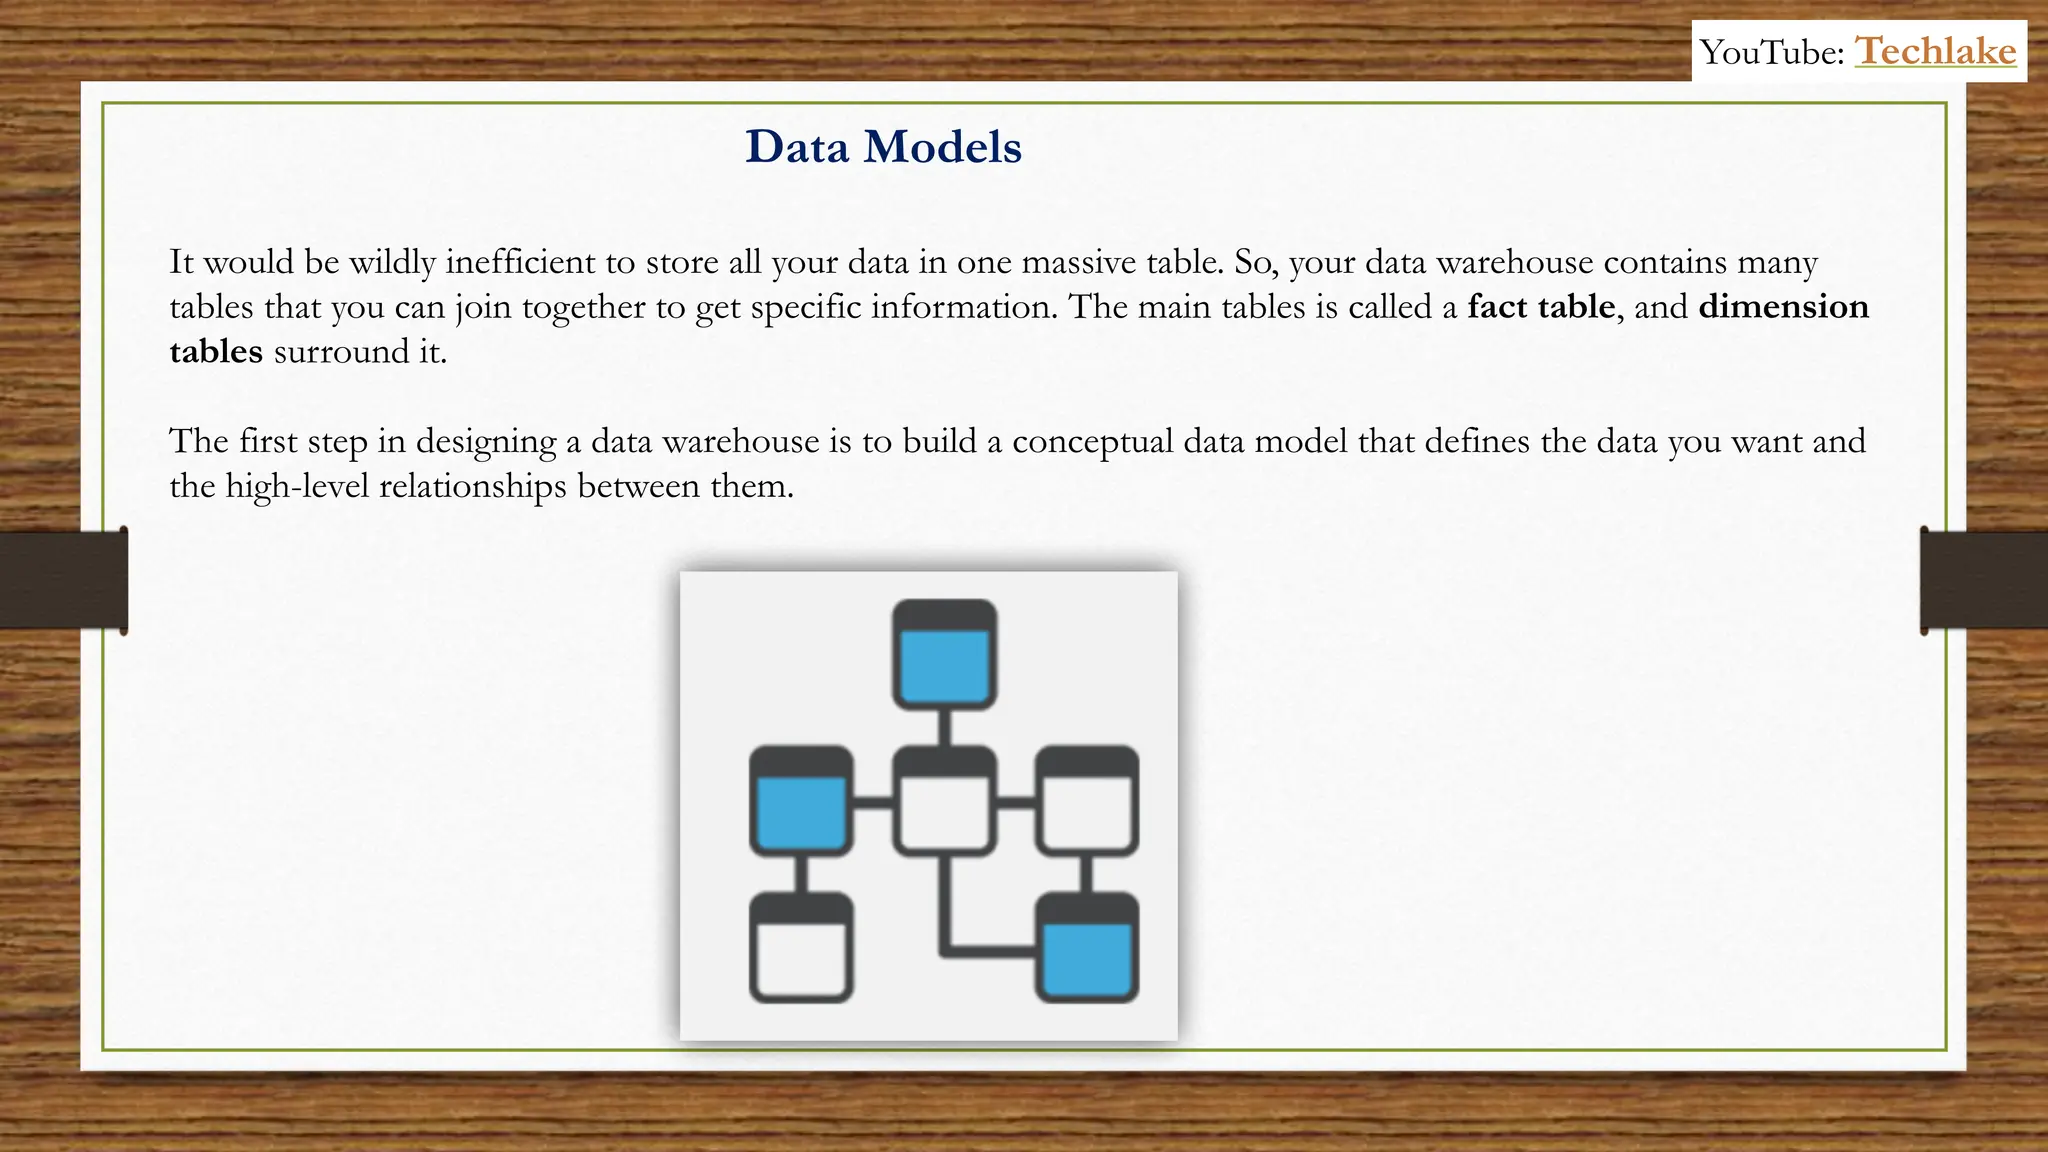
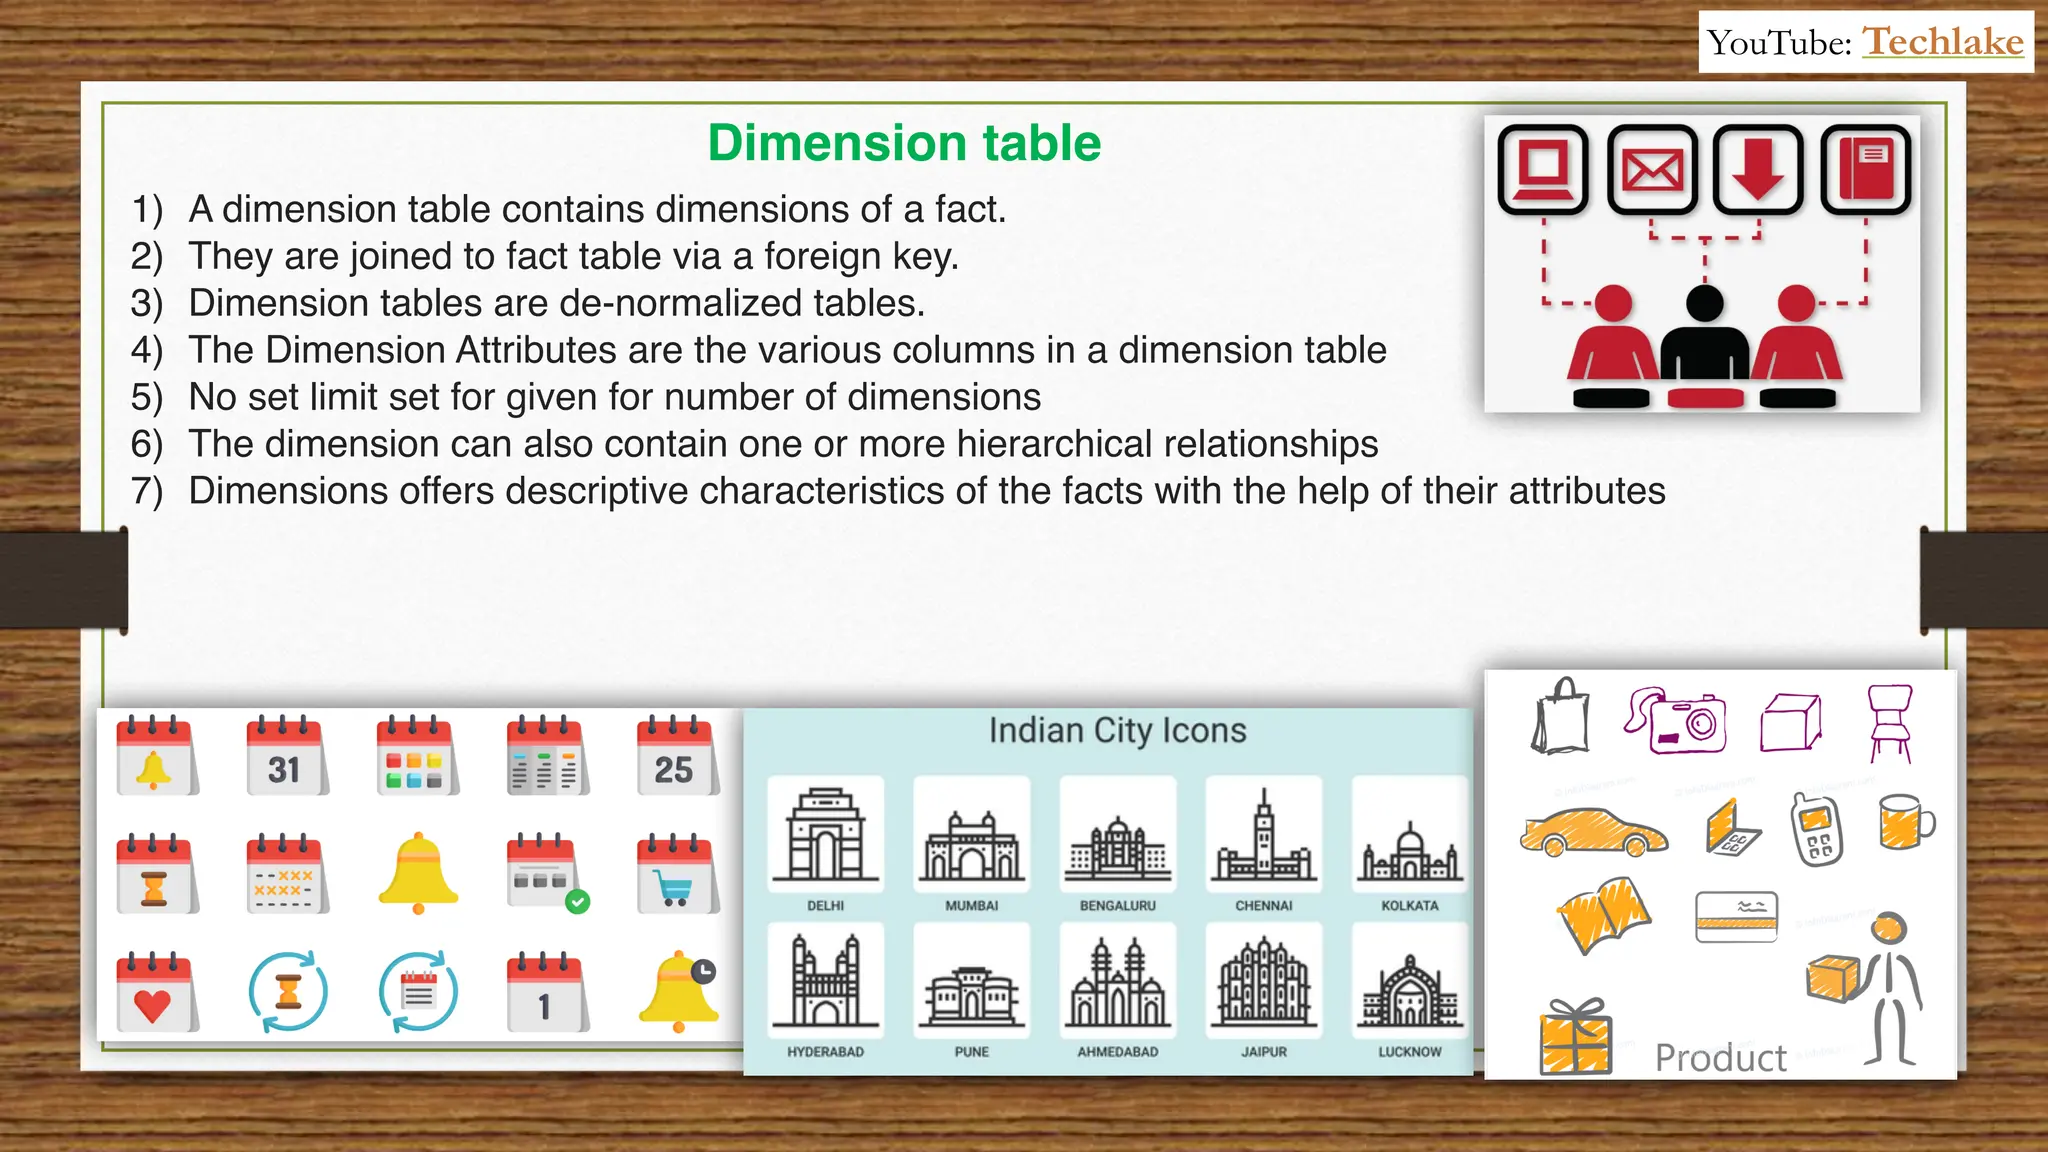
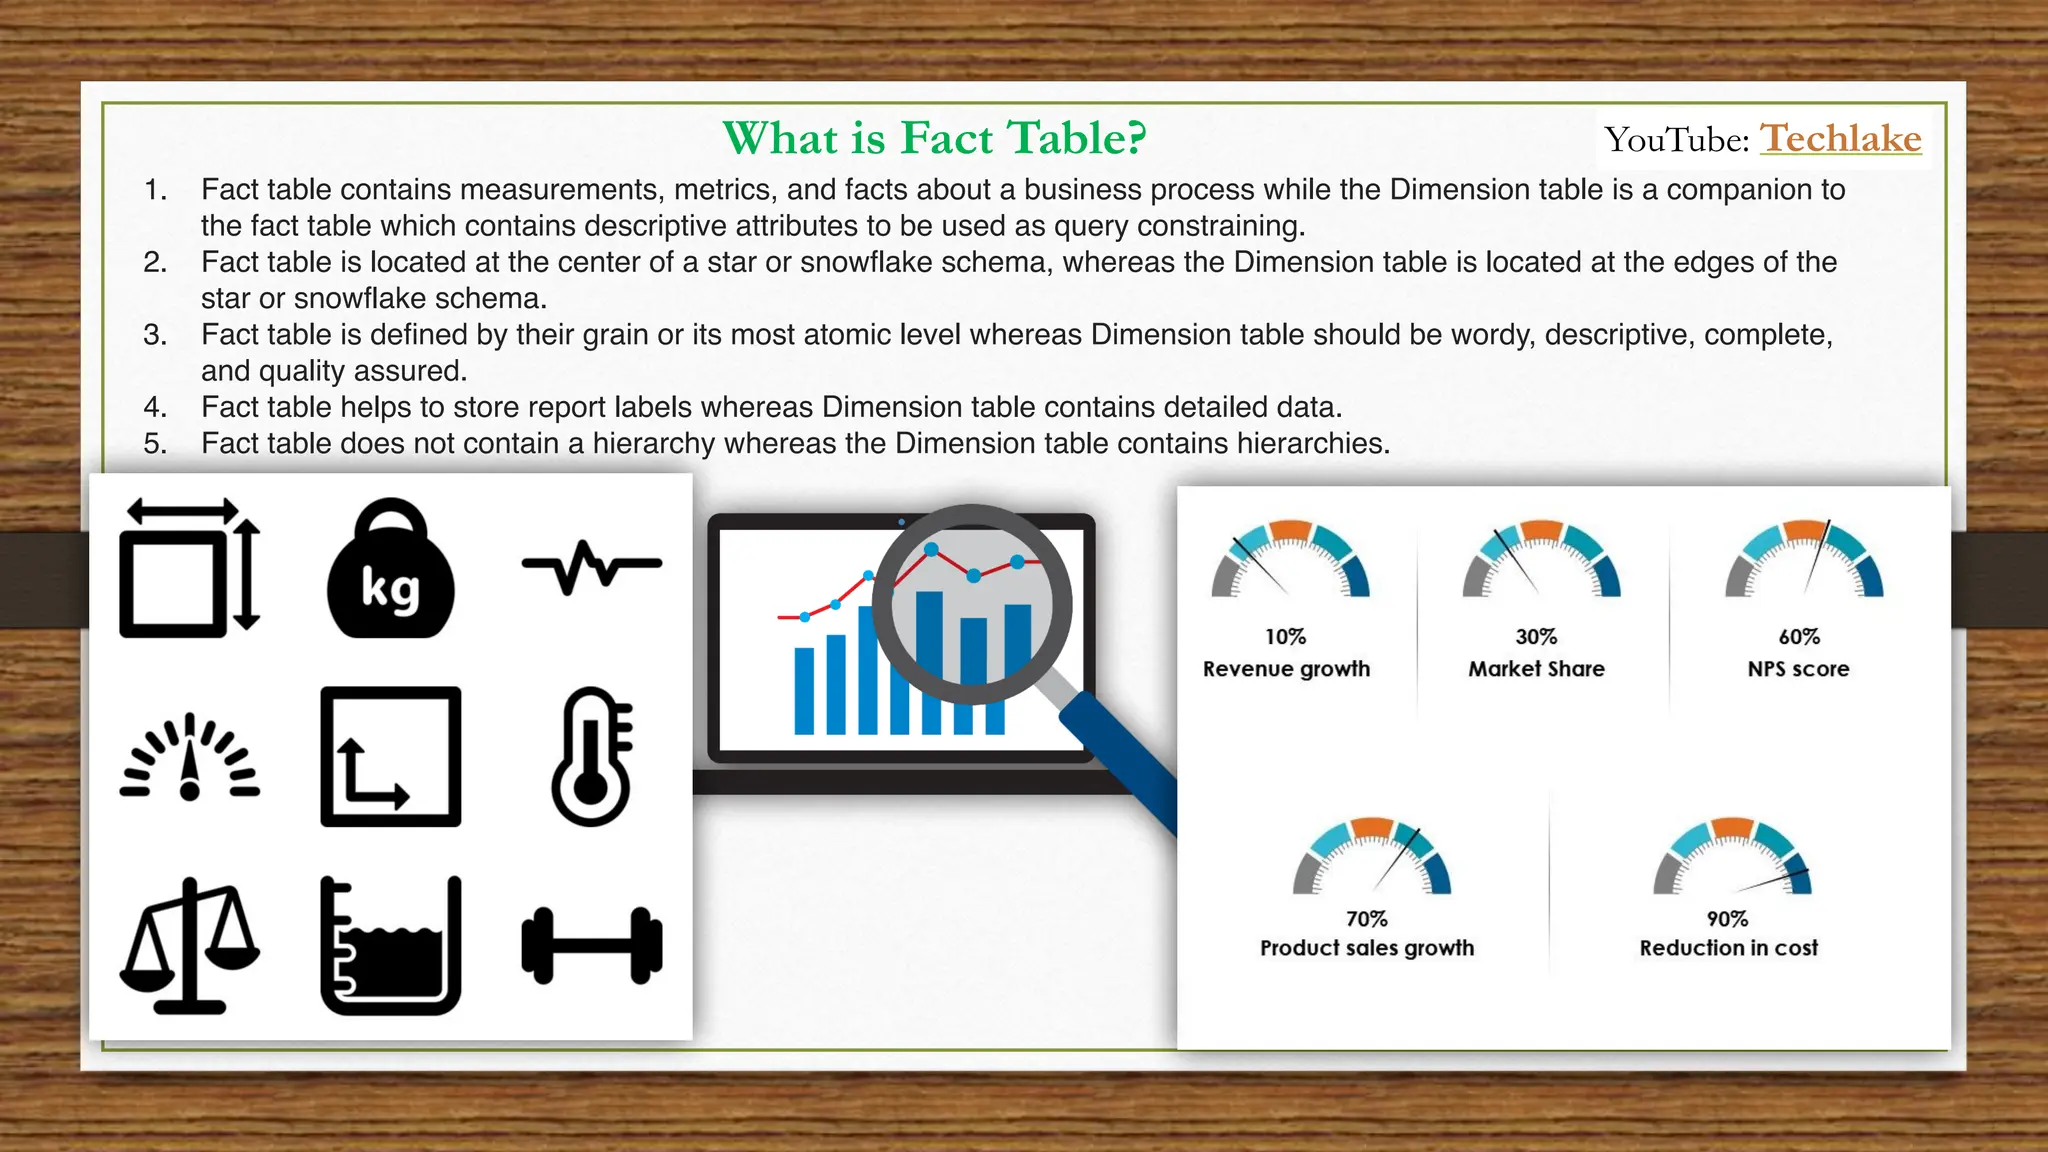
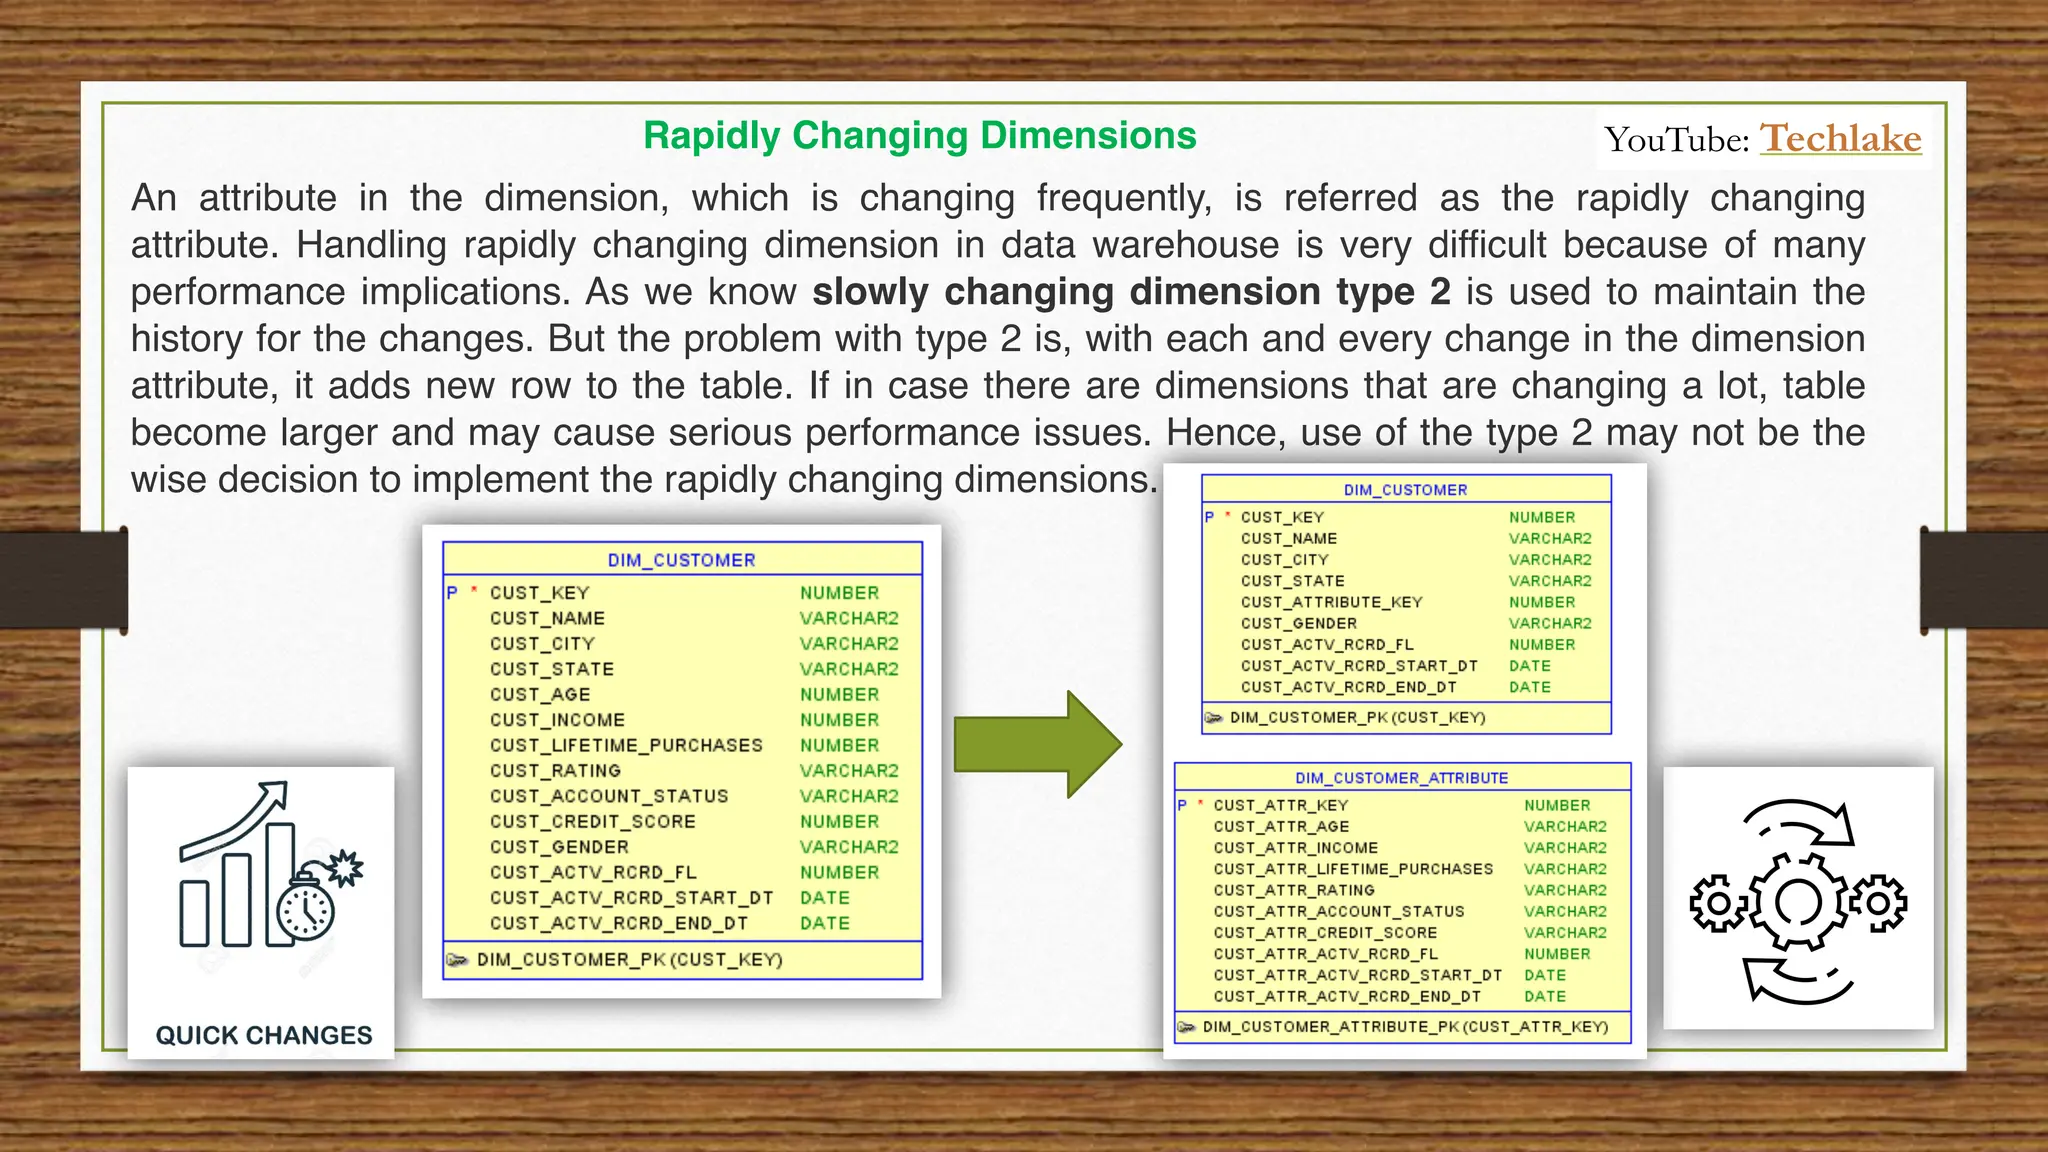
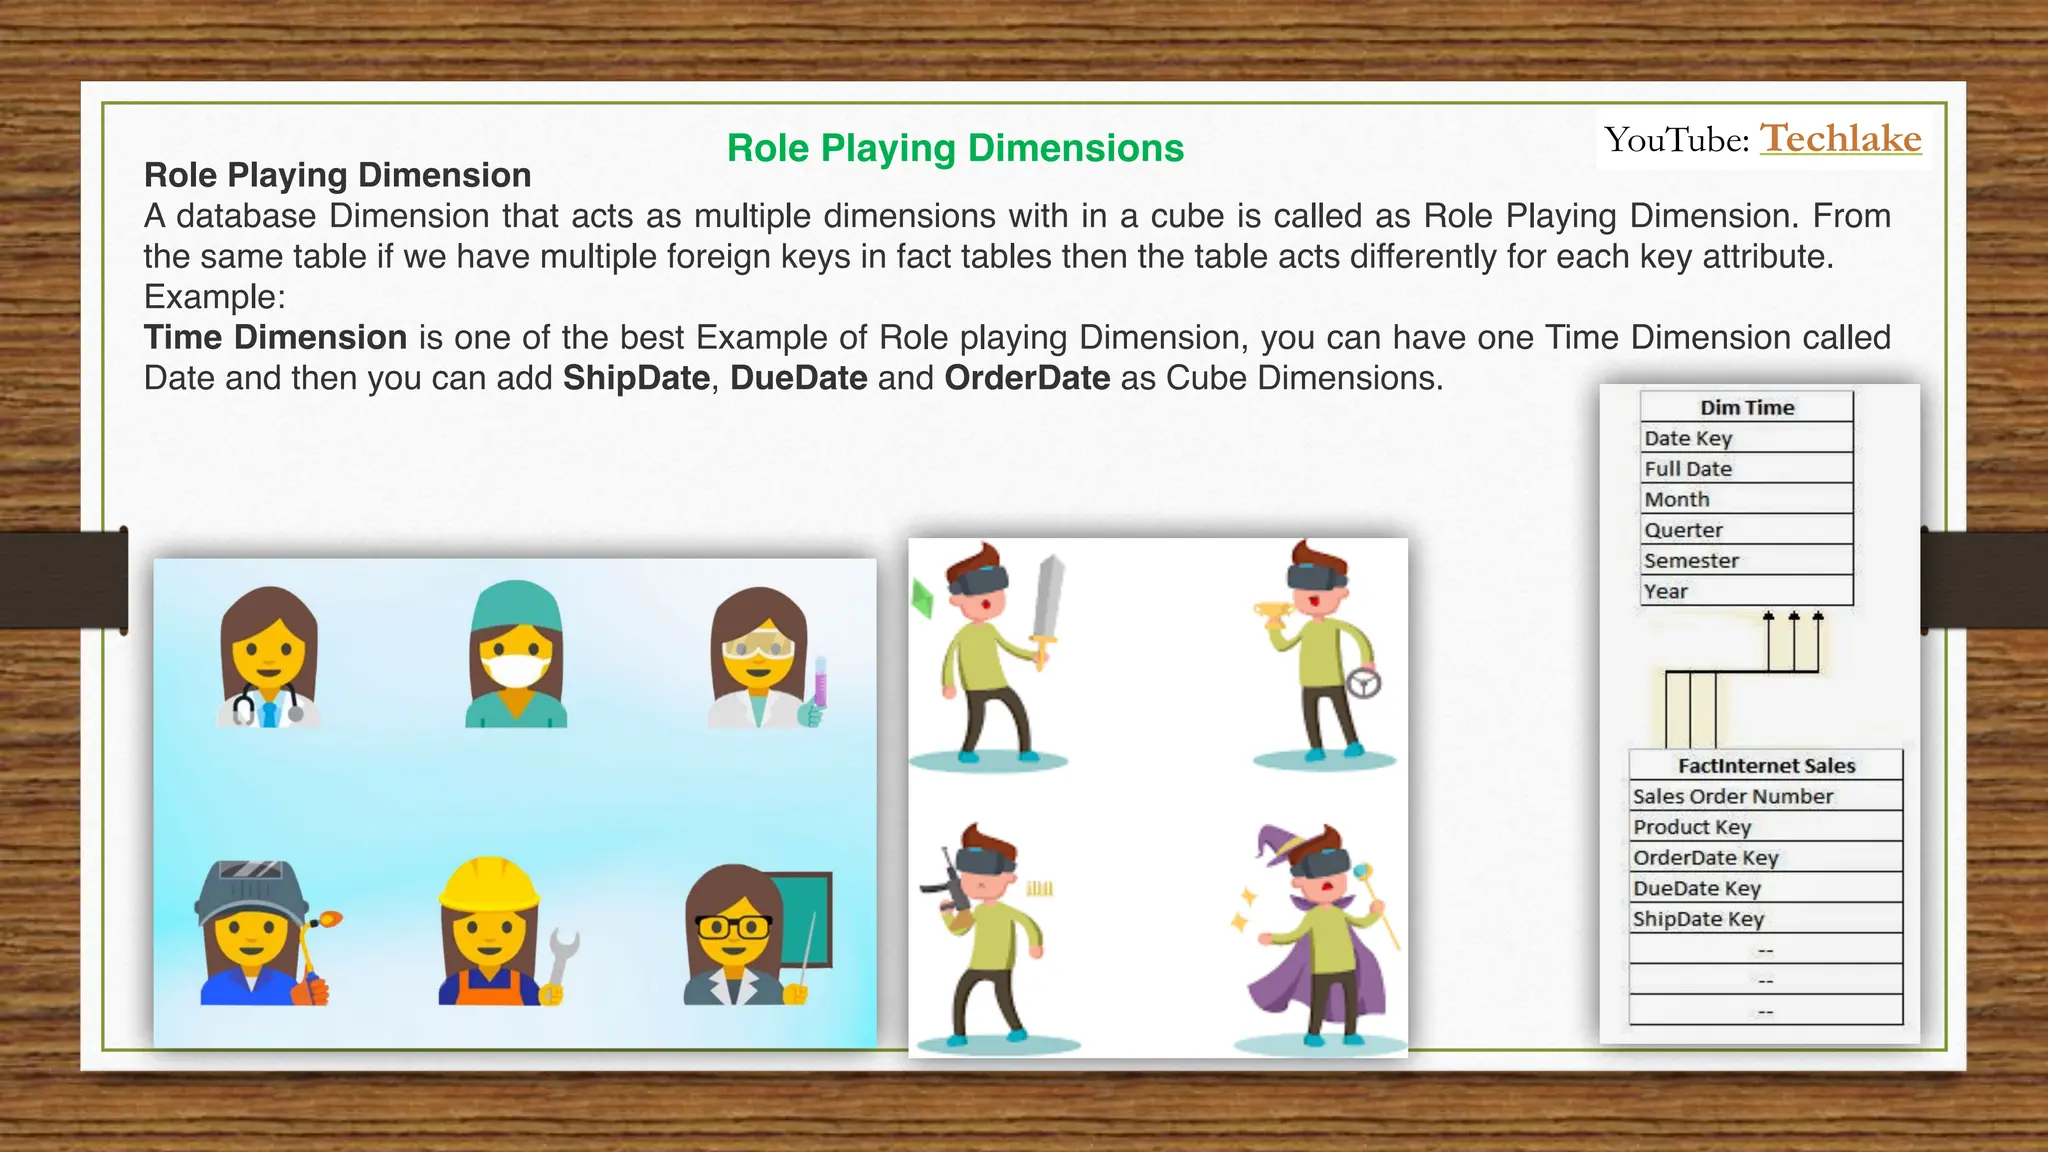
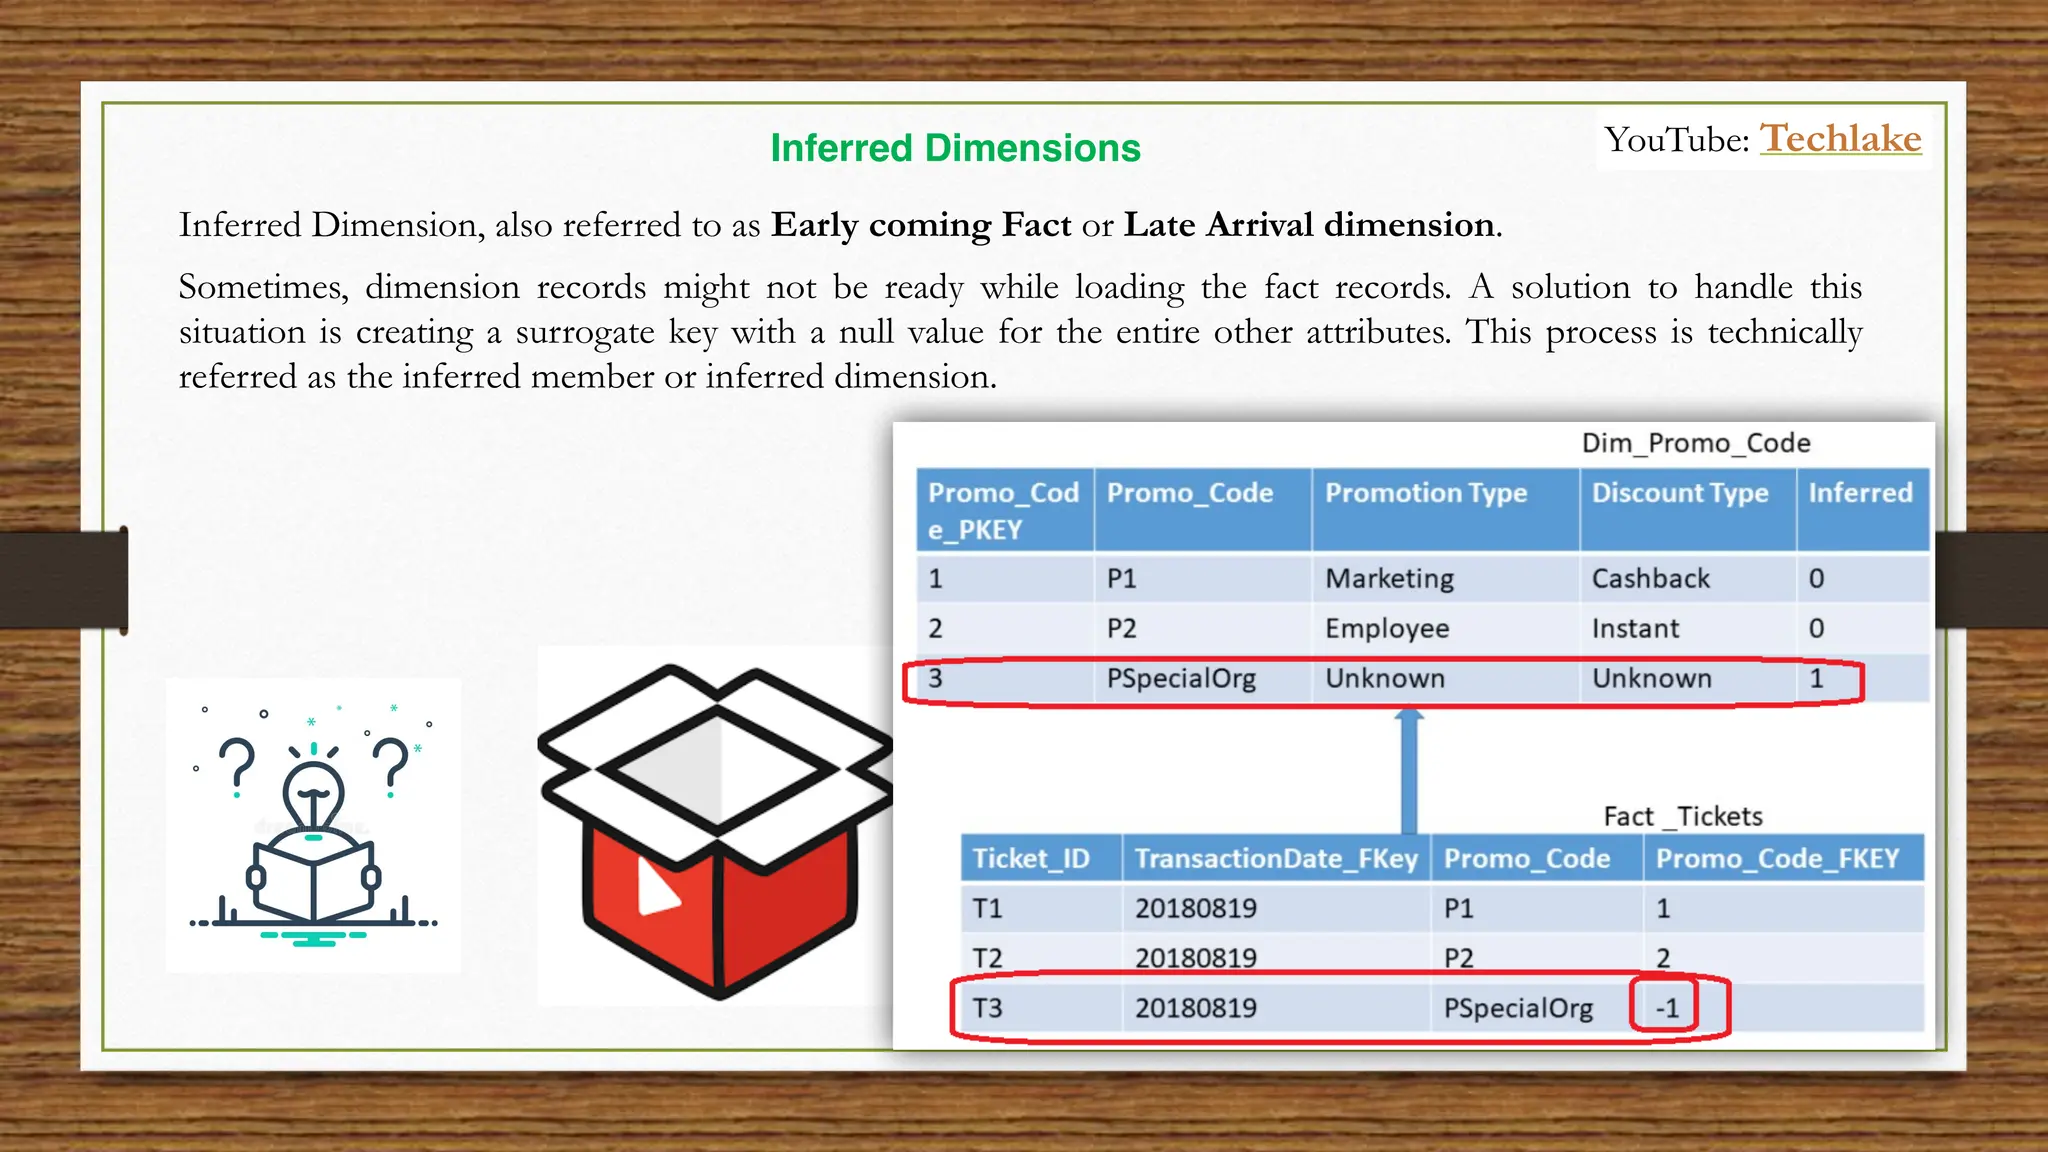
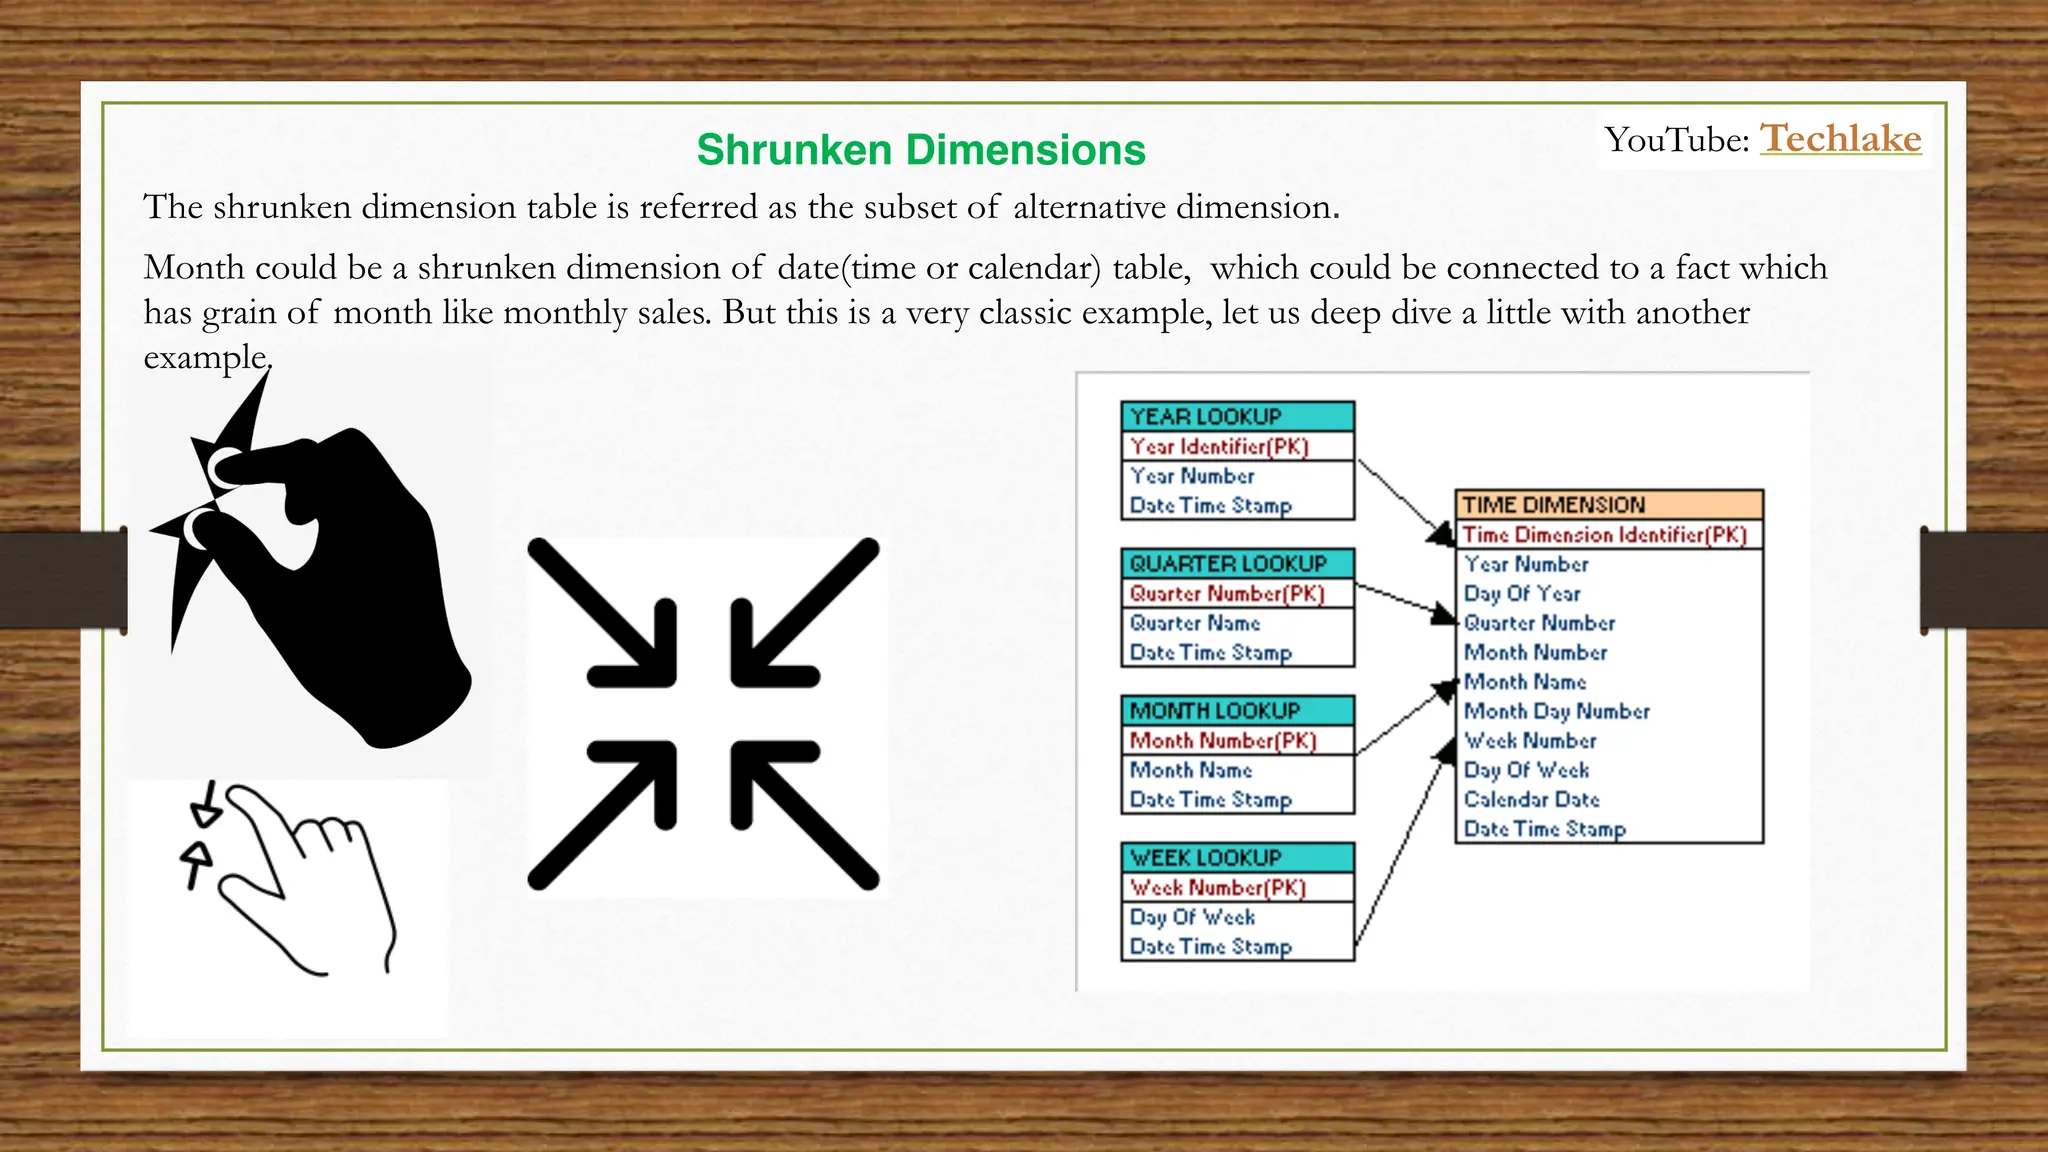
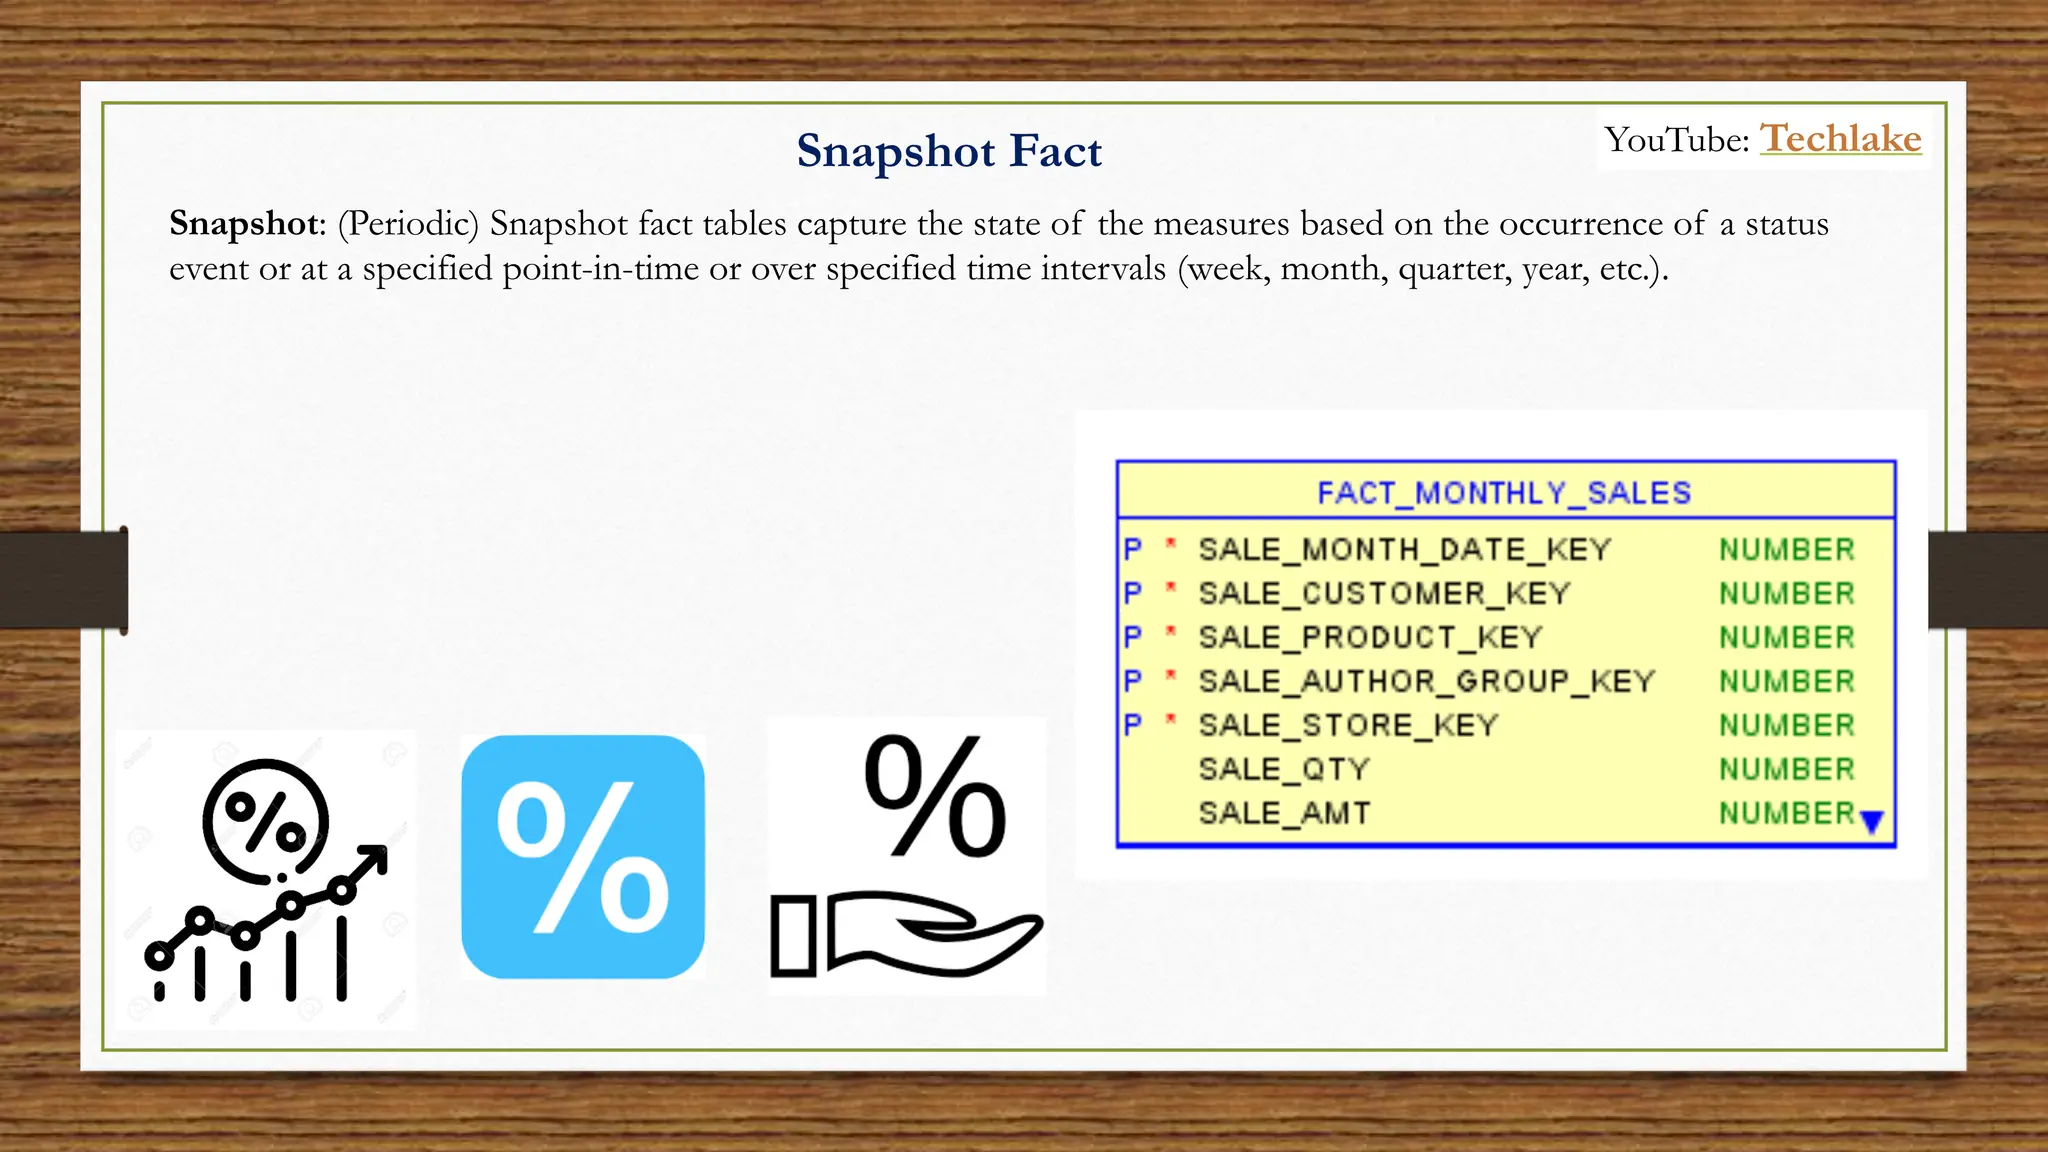
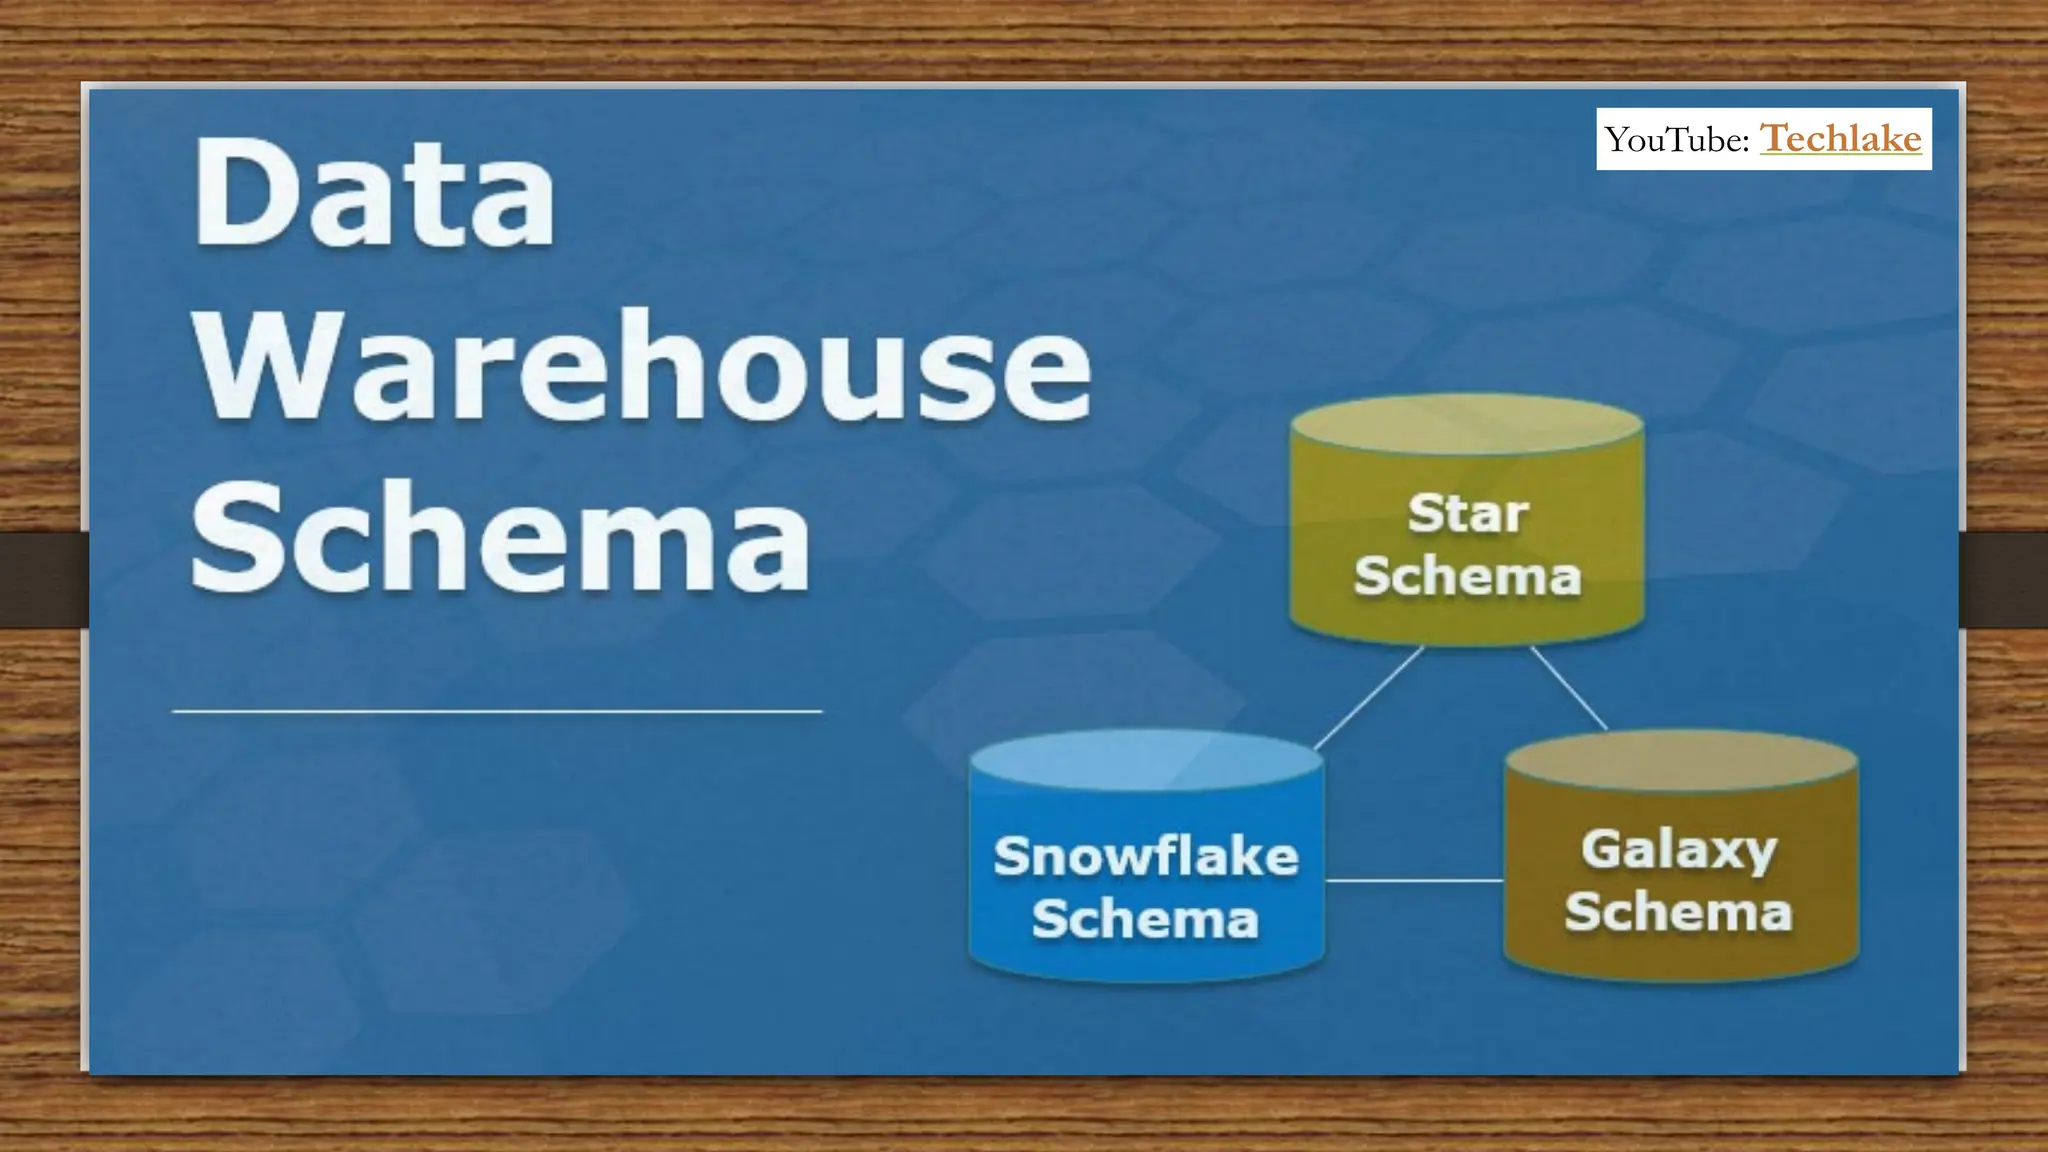
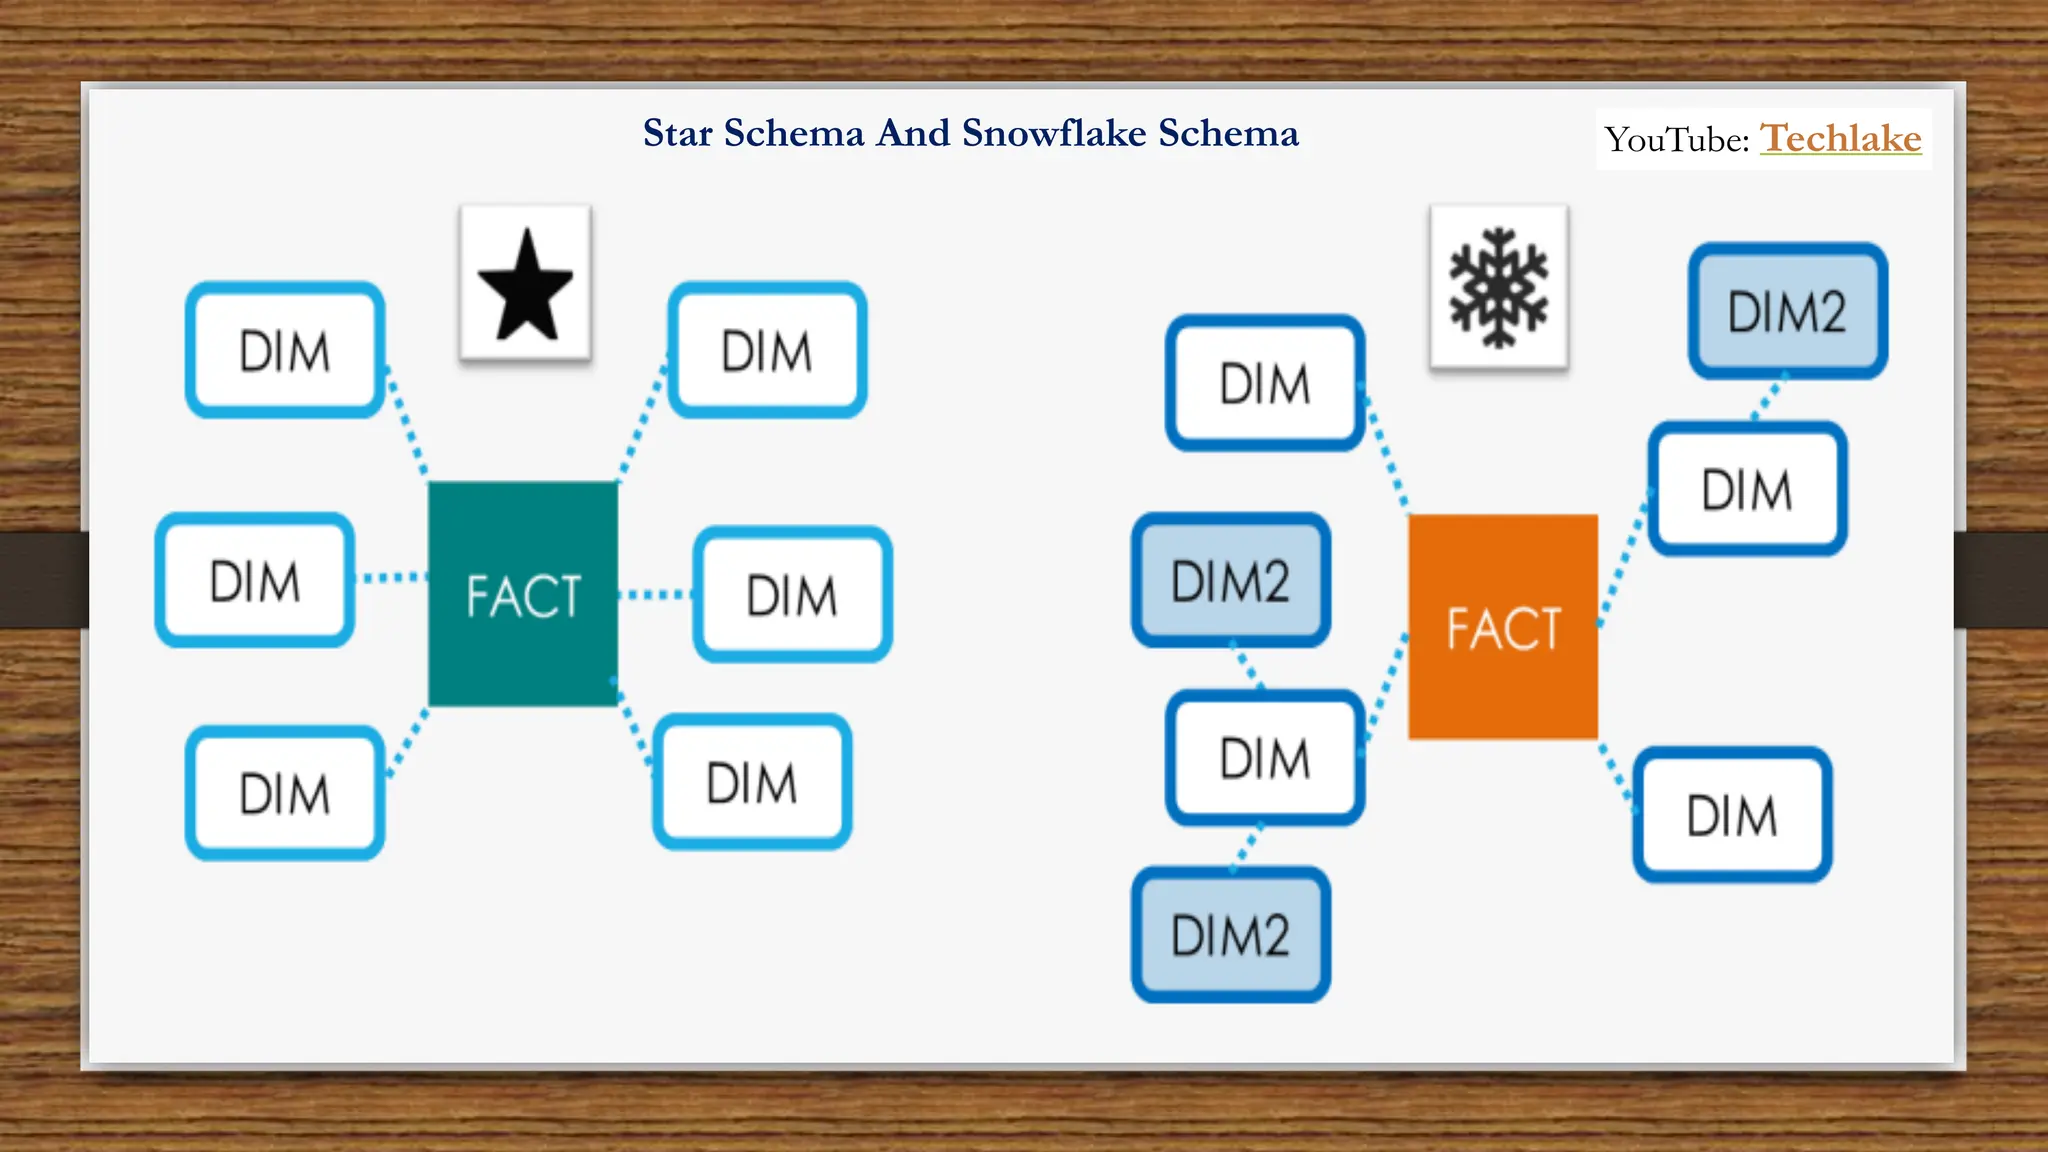
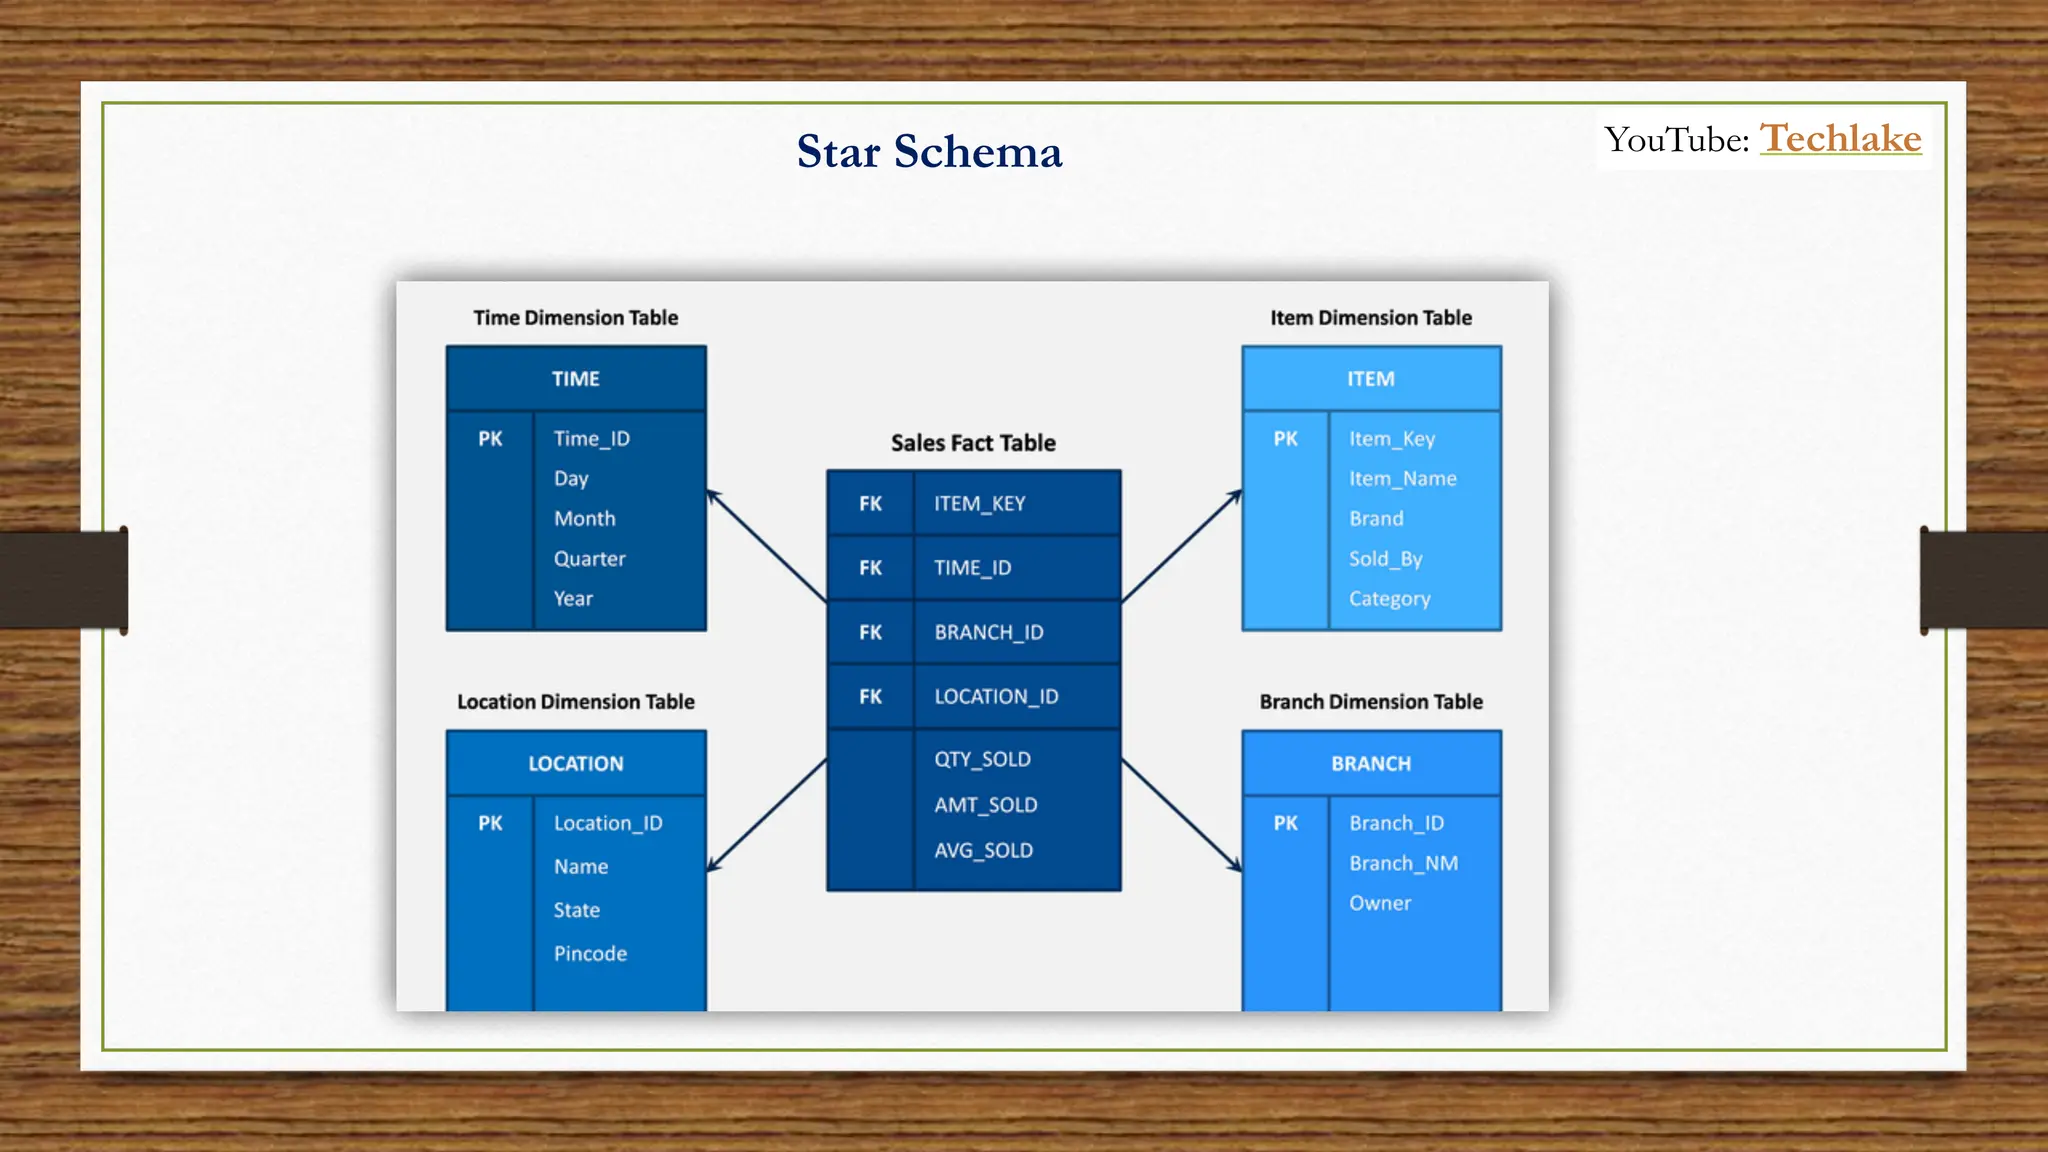
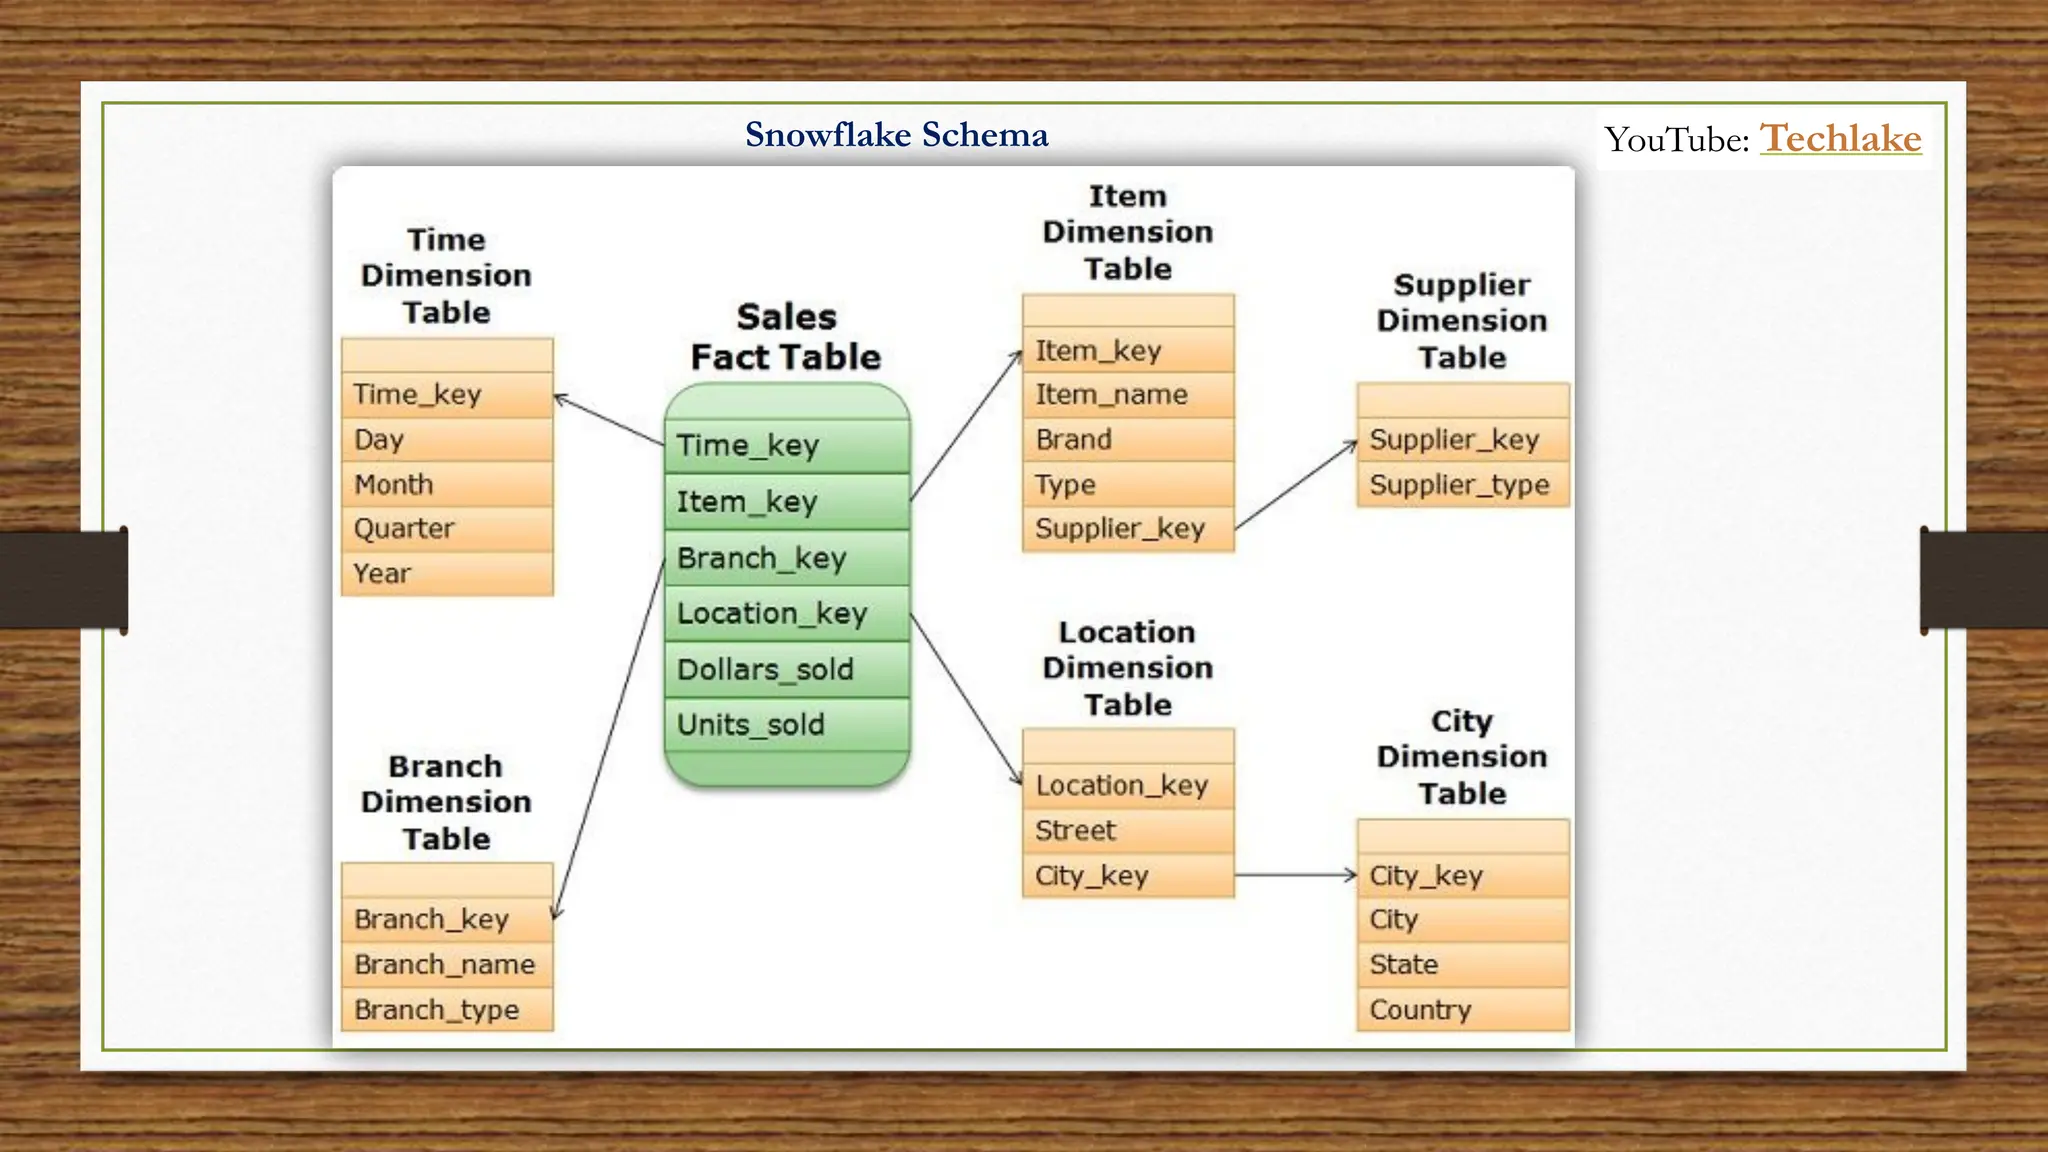
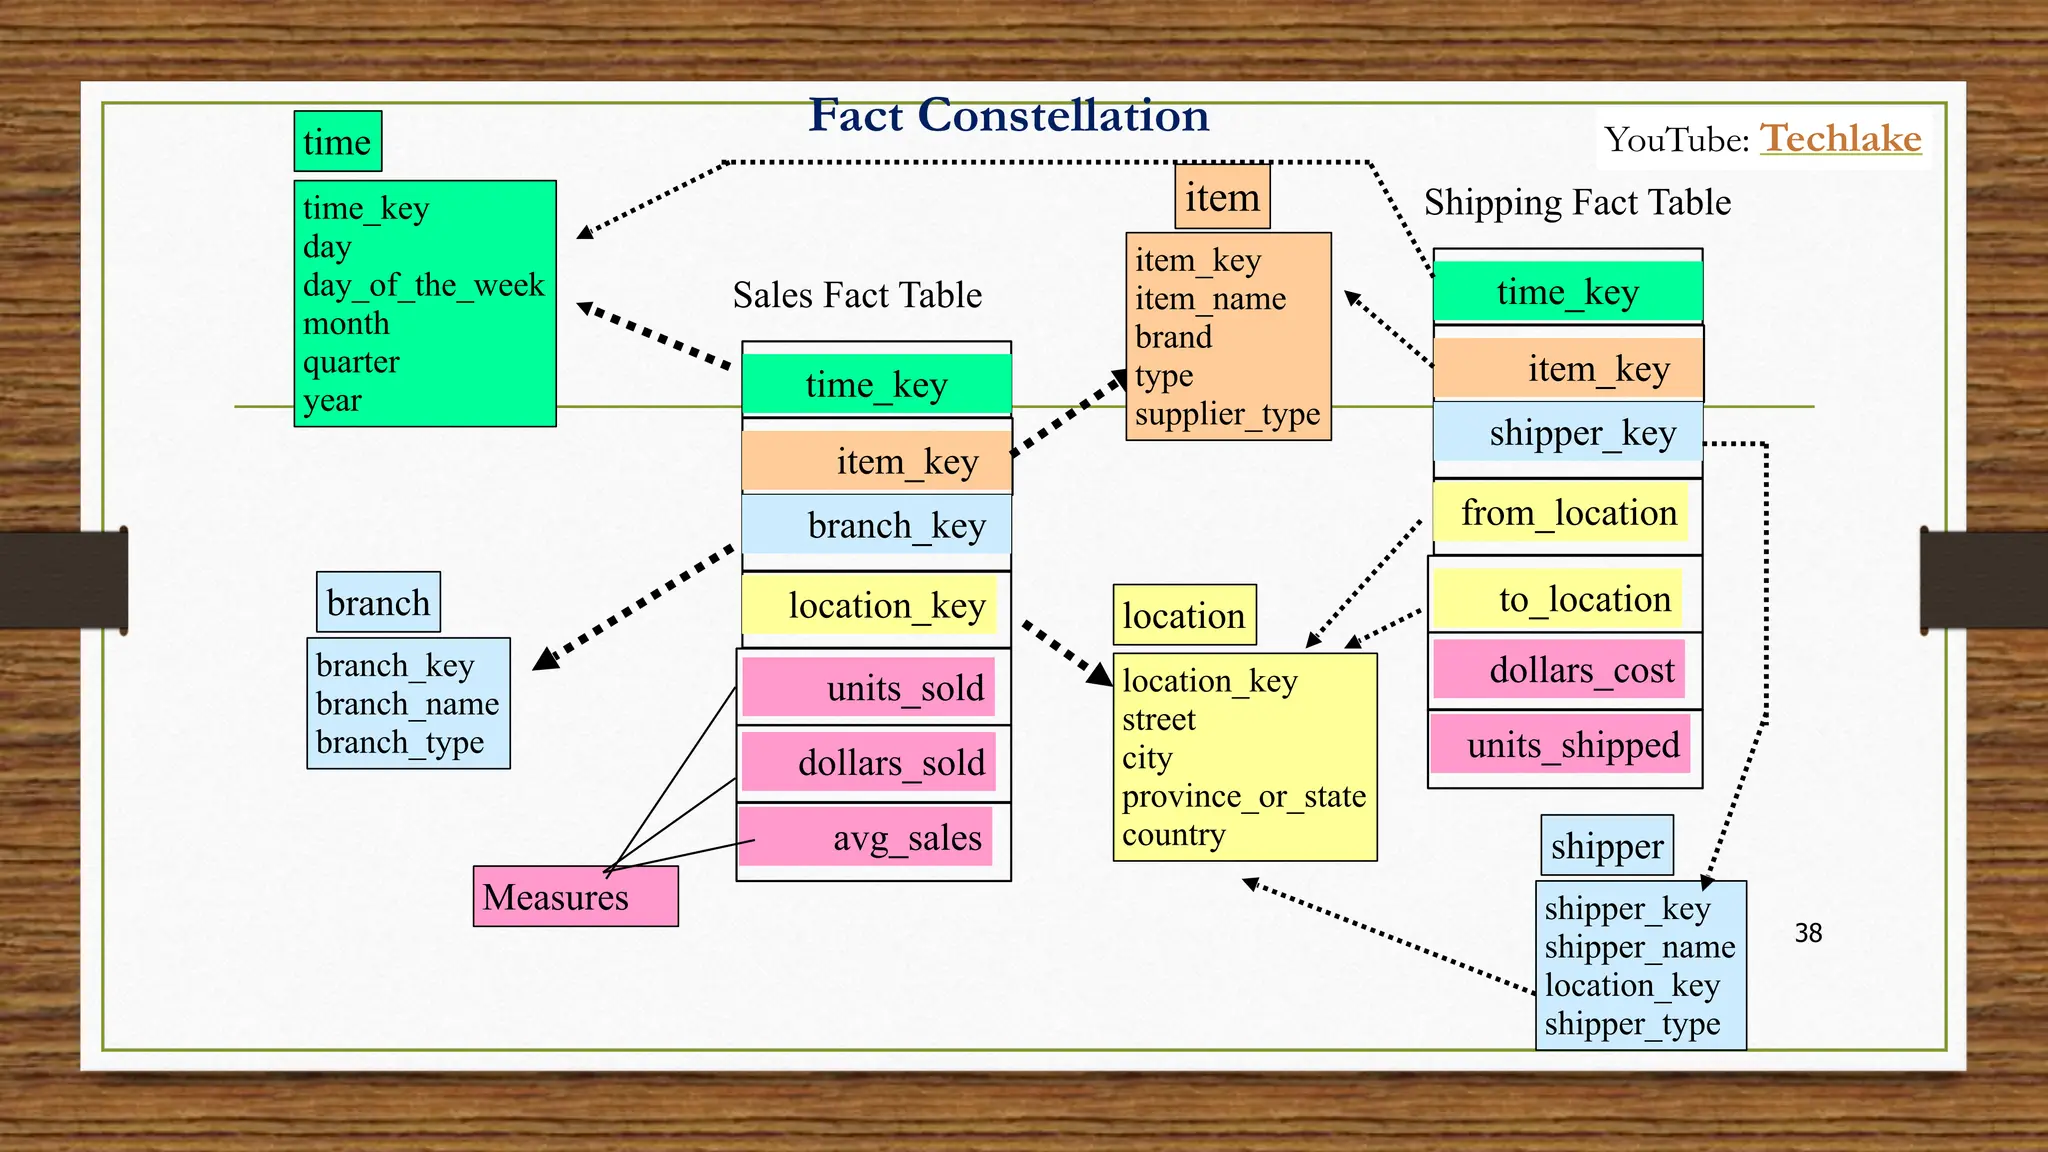
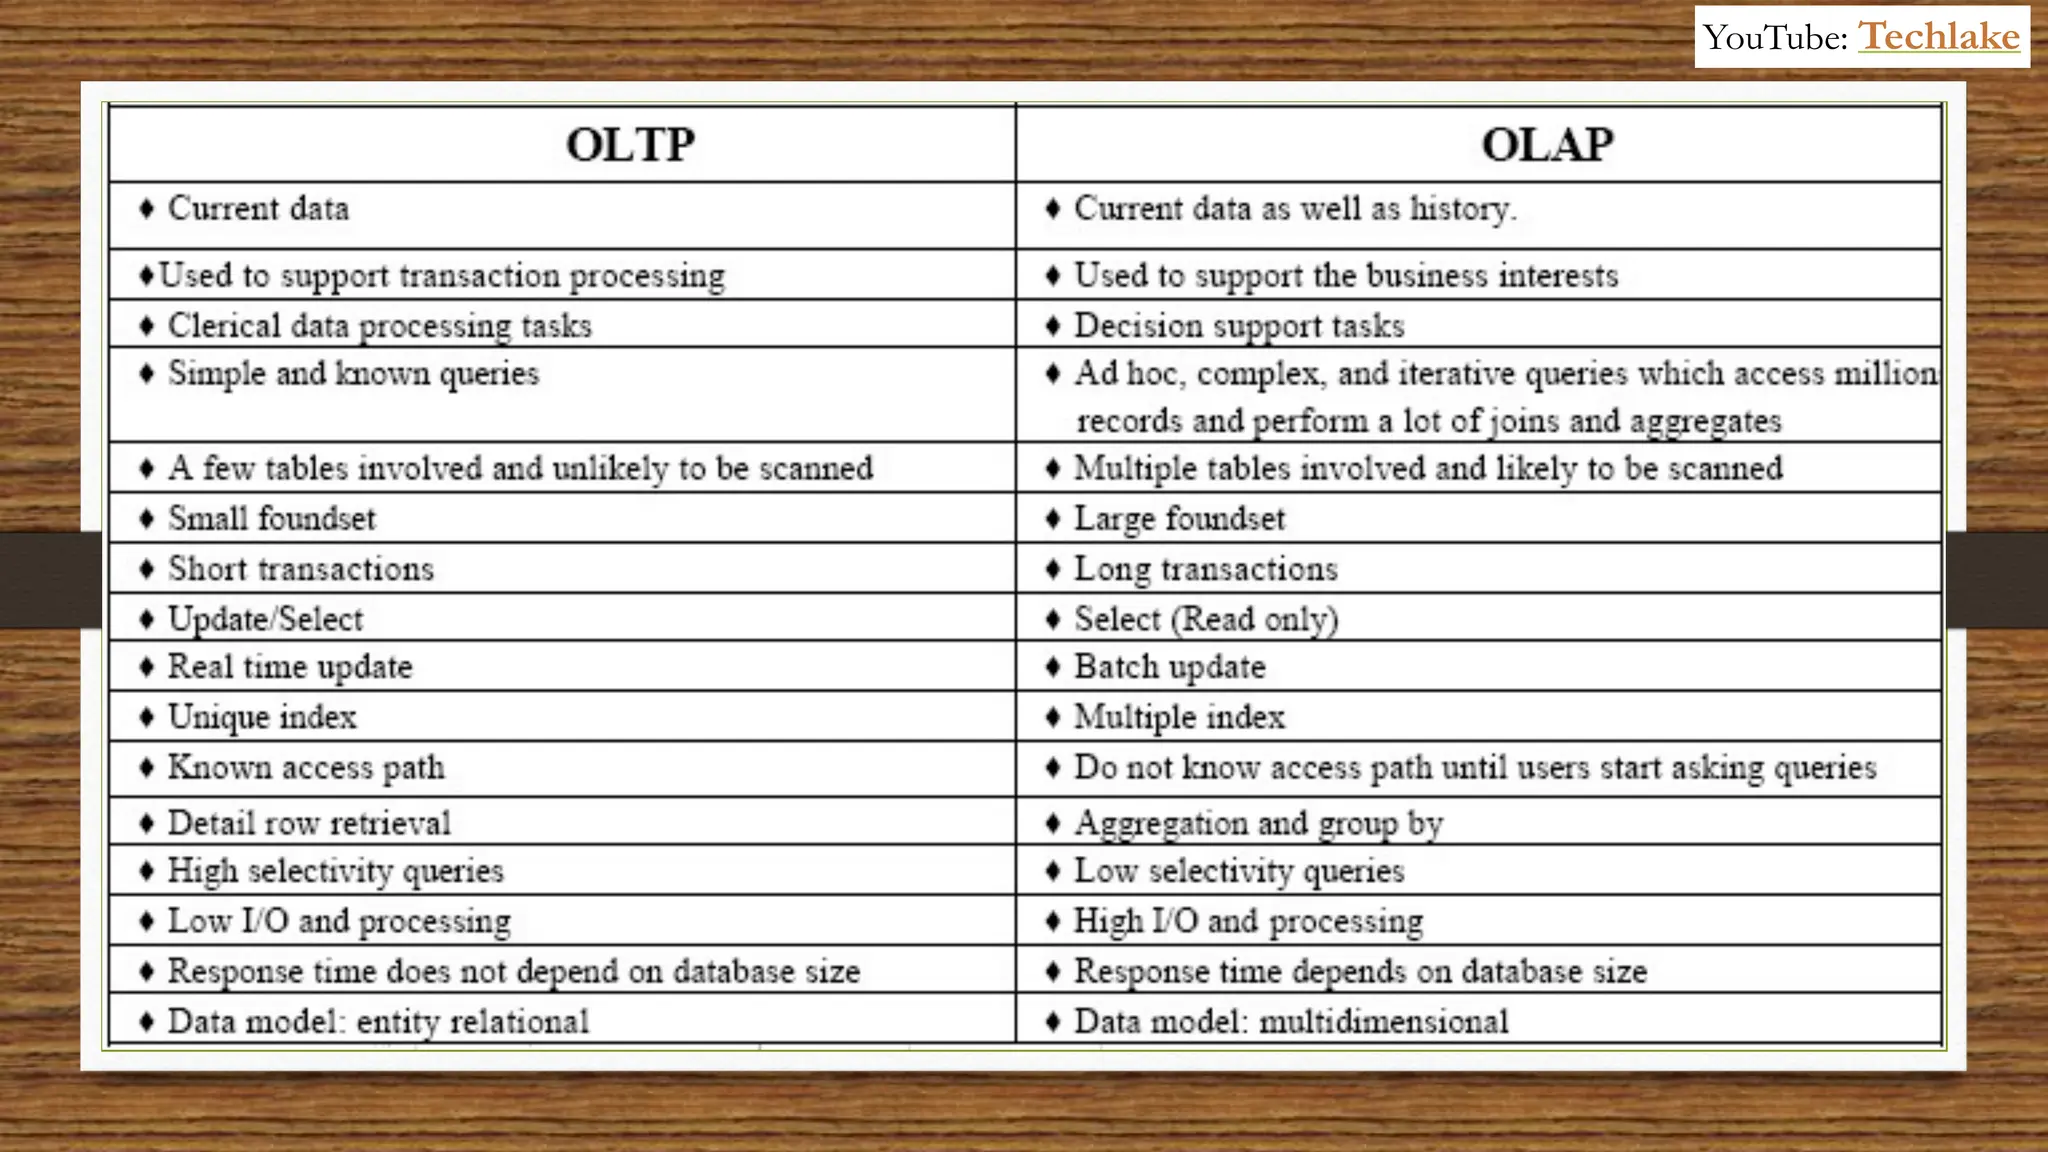
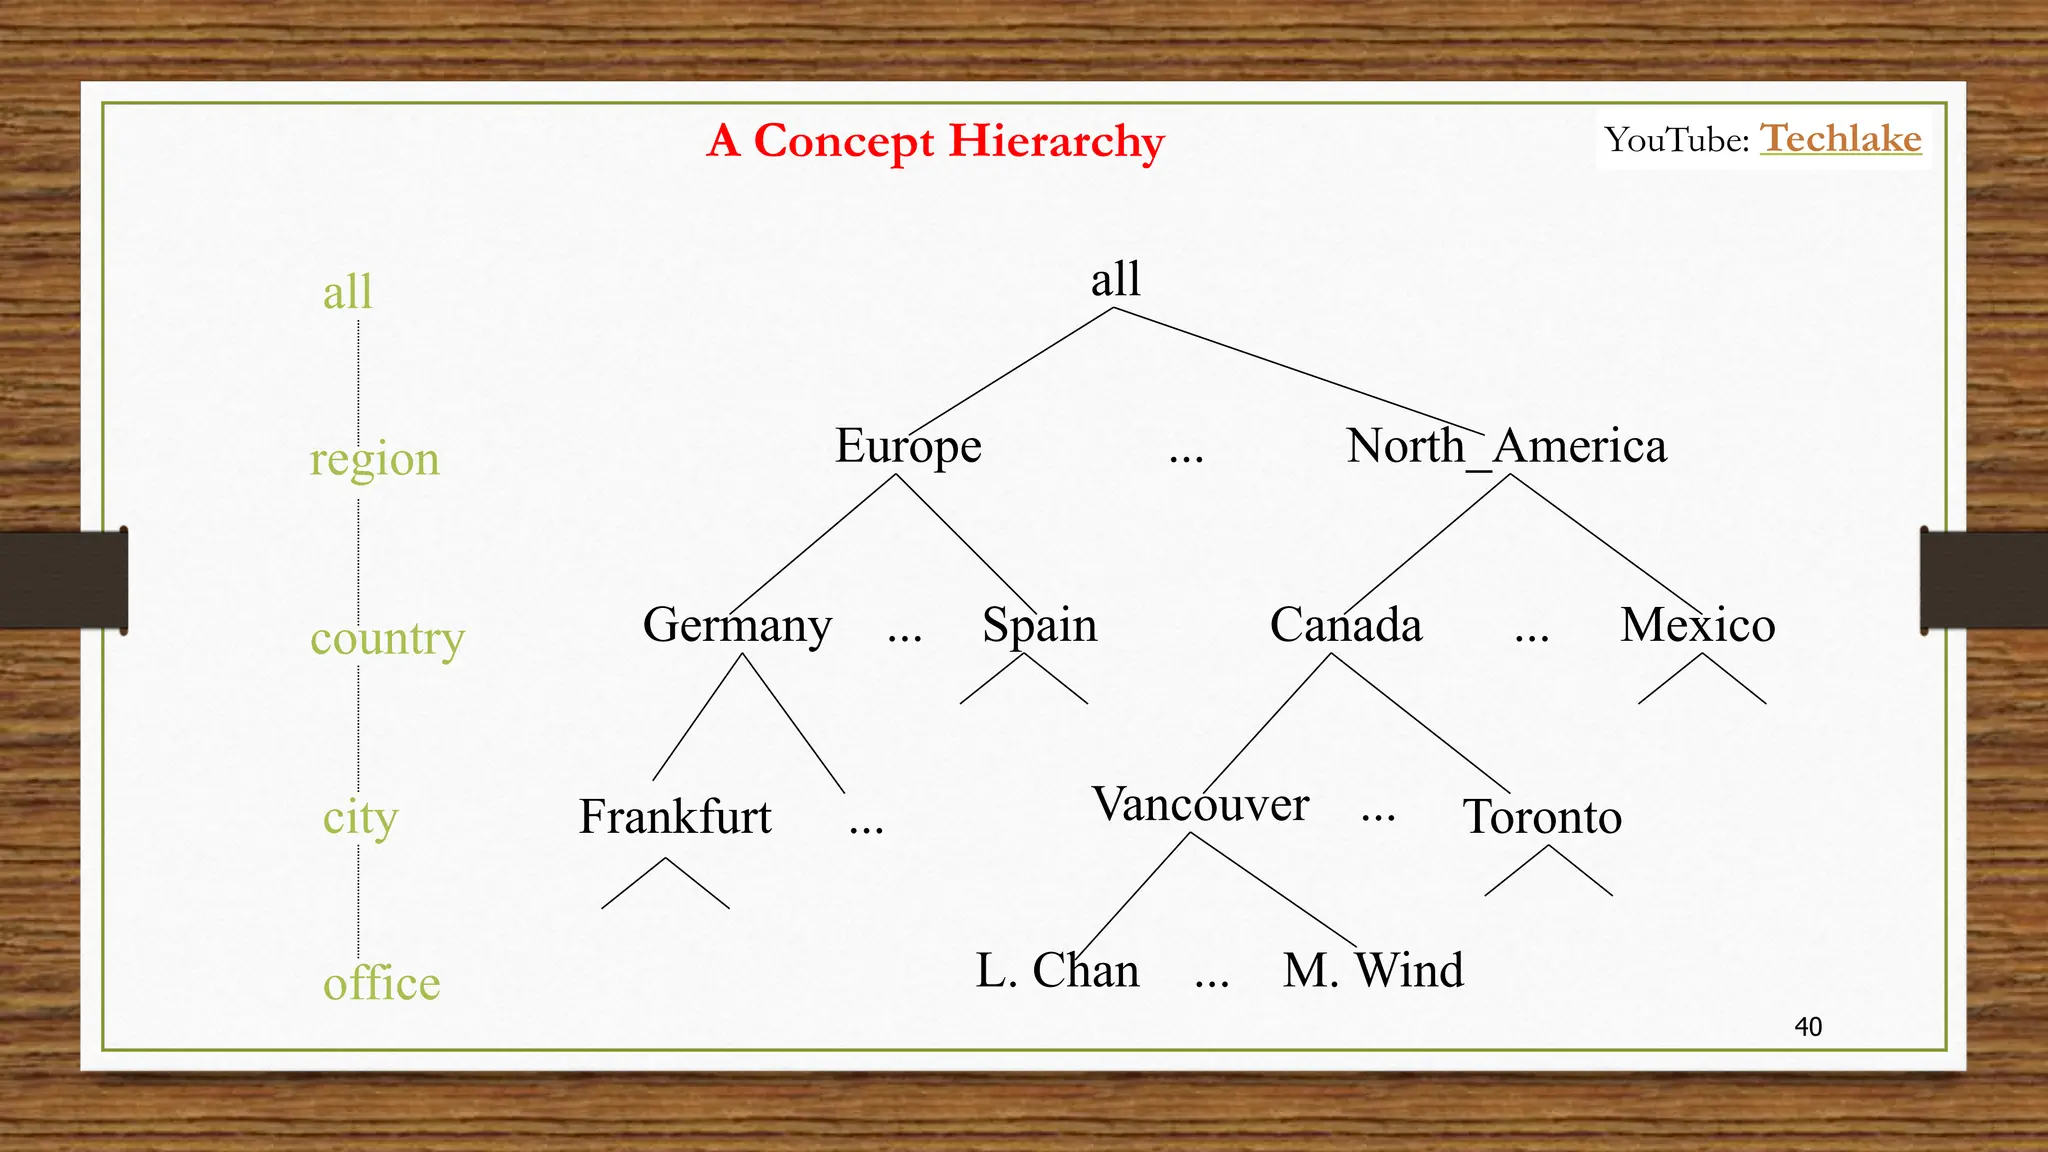
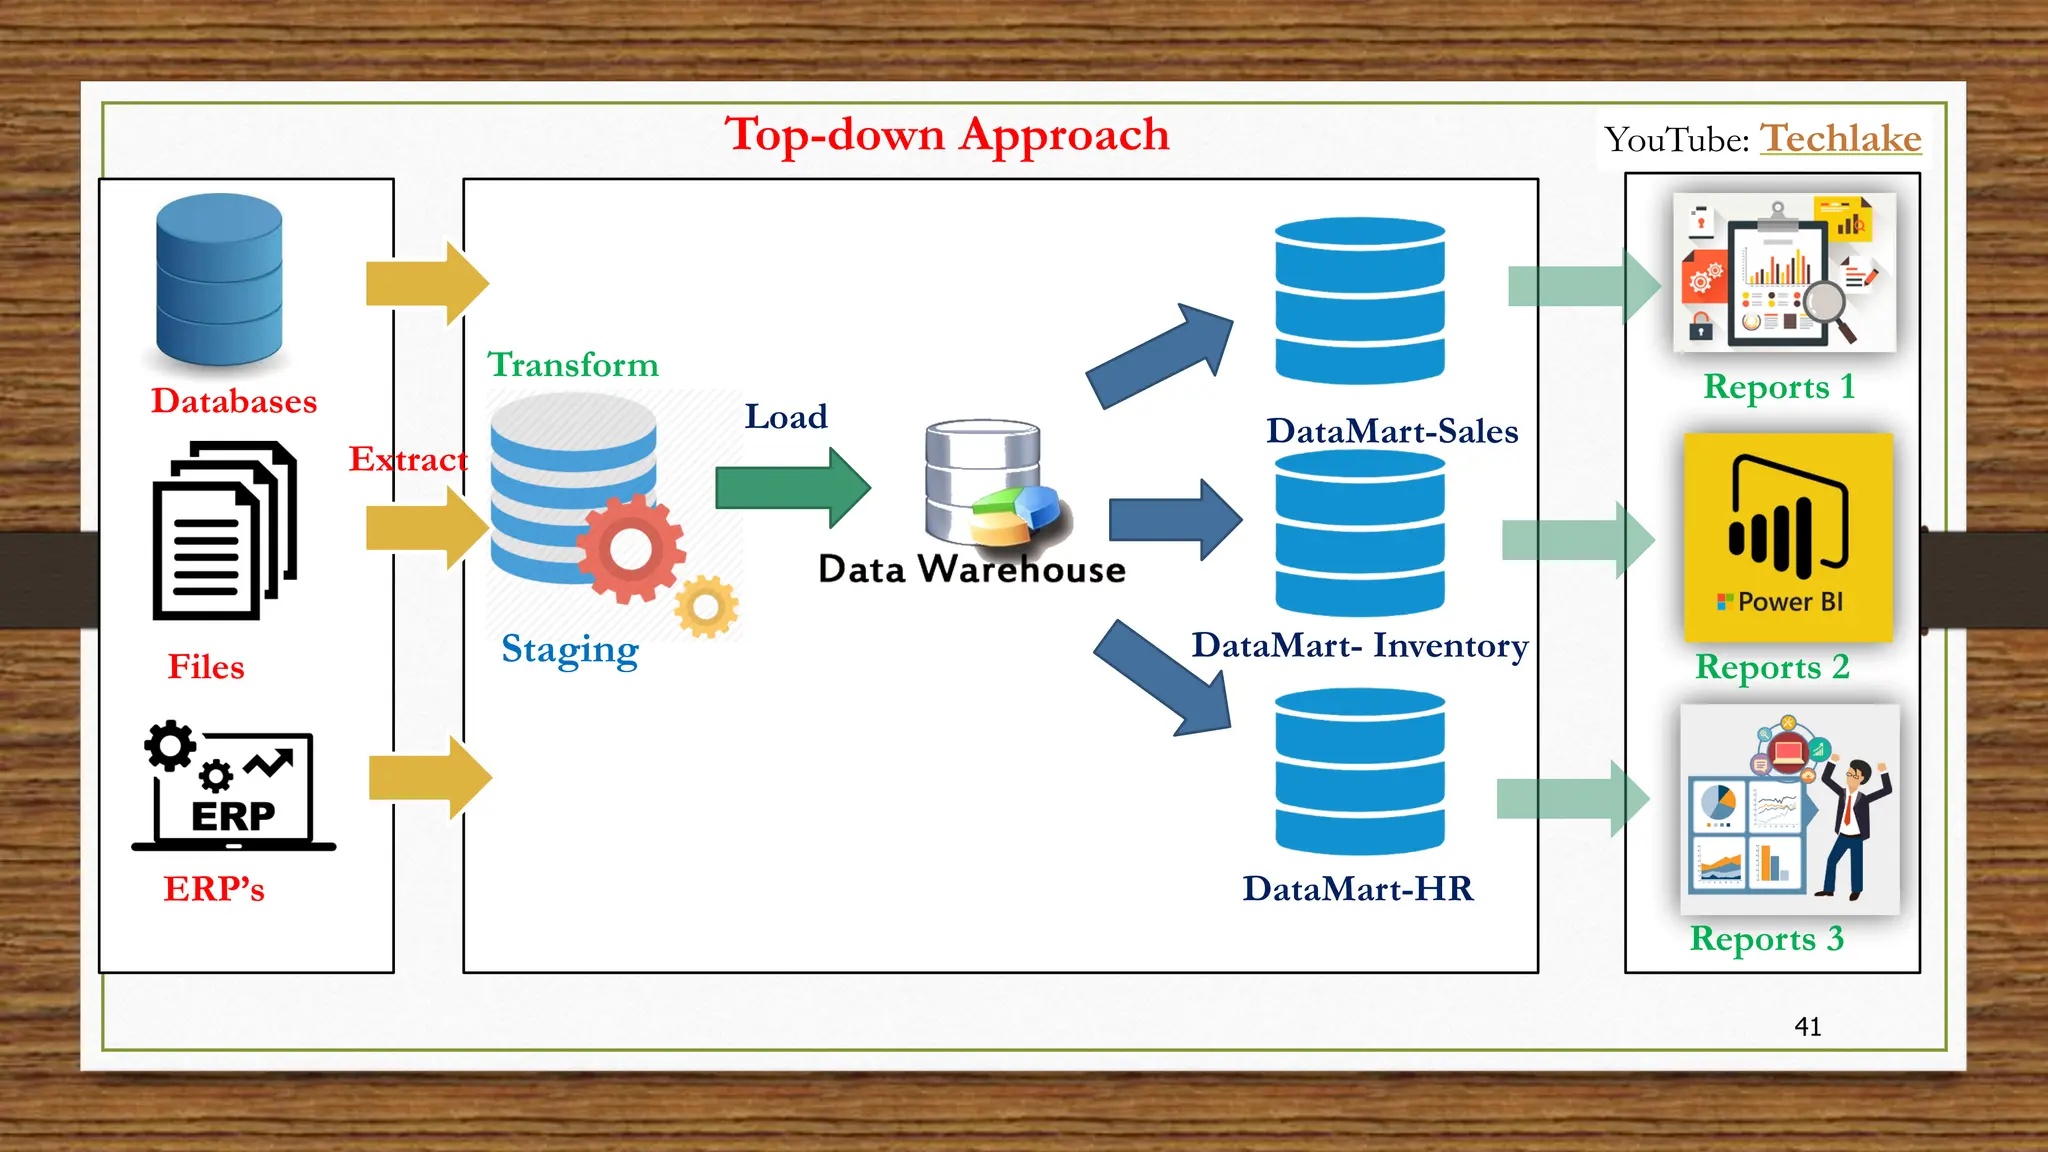
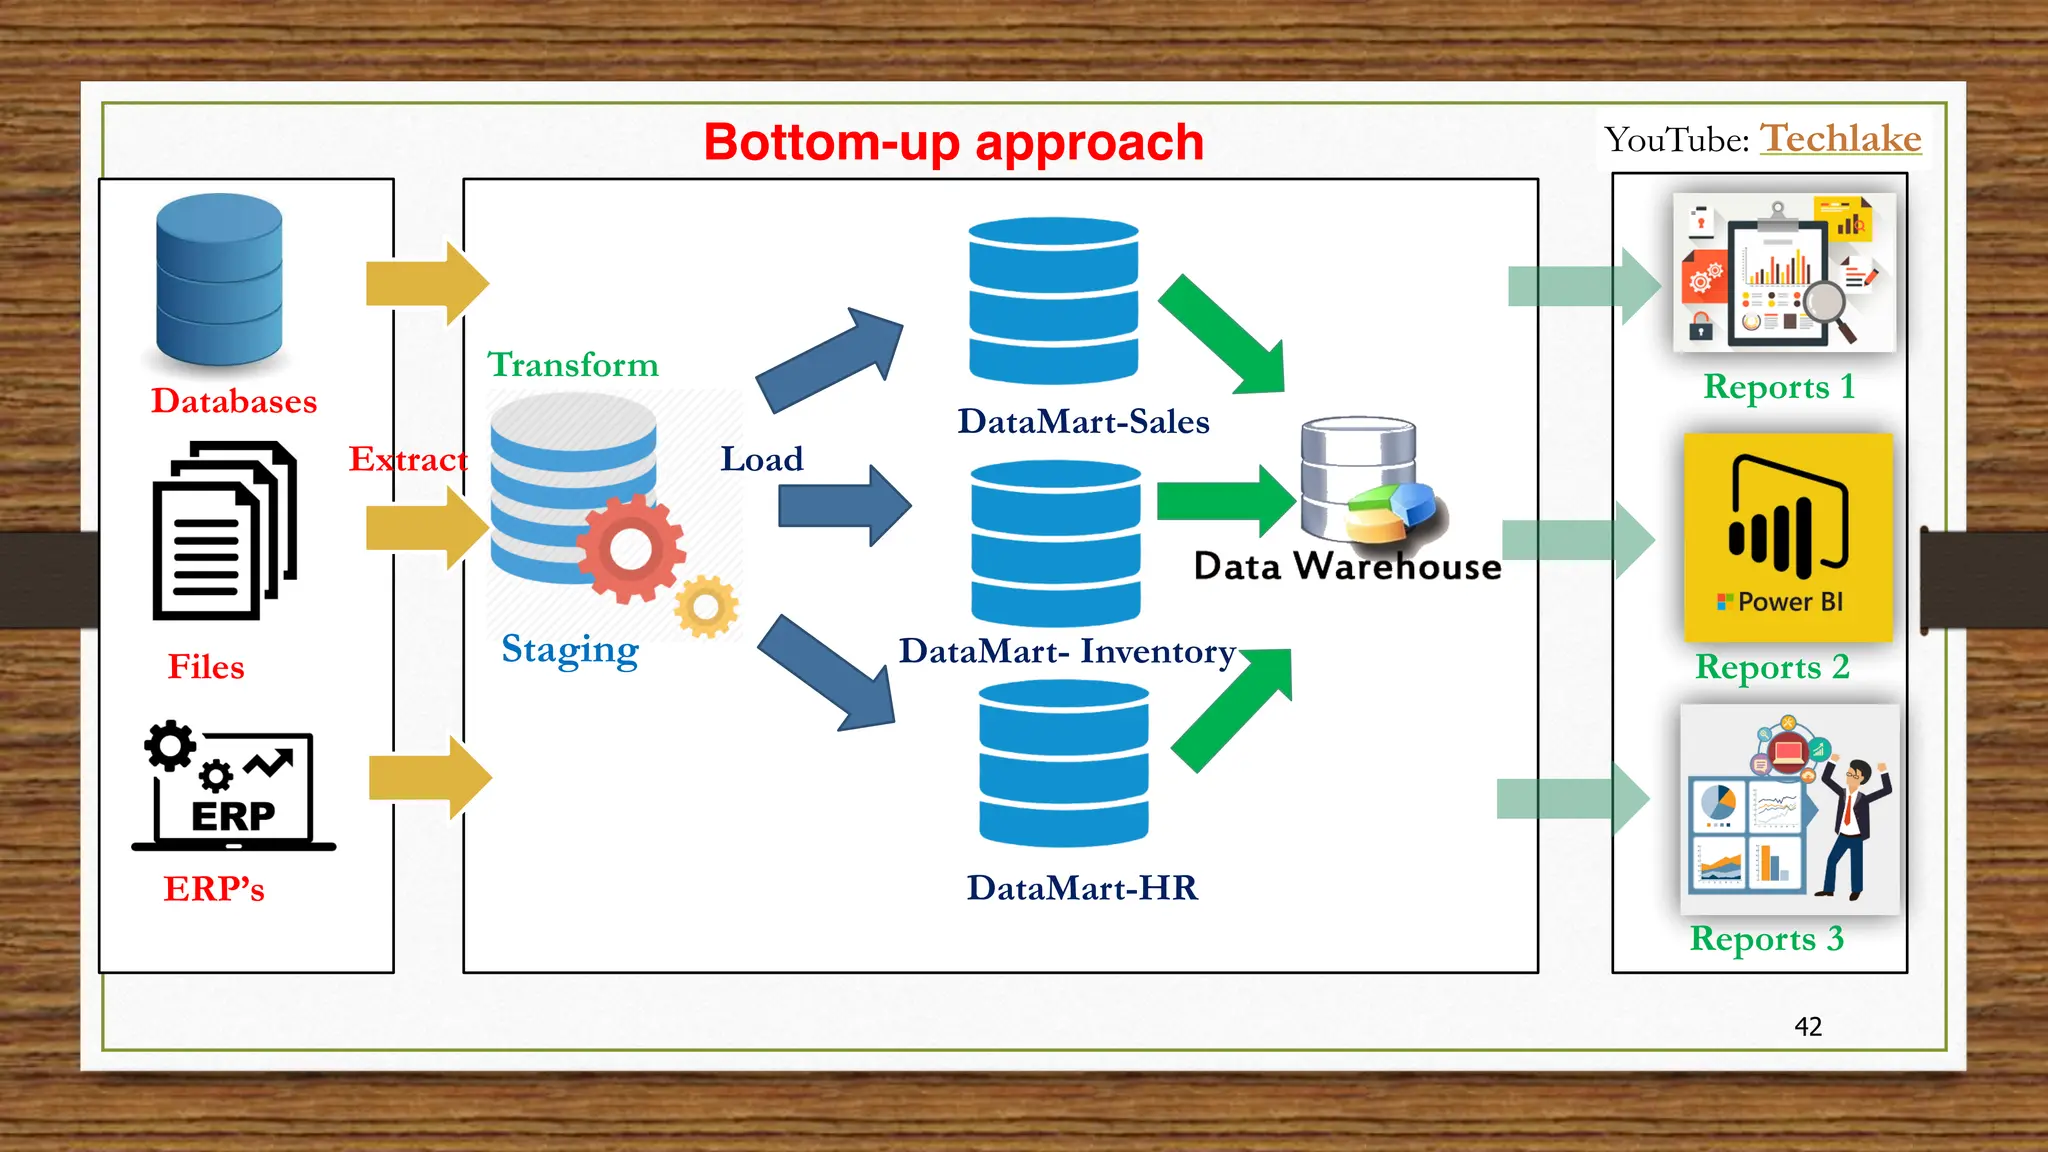
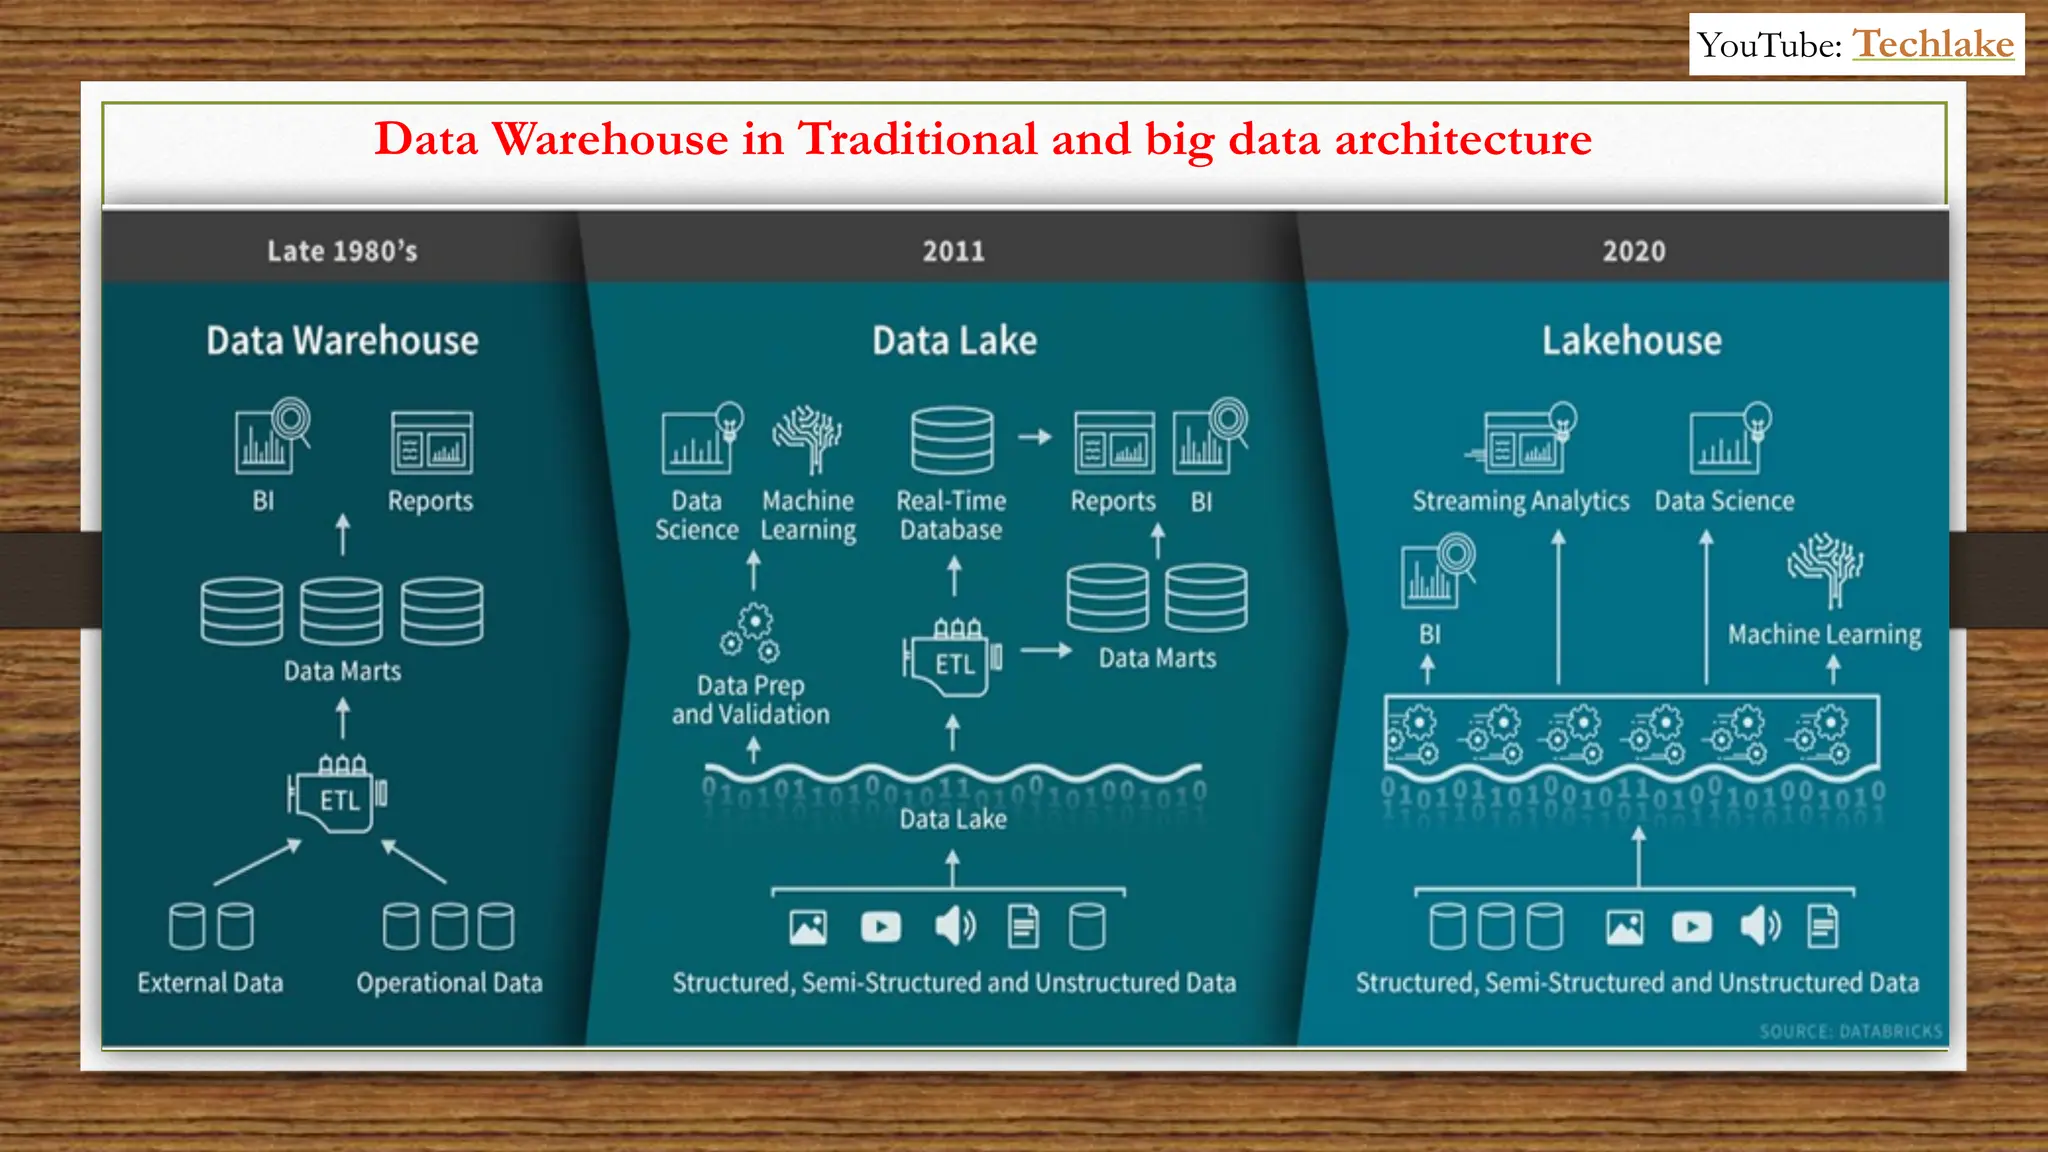
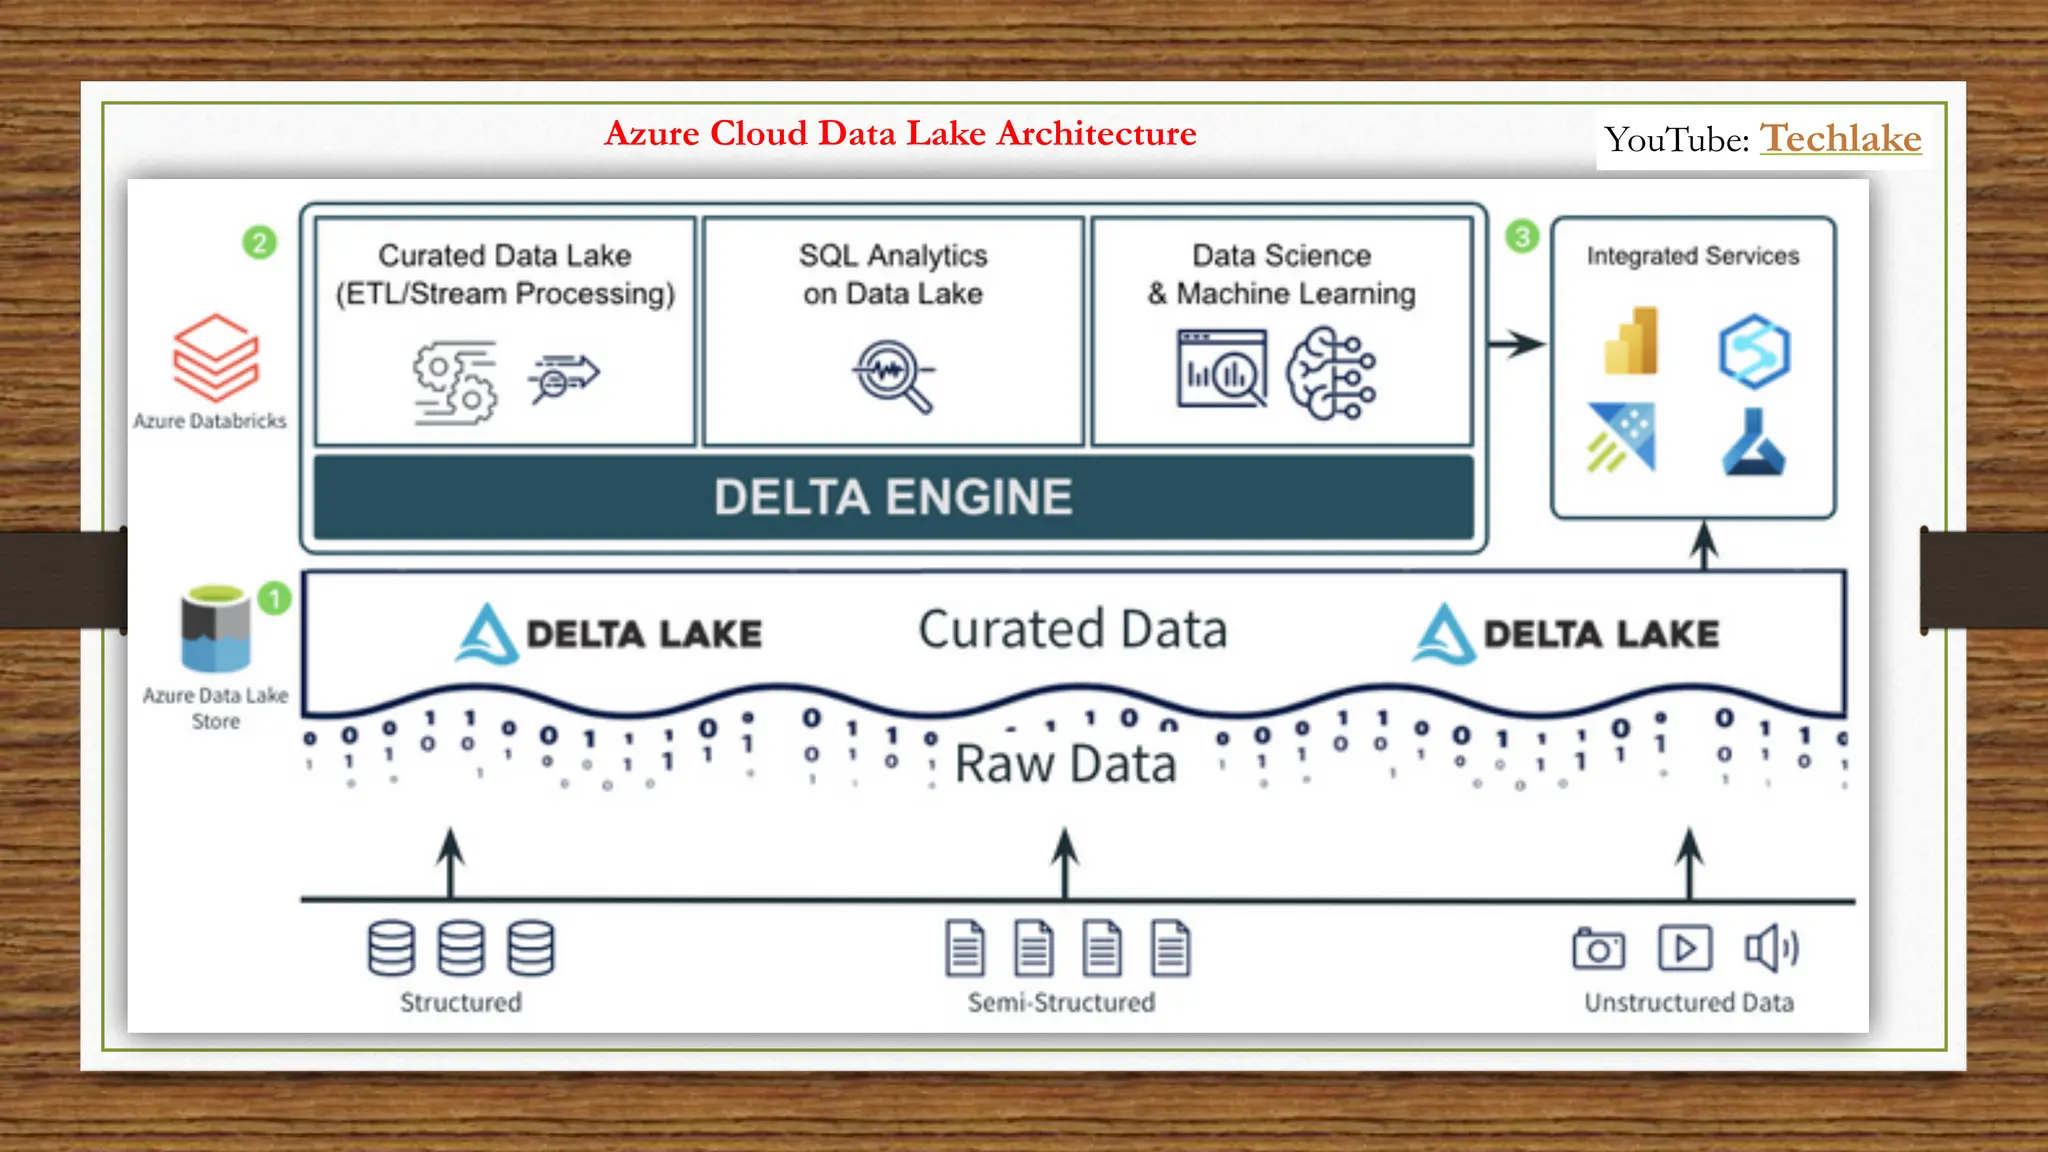
1
1
YouTube: Techlake
What is Data Migration? YouTube: Techlake
YouTube: Techlake
4
Databases
Files
ERP’s
Staging
Reports 1
Reports 2
Reports 3
Traditional DataWarehouse Flow
Extract
Transform
Load
YouTube: Techlake
ETL Side Major Transformations flow YouTube: Techlake
6
What is OLTP System?
• Database Systems have been used traditionally for OLTP
• clerical data processing tasks
• detailed, up to date data
• structured repetitive tasks
• read/update a few records
• isolation, recovery and integrity are critical
YouTube: Techlake
ERP Process Flow and OLTP Transactions data YouTube: Techlake
8
What is a OLAP?
• Defined in many different ways, but not rigorously.
• A decision support database that is maintained separately from the organization’s
operational database
• Support information processing by providing a solid platform of consolidated, historical
data for analysis.
• “A data warehouse is a subject-oriented, integrated, time-variant, and nonvolatile
collection of data in support of management’s decision-making process.”—W. H. Inmon
YouTube: Techlake
9
9
What is Data Warehouse?
A data warehouse is a type of data management system that is designed to enable and support business intelligence
(BI) activities, especially analytics. Data warehouses are solely intended to perform queries and analysis and often
contain large amounts of historical data. The data within a data warehouse is usually derived from a wide range of
sources such as application log files and transaction applications.
YouTube: Techlake
YouTube: Techlake
A data warehouse is a subject-oriented, integrated, time-variant and non-volatile collection of data in
support of management's decision making process.
YouTube: Techlake
A data warehouse can be used to analyze a particular subject area. For example,
"sales" can be a particular subject.
Subject-Oriented
YouTube: Techlake
A data warehouse integrates data from multiple data sources. For example, source A and
source B may have different ways of identifying a product, but in a data warehouse, there will
be only a single way of identifying a product.
Integrated
YouTube: Techlake
Historical data is kept in a data warehouse. For example, one can retrieve data from 3 months, 6 months, 12 months, or
even older data from a data warehouse. This contrasts with a transactions system, where often only the most recent
data is kept. For example, a transaction system may hold the most recent address of a customer, where a data
warehouse can hold all addresses associated with a customer.
Time-Variant
YouTube: Techlake
Once data is in the data warehouse, it will not change. So, historical data in a data warehouse should never be altered.
Ralph Kimball provided a more concise definition of a data warehouse:
Non-volatile
No- Update Only- Analysis
YouTube: Techlake
16
16
Database normalization is the process of structuring a database, usually a relational database, in accordance with a
series of so-called normal forms in order to reduce data redundancy and improve data integrity. It was first
proposed by E.F Codd as part of his relational model.. We call a relation normalized if:
1. it does not contain any redundancy
2. it does not cause maintenance problems
3. it is an accurate representation of the data
Normalization
YouTube: Techlake
17
17
Denormalization is a technique used by database administrators to optimize the efficiency of their database
infrastructure. This method allows us to add redundant data into a normalized database to alleviate issues with
database queries that merge data from several tables into a single table. The denormalization concept is based on the
definition of normalization that is defined as arranging a database into tables correctly for a particular purpose.
When we normalize tables, we break them into multiple smaller tables. So when we want to retrieve data from
multiple tables, we need to perform some kind of join operation on them. In that case, we use the denormalization
technique that eliminates the drawback of normalization.
Denormalization
YouTube: Techlake
Data Models
It would be wildly inefficient to store all your data in one massive table. So, your data warehouse contains many
tables that you can join together to get specific information. The main tables is called a fact table, and dimension
tables surround it.
The first step in designing a data warehouse is to build a conceptual data model that defines the data you want and
the high-level relationships between them.
YouTube: Techlake
1) A dimension table contains dimensions of a fact.
2) They are joined to fact table via a foreign key.
3) Dimension tables are de-normalized tables.
4) The Dimension Attributes are the various columns in a dimension table
5) No set limit set for given for number of dimensions
6) The dimension can also contain one or more hierarchical relationships
7) Dimensions offers descriptive characteristics of the facts with the help of their attributes
Dimension table
YouTube: Techlake
What is Fact Table?
1. Fact table contains measurements, metrics, and facts about a business process while the Dimension table is a companion to
the fact table which contains descriptive attributes to be used as query constraining.
2. Fact table is located at the center of a star or snowflake schema, whereas the Dimension table is located at the edges of the
star or snowflake schema.
3. Fact table is defined by their grain or its most atomic level whereas Dimension table should be wordy, descriptive, complete,
and quality assured.
4. Fact table helps to store report labels whereas Dimension table contains detailed data.
5. Fact table does not contain a hierarchy whereas the Dimension table contains hierarchies.
YouTube: Techlake
Types of Dimensions
1. Junk Dimensions
2. Conformed Dimensions
3. Degenerate Dimensions
4. Rapidly Changing Dimensions
5. Role Playing Dimensions
6. Inferred Dimensions
7. Shrunken Dimensions
8. Static Dimensions
9. Slowly Changing Dimensions
Types of Facts
1. Transaction Fact
2. Snapshot Fact
3. Accumulated Fact
4. Fact-less Fact
Types of Dimensions and Fact tables YouTube: Techlake
A single table that includes a compilation of unrelated and different attributes is referred as the junk
dimension table. This table is meant to avoid including a huge amount of foreign keys in the fact table.
This table is often generated to handle foreign keys generated by the rapidly changing dimensions.
Junk Dimensions YouTube: Techlake
A conformed dimension connects to multiple fact tables
A conformed dimension allow a consistent analysis of different business process metrics used across
multiple dimensional models. A product dimension may join to the inventory, sales, procurement, and
other fact tables. It is important to closely collaborate with data governance team to have a consistent
definition for this dimension.
Conformed Dimensions YouTube: Techlake
Degenerate Dimensions
A degenerate dimension is a special dimension like invoice number, check number that is an identifier
for a transaction. However, it does not have attributes linked to it as all the important attributes are
already part of their respective dimensions. So an invoice may have a customer name attribute but it's
already a part of the customer dimension. A degenerate dimension is a part of the fact table but it's not
a measure, it is still a dimension.
YouTube: Techlake
An attribute in the dimension, which is changing frequently, is referred as the rapidly changing
attribute. Handling rapidly changing dimension in data warehouse is very difficult because of many
performance implications. As we know slowly changing dimension type 2 is used to maintain the
history for the changes. But the problem with type 2 is, with each and every change in the dimension
attribute, it adds new row to the table. If in case there are dimensions that are changing a lot, table
become larger and may cause serious performance issues. Hence, use of the type 2 may not be the
wise decision to implement the rapidly changing dimensions.
Rapidly Changing Dimensions YouTube: Techlake
Role Playing Dimensions
Role Playing Dimension
A database Dimension that acts as multiple dimensions with in a cube is called as Role Playing Dimension. From
the same table if we have multiple foreign keys in fact tables then the table acts differently for each key attribute.
Example:
Time Dimension is one of the best Example of Role playing Dimension, you can have one Time Dimension called
Date and then you can add ShipDate, DueDate and OrderDate as Cube Dimensions.
YouTube: Techlake
Inferred Dimensions
Sometimes, dimension records might not be ready while loading the fact records. A solution to handle this
situation is creating a surrogate key with a null value for the entire other attributes. This process is technically
referred as the inferred member or inferred dimension.
Inferred Dimension, also referred to as Early coming Fact or Late Arrival dimension.
YouTube: Techlake
The shrunken dimension table is referred as the subset of alternative dimension.
Shrunken Dimensions
Month could be a shrunken dimension of date(time or calendar) table, which could be connected to a fact which
has grain of month like monthly sales. But this is a very classic example, let us deep dive a little with another
example.
YouTube: Techlake
Static Dimensions : (no-source)
A static dimension is a dimension that is not loaded from the source system.
The static dimensions are generated using a SQL script or a stored procedure and are manually loaded. The time
dimension is a classic example of a static dimension. Also, status codes dimension is mostly a static dimension.
Static Dimensions
A few common examples of the static dimensions would be
"DIM_SOURCE_SYSTEMS",
id source_name type status
1 SAP ERP Y
2 Oracle Database Y
3 DB2 Database Y
4 SalesForce ERP Y
5 systemlogs file Y
YouTube: Techlake
1. Additive: Additive facts can be used with any aggregation function like Sum(), Avg() etc. Example is Quantity, sales amount
etc
2. Semi-Additive: Semi-additive facts are facts that can be summed up for some of the dimensions in the fact table, but not the
others. For example, Consider bank account details. You cannot apply the Sum() on the bank balance that does not give useful
results but min() and max() function may return useful information
3. Non-Additive: Non-additive facts are facts that cannot be summed up for any of the dimensions present in the fact table.
For example of non-additive fact is any kind of ratio or percentage. Non numeric facts can also be a non-additive facts
Types of Facts YouTube: Techlake
Transaction Fact
Transaction fact tables are easy to understand: a customer or business process does some thing; you want to capture
the occurrence of that thing, and so you record a transaction in your data warehouse and you’re good to go.
Transaction Fact YouTube: Techlake
Cumulative
This type of fact table describes what has happened over a period of time. For example, this fact table may describe
the total sales by product by store by day. The facts for this type of fact tables are mostly additive facts. The first
example presented here is a cumulative fact table.
Cumulative Fact YouTube: Techlake
Snapshot: (Periodic) Snapshot fact tables capture the state of the measures based on the occurrence of a status
event or at a specified point-in-time or over specified time intervals (week, month, quarter, year, etc.).
Snapshot Fact YouTube: Techlake
YouTube: Techlake
Star Schema And Snowflake Schema YouTube: Techlake
Star Schema YouTube: Techlake
Snowflake Schema YouTube: Techlake
Fact Constellation
38
time_key
day
day_of_the_week
month
quarter
year
time
location_key
street
city
province_or_state
country
location
Sales Fact Table
time_key
item_key
branch_key
location_key
units_sold
dollars_sold
avg_sales
Measures
item_key
item_name
brand
type
supplier_type
item
branch_key
branch_name
branch_type
branch
Shipping Fact Table
time_key
item_key
shipper_key
from_location
to_location
dollars_cost
units_shipped
shipper_key
shipper_name
location_key
shipper_type
shipper
YouTube: Techlake
39
YouTube: Techlake
40
all
Europe North_America
Mexico
Canada
Spain
Germany
Vancouver
M. Wind
L. Chan
...
...
...
... ...
...
all
region
office
country
Toronto
Frankfurt
city
A Concept Hierarchy YouTube: Techlake
41
Databases
Files
ERP’s
Staging
DataMart-HR
DataMart- Inventory
Reports 1
DataMart-Sales
Reports 2
Reports 3
Top-down Approach
Extract
Transform
Load
YouTube: Techlake
42
Databases
Files
ERP’s
Staging
DataMart-HR
DataMart- Inventory
Reports 1
DataMart-Sales
Reports 2
Reports 3
Extract
Transform
Load
Bottom-up approach YouTube: Techlake
Data Warehouse in Traditional and big data architecture
YouTube: Techlake
Azure Cloud Data Lake Architecture YouTube: Techlake
Multi-Hop Architecture (LAKE HOUSE) YouTube: Techlake
Lambda Architecture with Azure Databricks
In proposed Lambda Architecture implementation, the Databricks is a main component as shown in the below diagram.
YouTube: Techlake
Kappa Architecture with Databricks
The Kappa Architecture suggests to remove the cold path from the Lambda Architecture and allow processing in near
real-time.
YouTube: Techlake
Differences between Data Lake , Cloud Warehouses and On-Premises Databases
YouTube: Techlake
Data Warehousing concepts for Data Engineering

Data Warehousing concepts for Data Engineering

  • 1.
  • 2.
    What is DataMigration? YouTube: Techlake
  • 3.
  • 4.
    4 Databases Files ERP’s Staging Reports 1 Reports 2 Reports3 Traditional DataWarehouse Flow Extract Transform Load YouTube: Techlake
  • 5.
    ETL Side MajorTransformations flow YouTube: Techlake
  • 6.
    6 What is OLTPSystem? • Database Systems have been used traditionally for OLTP • clerical data processing tasks • detailed, up to date data • structured repetitive tasks • read/update a few records • isolation, recovery and integrity are critical YouTube: Techlake
  • 7.
    ERP Process Flowand OLTP Transactions data YouTube: Techlake
  • 8.
    8 What is aOLAP? • Defined in many different ways, but not rigorously. • A decision support database that is maintained separately from the organization’s operational database • Support information processing by providing a solid platform of consolidated, historical data for analysis. • “A data warehouse is a subject-oriented, integrated, time-variant, and nonvolatile collection of data in support of management’s decision-making process.”—W. H. Inmon YouTube: Techlake
  • 9.
    9 9 What is DataWarehouse? A data warehouse is a type of data management system that is designed to enable and support business intelligence (BI) activities, especially analytics. Data warehouses are solely intended to perform queries and analysis and often contain large amounts of historical data. The data within a data warehouse is usually derived from a wide range of sources such as application log files and transaction applications. YouTube: Techlake
  • 10.
  • 11.
    A data warehouseis a subject-oriented, integrated, time-variant and non-volatile collection of data in support of management's decision making process. YouTube: Techlake
  • 12.
    A data warehousecan be used to analyze a particular subject area. For example, "sales" can be a particular subject. Subject-Oriented YouTube: Techlake
  • 13.
    A data warehouseintegrates data from multiple data sources. For example, source A and source B may have different ways of identifying a product, but in a data warehouse, there will be only a single way of identifying a product. Integrated YouTube: Techlake
  • 14.
    Historical data iskept in a data warehouse. For example, one can retrieve data from 3 months, 6 months, 12 months, or even older data from a data warehouse. This contrasts with a transactions system, where often only the most recent data is kept. For example, a transaction system may hold the most recent address of a customer, where a data warehouse can hold all addresses associated with a customer. Time-Variant YouTube: Techlake
  • 15.
    Once data isin the data warehouse, it will not change. So, historical data in a data warehouse should never be altered. Ralph Kimball provided a more concise definition of a data warehouse: Non-volatile No- Update Only- Analysis YouTube: Techlake
  • 16.
    16 16 Database normalization isthe process of structuring a database, usually a relational database, in accordance with a series of so-called normal forms in order to reduce data redundancy and improve data integrity. It was first proposed by E.F Codd as part of his relational model.. We call a relation normalized if: 1. it does not contain any redundancy 2. it does not cause maintenance problems 3. it is an accurate representation of the data Normalization YouTube: Techlake
  • 17.
    17 17 Denormalization is atechnique used by database administrators to optimize the efficiency of their database infrastructure. This method allows us to add redundant data into a normalized database to alleviate issues with database queries that merge data from several tables into a single table. The denormalization concept is based on the definition of normalization that is defined as arranging a database into tables correctly for a particular purpose. When we normalize tables, we break them into multiple smaller tables. So when we want to retrieve data from multiple tables, we need to perform some kind of join operation on them. In that case, we use the denormalization technique that eliminates the drawback of normalization. Denormalization YouTube: Techlake
  • 18.
    Data Models It wouldbe wildly inefficient to store all your data in one massive table. So, your data warehouse contains many tables that you can join together to get specific information. The main tables is called a fact table, and dimension tables surround it. The first step in designing a data warehouse is to build a conceptual data model that defines the data you want and the high-level relationships between them. YouTube: Techlake
  • 19.
    1) A dimensiontable contains dimensions of a fact. 2) They are joined to fact table via a foreign key. 3) Dimension tables are de-normalized tables. 4) The Dimension Attributes are the various columns in a dimension table 5) No set limit set for given for number of dimensions 6) The dimension can also contain one or more hierarchical relationships 7) Dimensions offers descriptive characteristics of the facts with the help of their attributes Dimension table YouTube: Techlake
  • 20.
    What is FactTable? 1. Fact table contains measurements, metrics, and facts about a business process while the Dimension table is a companion to the fact table which contains descriptive attributes to be used as query constraining. 2. Fact table is located at the center of a star or snowflake schema, whereas the Dimension table is located at the edges of the star or snowflake schema. 3. Fact table is defined by their grain or its most atomic level whereas Dimension table should be wordy, descriptive, complete, and quality assured. 4. Fact table helps to store report labels whereas Dimension table contains detailed data. 5. Fact table does not contain a hierarchy whereas the Dimension table contains hierarchies. YouTube: Techlake
  • 21.
    Types of Dimensions 1.Junk Dimensions 2. Conformed Dimensions 3. Degenerate Dimensions 4. Rapidly Changing Dimensions 5. Role Playing Dimensions 6. Inferred Dimensions 7. Shrunken Dimensions 8. Static Dimensions 9. Slowly Changing Dimensions Types of Facts 1. Transaction Fact 2. Snapshot Fact 3. Accumulated Fact 4. Fact-less Fact Types of Dimensions and Fact tables YouTube: Techlake
  • 22.
    A single tablethat includes a compilation of unrelated and different attributes is referred as the junk dimension table. This table is meant to avoid including a huge amount of foreign keys in the fact table. This table is often generated to handle foreign keys generated by the rapidly changing dimensions. Junk Dimensions YouTube: Techlake
  • 23.
    A conformed dimensionconnects to multiple fact tables A conformed dimension allow a consistent analysis of different business process metrics used across multiple dimensional models. A product dimension may join to the inventory, sales, procurement, and other fact tables. It is important to closely collaborate with data governance team to have a consistent definition for this dimension. Conformed Dimensions YouTube: Techlake
  • 24.
    Degenerate Dimensions A degeneratedimension is a special dimension like invoice number, check number that is an identifier for a transaction. However, it does not have attributes linked to it as all the important attributes are already part of their respective dimensions. So an invoice may have a customer name attribute but it's already a part of the customer dimension. A degenerate dimension is a part of the fact table but it's not a measure, it is still a dimension. YouTube: Techlake
  • 25.
    An attribute inthe dimension, which is changing frequently, is referred as the rapidly changing attribute. Handling rapidly changing dimension in data warehouse is very difficult because of many performance implications. As we know slowly changing dimension type 2 is used to maintain the history for the changes. But the problem with type 2 is, with each and every change in the dimension attribute, it adds new row to the table. If in case there are dimensions that are changing a lot, table become larger and may cause serious performance issues. Hence, use of the type 2 may not be the wise decision to implement the rapidly changing dimensions. Rapidly Changing Dimensions YouTube: Techlake
  • 26.
    Role Playing Dimensions RolePlaying Dimension A database Dimension that acts as multiple dimensions with in a cube is called as Role Playing Dimension. From the same table if we have multiple foreign keys in fact tables then the table acts differently for each key attribute. Example: Time Dimension is one of the best Example of Role playing Dimension, you can have one Time Dimension called Date and then you can add ShipDate, DueDate and OrderDate as Cube Dimensions. YouTube: Techlake
  • 27.
    Inferred Dimensions Sometimes, dimensionrecords might not be ready while loading the fact records. A solution to handle this situation is creating a surrogate key with a null value for the entire other attributes. This process is technically referred as the inferred member or inferred dimension. Inferred Dimension, also referred to as Early coming Fact or Late Arrival dimension. YouTube: Techlake
  • 28.
    The shrunken dimensiontable is referred as the subset of alternative dimension. Shrunken Dimensions Month could be a shrunken dimension of date(time or calendar) table, which could be connected to a fact which has grain of month like monthly sales. But this is a very classic example, let us deep dive a little with another example. YouTube: Techlake
  • 29.
    Static Dimensions :(no-source) A static dimension is a dimension that is not loaded from the source system. The static dimensions are generated using a SQL script or a stored procedure and are manually loaded. The time dimension is a classic example of a static dimension. Also, status codes dimension is mostly a static dimension. Static Dimensions A few common examples of the static dimensions would be "DIM_SOURCE_SYSTEMS", id source_name type status 1 SAP ERP Y 2 Oracle Database Y 3 DB2 Database Y 4 SalesForce ERP Y 5 systemlogs file Y YouTube: Techlake
  • 30.
    1. Additive: Additivefacts can be used with any aggregation function like Sum(), Avg() etc. Example is Quantity, sales amount etc 2. Semi-Additive: Semi-additive facts are facts that can be summed up for some of the dimensions in the fact table, but not the others. For example, Consider bank account details. You cannot apply the Sum() on the bank balance that does not give useful results but min() and max() function may return useful information 3. Non-Additive: Non-additive facts are facts that cannot be summed up for any of the dimensions present in the fact table. For example of non-additive fact is any kind of ratio or percentage. Non numeric facts can also be a non-additive facts Types of Facts YouTube: Techlake
  • 31.
    Transaction Fact Transaction facttables are easy to understand: a customer or business process does some thing; you want to capture the occurrence of that thing, and so you record a transaction in your data warehouse and you’re good to go. Transaction Fact YouTube: Techlake
  • 32.
    Cumulative This type offact table describes what has happened over a period of time. For example, this fact table may describe the total sales by product by store by day. The facts for this type of fact tables are mostly additive facts. The first example presented here is a cumulative fact table. Cumulative Fact YouTube: Techlake
  • 33.
    Snapshot: (Periodic) Snapshotfact tables capture the state of the measures based on the occurrence of a status event or at a specified point-in-time or over specified time intervals (week, month, quarter, year, etc.). Snapshot Fact YouTube: Techlake
  • 34.
  • 35.
    Star Schema AndSnowflake Schema YouTube: Techlake
  • 36.
  • 37.
  • 38.
    Fact Constellation 38 time_key day day_of_the_week month quarter year time location_key street city province_or_state country location Sales FactTable time_key item_key branch_key location_key units_sold dollars_sold avg_sales Measures item_key item_name brand type supplier_type item branch_key branch_name branch_type branch Shipping Fact Table time_key item_key shipper_key from_location to_location dollars_cost units_shipped shipper_key shipper_name location_key shipper_type shipper YouTube: Techlake
  • 39.
  • 40.
    40 all Europe North_America Mexico Canada Spain Germany Vancouver M. Wind L.Chan ... ... ... ... ... ... all region office country Toronto Frankfurt city A Concept Hierarchy YouTube: Techlake
  • 41.
    41 Databases Files ERP’s Staging DataMart-HR DataMart- Inventory Reports 1 DataMart-Sales Reports2 Reports 3 Top-down Approach Extract Transform Load YouTube: Techlake
  • 42.
    42 Databases Files ERP’s Staging DataMart-HR DataMart- Inventory Reports 1 DataMart-Sales Reports2 Reports 3 Extract Transform Load Bottom-up approach YouTube: Techlake
  • 43.
    Data Warehouse inTraditional and big data architecture YouTube: Techlake
  • 44.
    Azure Cloud DataLake Architecture YouTube: Techlake
  • 45.
    Multi-Hop Architecture (LAKEHOUSE) YouTube: Techlake
  • 46.
    Lambda Architecture withAzure Databricks In proposed Lambda Architecture implementation, the Databricks is a main component as shown in the below diagram. YouTube: Techlake
  • 47.
    Kappa Architecture withDatabricks The Kappa Architecture suggests to remove the cold path from the Lambda Architecture and allow processing in near real-time. YouTube: Techlake
  • 48.
    Differences between DataLake , Cloud Warehouses and On-Premises Databases YouTube: Techlake