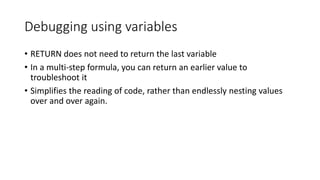
Downloaded 182 times


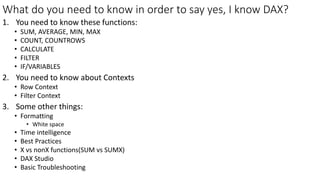

![Your first DAX expression
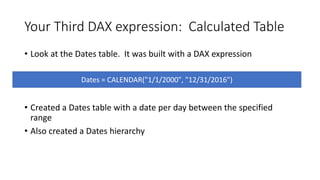
• Check Power BI Desktop tab “Your First DAX Expression”
• It’s a calculated column called Order Line Total
• Meant to add a column to every record in a table.
Order Line Total = 'Sales OrderDetails'[qty] * 'Sales OrderDetails'[unitprice]](https://image.slidesharecdn.com/introductiontodaxv2-180727181908/85/Introduction-to-DAX-7-320.jpg)
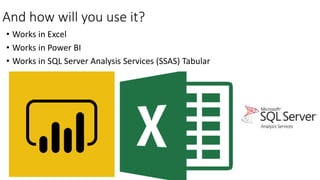
![Your Second DAX Expression
• Check Power BI Desktop tab “Your Second DAX Expression”
• This is a measure
• Meant to perform an aggregation that we can slice & dice
Total Sales = SUM('Sales OrderDetails'[Order Line Total])](https://image.slidesharecdn.com/introductiontodaxv2-180727181908/85/Introduction-to-DAX-8-320.jpg)

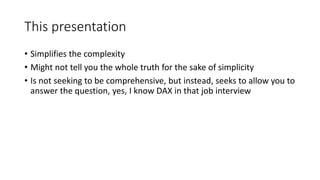
![DAX Expression Breakdown
Name the
measure.
You’ll use
that in the
visualization
Built in DAX formula
Table name
Column nameEquals sign separates
expression name from
expression formula
Total Sales = SUM('Sales OrderDetails'[Order Line Total])](https://image.slidesharecdn.com/introductiontodaxv2-180727181908/85/Introduction-to-DAX-10-320.jpg)
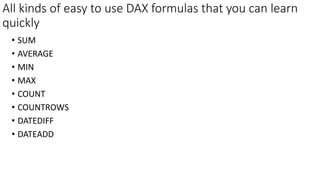
![• Look at tab “Easy DAX built-in formulas”
• Look under the Orders table for the calculated column “Days to Ship”
• Look under Orders table for measure “Average Days to Ship
Days To Ship = DATEDIFF('Sales Orders'[orderdate], 'Sales Orders'[shippeddate],DAY)
Play again: AVERAGE and DATEDIFF
Average Days to Ship = AVERAGE('Sales Orders'[Days To Ship])](https://image.slidesharecdn.com/introductiontodaxv2-180727181908/85/Introduction-to-DAX-12-320.jpg)

![Row Context
• We already know how this works! We’ve been using it for all of our calculated
columns. Let’s revisit our first DAX Expression
• Notice we expect a value per row in a table
• This runs at import and gets stored
• Might increase file size
Order Line Total = 'Sales OrderDetails'[qty] * 'Sales OrderDetails'[unitprice]](https://image.slidesharecdn.com/introductiontodaxv2-180727181908/85/Introduction-to-DAX-15-320.jpg)


![CALCULATE: Breaking out of the filter context
Beverages Total Sales = CALCULATE
(
SUM('Sales OrderDetails'[Order Line Total])
, 'Production Categories'[categoryname] = "Beverages"
)
AGGREGATION
FILTER
Look at the tab CALCULATE](https://image.slidesharecdn.com/introductiontodaxv2-180727181908/85/Introduction-to-DAX-21-320.jpg)
![FILTER
Number of Orders = COUNT('Sales Orders'[orderid])
Number of US Orders = CALCULATE
(
COUNT
(
'Sales OrderDetails'[orderid]
)
, FILTER
(
'Sales Customers'
, 'Sales Customers'[country] = "USA"
)
)](https://image.slidesharecdn.com/introductiontodaxv2-180727181908/85/Introduction-to-DAX-22-320.jpg)
![VARIABLES & RETURN
Total Sales For Customers with Minimum Order Count =
VAR MinimumOrderCount = 5
VAR CustomersWithMinimumOrders = CALCULATE
(
sum('Sales OrderDetails'[Order Line Total])
, FILTER('Sales Customers', [Number of Orders] > MinimumOrderCount)
)
RETURN CustomersWithMinimumOrders](https://image.slidesharecdn.com/introductiontodaxv2-180727181908/85/Introduction-to-DAX-23-320.jpg)

![Time Intelligence: TOTALYTD
YTD Total Sales = TOTALYTD
(
SUM('Sales OrderDetails'[Order Line Total])
, Dates[Date].[Date]
)](https://image.slidesharecdn.com/introductiontodaxv2-180727181908/85/Introduction-to-DAX-26-320.jpg)
![Time Intelligence: PREVIOUSMONTH
Total Sales Previous Month = CALCULATE
(
sum('Sales OrderDetails'[Order Line Total])
, PREVIOUSMONTH(Dates[Date])
)](https://image.slidesharecdn.com/introductiontodaxv2-180727181908/85/Introduction-to-DAX-27-320.jpg)

![SUM vs SUMX Example
Total Sales SUMX = SUMX(
'Sales OrderDetails'
, 'Sales OrderDetails'[qty] * 'Sales OrderDetails'[unitprice]
)
Total Sales = SUM('Sales OrderDetails'[Order Line Total])](https://image.slidesharecdn.com/introductiontodaxv2-180727181908/85/Introduction-to-DAX-29-320.jpg)
![Best Practice: Formatting
• DAX Expressions can have lots of parentheses and square brackets
• Please use white space to control this
• Here’s an example of a properly formatted calculated column
Days To Ship = DATEDIFF
(
'Sales Orders'[orderdate]
, 'Sales Orders'[shippeddate]
, DAY
)](https://image.slidesharecdn.com/introductiontodaxv2-180727181908/85/Introduction-to-DAX-32-320.jpg)
![Manipulating the relationships
Total Sales By Ship Year = CALCULATE
(
SUM('Sales OrderDetails'[Order Line Total])
, USERELATIONSHIP('Sales Orders'[shippeddate], Dates[Date])
)
Only one active relationship at a time](https://image.slidesharecdn.com/introductiontodaxv2-180727181908/85/Introduction-to-DAX-36-320.jpg)


The document introduces DAX, outlining essential functions, contexts, and best practices for using DAX in Power BI, Excel, and SSAS. It provides examples of calculated columns and measures, explaining concepts like row and filter contexts, variables, and time intelligence functions. The presentation emphasizes practical application through practice and troubleshooting techniques while also offering resources for further learning.


