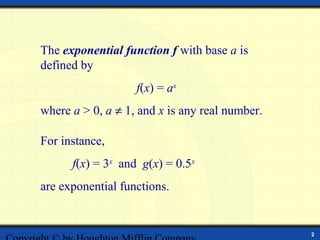
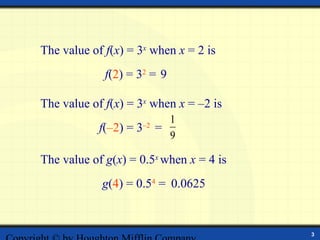
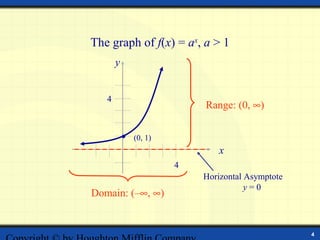
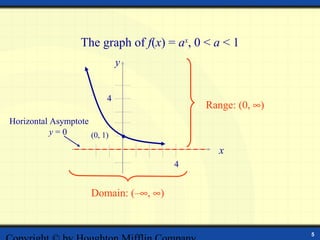
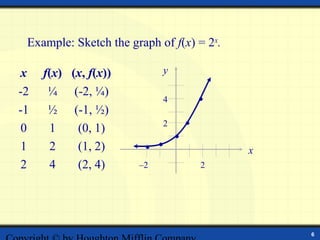
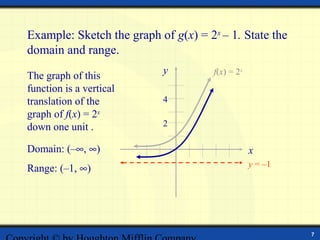
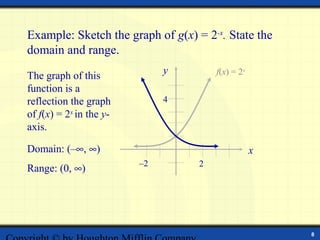
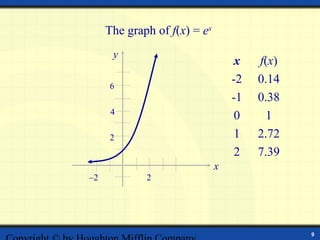
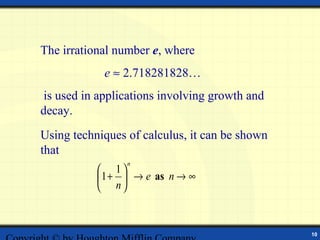
Digital Lesson


Exponential Functions and
     Their Graphs
The exponential function f with base a is
defined by
                   f(x) = ax
where a > 0, a ≠ 1, and x is any real number.

For instance,
      f(x) = 3x and g(x) = 0.5x
are exponential functions.


                                                2
The value of f(x) = 3x when x = 2 is
             f(2) = 32 = 9

The value of f(x) = 3x when x = –2 is
                               1
            f(–2) = 3   –2
                             =
                               9

The value of g(x) = 0.5x when x = 4 is
            g(4) = 0.54 = 0.0625


                                         3
The graph of f(x) = ax, a > 1
       y


   4
                        Range: (0, ∞)


           (0, 1)
                           x
                    4
                        Horizontal Asymptote
                                   y=0
Domain: (–∞, ∞)


                                               4
The graph of f(x) = ax, 0 < a < 1
                              y


                          4
                                             Range: (0, ∞)
Horizontal Asymptote
           y=0       (0, 1)

                                               x
                                        4


                      Domain: (–∞, ∞)


                                                             5
Example: Sketch the graph of f(x) = 2x.

x    f(x) (x, f(x))         y

-2    ¼ (-2, ¼)
                            4
-1    ½ (-1, ½)
                            2
0     1    (0, 1)
1     2    (1, 2)                          x
2     4    (2, 4)      –2          2


                                               6
Example: Sketch the graph of g(x) = 2x – 1. State the
domain and range.
                           y          f(x) = 2x
The graph of this
function is a vertical
translation of the         4
graph of f(x) = 2x
down one unit .            2

Domain: (–∞, ∞)                                   x
                                                  y = –1
Range: (–1, ∞)


                                                           7
Example: Sketch the graph of g(x) = 2-x. State the
domain and range.
                              y        f(x) = 2x
The graph of this
function is a
reflection the graph          4
of f(x) = 2x in the y-
axis.

Domain: (–∞, ∞)                                    x
                         –2        2
Range: (0, ∞)


                                                       8
The graph of f(x) = ex
      y
                                   x   f(x)
     6
                                  -2   0.14
                                  -1   0.38
      4
                                   0     1
     2                             1   2.72
                                   2   7.39
                              x
–2           2


                                              9
The irrational number e, where
            e ≈ 2.718281828…
is used in applications involving growth and
decay.
Using techniques of calculus, it can be shown
that
                 n
            1
            1 +  → e as n → ∞
            n


                                                10

Exponential functions

  • 1.
  • 2.
    The exponential functionf with base a is defined by f(x) = ax where a > 0, a ≠ 1, and x is any real number. For instance, f(x) = 3x and g(x) = 0.5x are exponential functions. 2
  • 3.
    The value off(x) = 3x when x = 2 is f(2) = 32 = 9 The value of f(x) = 3x when x = –2 is 1 f(–2) = 3 –2 = 9 The value of g(x) = 0.5x when x = 4 is g(4) = 0.54 = 0.0625 3
  • 4.
    The graph off(x) = ax, a > 1 y 4 Range: (0, ∞) (0, 1) x 4 Horizontal Asymptote y=0 Domain: (–∞, ∞) 4
  • 5.
    The graph off(x) = ax, 0 < a < 1 y 4 Range: (0, ∞) Horizontal Asymptote y=0 (0, 1) x 4 Domain: (–∞, ∞) 5
  • 6.
    Example: Sketch thegraph of f(x) = 2x. x f(x) (x, f(x)) y -2 ¼ (-2, ¼) 4 -1 ½ (-1, ½) 2 0 1 (0, 1) 1 2 (1, 2) x 2 4 (2, 4) –2 2 6
  • 7.
    Example: Sketch thegraph of g(x) = 2x – 1. State the domain and range. y f(x) = 2x The graph of this function is a vertical translation of the 4 graph of f(x) = 2x down one unit . 2 Domain: (–∞, ∞) x y = –1 Range: (–1, ∞) 7
  • 8.
    Example: Sketch thegraph of g(x) = 2-x. State the domain and range. y f(x) = 2x The graph of this function is a reflection the graph 4 of f(x) = 2x in the y- axis. Domain: (–∞, ∞) x –2 2 Range: (0, ∞) 8
  • 9.
    The graph off(x) = ex y x f(x) 6 -2 0.14 -1 0.38 4 0 1 2 1 2.72 2 7.39 x –2 2 9
  • 10.
    The irrational numbere, where e ≈ 2.718281828… is used in applications involving growth and decay. Using techniques of calculus, it can be shown that n  1  1 +  → e as n → ∞  n 10