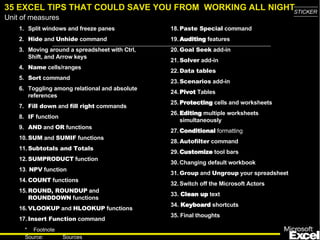
This document provides a summary of 35 Excel tips intended to save time for business analysts and associates. It covers functions and tools for splitting windows, hiding/unhiding rows and columns, sorting data, using formulas like IF, SUM, COUNT, and VLOOKUP, as well as formatting, filtering, and protecting worksheets. Exercises are provided for each tip to help users practice and learn when and how to apply each function.
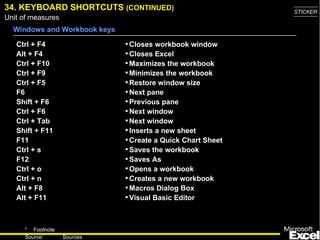
SEE MORE, INCLUDING A FREE TRIAL, AT: www.PivotTable-Pro.com
This video introduces you to Microsoft Excel 2013 and its program window.
Free Excel Training Course: http://www.SpreadsheetTrainer.com
Contents:
***Introduction - What is Microsoft Excel?***
***The Excel Program Window***
Program Window - Border & Title
How to Maximise the Excel Window
How to Minimise the Excel Window
How to Close the Excel Window
***The Excel Ribbon***
How to Hide & Show the Ribbon
What is the Excel Ribbon?
What are Groups?
What are Command Buttons?
What are Smart Tags?
What are Dialog Boxes?
What is the File tab & Backstage Menu?
The Excel Ribbon Shrinks When you Resize the Window
***Other Program Window Elements***
What is the Quick Access Toolbar?
What is the Name Box?
What is the Formula Bar?
How to Resize the Formula Bar
What is the Status bar?
Where are the View shortcuts?
How to use the Scroll Bars
What is the Spreadsheet Area?
What is the Mini Toolbar?
This walkthrough shows you some of the basics of creating functions and charts in Microsoft Excel. Using a fictional payroll report, you will learn how to create simple functions, conditionals functions, and even some simple charts with which to display your data.
Hi, This file will help you, your family and your child to know more about MS Excel 2007. The language and format, what we used is very easy and comfortable.
MS Excel Learning for PPC Google AdWords Training CourseRanjan Jena
MS Excel learning to get expertise in Google AdWords training course. Learn all important tips and techniques in MS Excel for your fast and easy approach to Google AdWords analysis and reporting formats.
Ranjan Jena conducts Adwords Training session in Bangalore, currently with more than 45 students already graduated under his guidance and mentorship. For any training need, you can directly reach him at +91-7760969452
It is normal to be faced with so many assignments in the office set up. This demands that one is efficient with assignments. One of the skills that is very crucial, although least known is the power MS Excel This slide presents the basics of MS Excel. It attempts to give a wide overview that one needs to know about Excel. These slides presents the basic structure of Excel such as layout, functions, formulae, charts, et cetra.
Introduction to Microsoft Excel basics | Excel Intro | Excel | Excel for star...Corp-sKool
Introduction to Microsoft excel. Document to explain basic working fundamental of excel i.e grids (rows and columns)Document specifies basic editing, formatting and validating the data entered in excel.
Watch this with a 10-15 minute audiotrack at http://vimeo.com/novusprogram/excel3
This lesson builds upon the concepts that were learned in the previous Excel lesson. The topics covered include using Excel’s powerful formulas to help perform data analysis on both large and small amounts of data. The objective of the lesson is for the user to be comfortable with calculating data variance, making informational comments, using advanced filtering techniques, and combining multiple sources of data. The lesson teaches concepts through a combination of image-based slides and video tutorials.
The Novus project is a combination of video tutorials designed to be used in conjunction with a free business simulation software program. The Novus Business and IT Program contains 36 business and IT training videos, covering basic finance, accounting, marketing, economics, business strategy, Word, Excel, and PowerPoint. Users will have an opportunity to apply the lessons in the Novus Business Simulator. Over six rounds, the user or teams will have to make decisions on capital purchases, financing, production, financing, and human resources for a microbrewery. This channel has arranged the 36 video lessons into the order in which they are meant to be used with the simulator. To watch this slideshow as a video, please go to our Vimeo page at: https://vimeo.com/novusprogram. To download our free business simulation software, please go to our SourceForge page at: http://sourceforge.net/projects/novus/.
SEE MORE, INCLUDING A FREE TRIAL, AT: www.PivotTable-Pro.com
This video teaches basic data entry and editing in Excel.
Free Excel Training Course: http://www.SpreadsheetTrainer.com
Contents:
***Data Entry in Excel***
How to Enter Data into a Cell
The Enter Status Mode
How to Structure Data
How to Exit a Cell with the Keyboard and Formula Bar
How to Cancel Cell Changes
How to Use Undo/Redo
How to Use AutoComplete
How to insert a New Line in a Cell
How to Enter a Block of Data using a Range
How to Instantly Insert Values into a Range
***Formulas vs Values vs Text***
The Differences between formulas, values and text
Entering negative numbers with minus sign or ()
Entering Dates & Times
Entering Percentages & Currencies
How Excel treats Text Entries vs Value Entries.
***Editing or Deleting Existing Entries***
How to Overwrite an Existing Entry
How to Edit an Existing Entry
The Edit Status Mode
How to delete a Current Entry with Delete & Clear Contents
A detailed description of what if analysis, Text To Column and Data Validation Options of Data Tab. I also linked excel file with this presentation but it doesn't support excel file,so excel file can't be uploaded.
Being a data analyst requires a variety of skills in Excel.
If you dream of working as an analyst, but you lack a few skills in order to master MS-Excel, TEST4U Data Analyst is the ultimate know-how interactive tutor!
We have equipped TEST4
SEE THE FULL, FREE EXCEL 2013 TRAINING COURSE AT WWW.PIVOTEXCEL.COM
This presentation introduces you to basic Excel function syntax and usage, and runs through some basic mathematical functions.
Contents:
***Standard Function Syntax***
Elements of an Excel Function
Inputting Function Arguments
AutoComplete for Functions
***Basic Numerical Functions***
Using Sum(), Max(), Min(), Average() and Count()
Functions Update Automatically as Arguments Change.
Using Comma and Colon to Reference Cells & Ranges.
Using Cell References, Values, Formulas or other Functions as Arguments.
Inserting a Formula into Many Cells at Once with CTRL+ Enter.
***The AutoSum & Quick Analysis Feature***
The Autosum Tool
The Quick Analysis Feature
***Function Library & Insert Function Tool***
Using the ‘Insert Function’ Tool.
***Editing & Deleting Functions***
Editing & Deleting Functions with Mouse & Keyboard
Editing a Function with the Insert Function Tool
Design Principles of Excel Dashboards & ReportsWiley
Get yourself into a dashboard state of mine with these best practices for Excel dashboards and reports.
Content from Excel Dashboards & Reports For Dummies by Michael Alexander. Learn more: http://bit.ly/FDExcelDashboards
and
SalesForce.com For Dummies by Tom Wong, Liz Kao, Matt Kaufma. Learn more: http://bit.ly/ForDummiesSF
This presentation gives you eight simple tips on how to make your PowerPoint presentation slides more visually engaging, creative and fun. Try out these advice and you will make your best PowerPoint presentation ever.
This presentation was created by my powerpoint design agency Slides. We are based in Spain but have clients worldwide.
Drop me an email and we will discuss your project.
for more such files , kindly visit Amazing Files at http://spicyflavours.net
Please join our slide share group
http://www.slideshare.net/group/spicy-flavours
This is an excellent presentation on usage of excel with tips which are very helpful in optimizing the things.
This could save you from working all night.
Gives you concise tips that u can readily use handy
Smart TV Buyer Insights Survey 2024 by 91mobiles.pdf91mobiles
91mobiles recently conducted a Smart TV Buyer Insights Survey in which we asked over 3,000 respondents about the TV they own, aspects they look at on a new TV, and their TV buying preferences.
Encryption in Microsoft 365 - ExpertsLive Netherlands 2024Albert Hoitingh
In this session I delve into the encryption technology used in Microsoft 365 and Microsoft Purview. Including the concepts of Customer Key and Double Key Encryption.
JMeter webinar - integration with InfluxDB and GrafanaRTTS
Watch this recorded webinar about real-time monitoring of application performance. See how to integrate Apache JMeter, the open-source leader in performance testing, with InfluxDB, the open-source time-series database, and Grafana, the open-source analytics and visualization application.
In this webinar, we will review the benefits of leveraging InfluxDB and Grafana when executing load tests and demonstrate how these tools are used to visualize performance metrics.
Length: 30 minutes
Session Overview
-------------------------------------------
During this webinar, we will cover the following topics while demonstrating the integrations of JMeter, InfluxDB and Grafana:
- What out-of-the-box solutions are available for real-time monitoring JMeter tests?
- What are the benefits of integrating InfluxDB and Grafana into the load testing stack?
- Which features are provided by Grafana?
- Demonstration of InfluxDB and Grafana using a practice web application
To view the webinar recording, go to:
https://www.rttsweb.com/jmeter-integration-webinar
Builder.ai Founder Sachin Dev Duggal's Strategic Approach to Create an Innova...Ramesh Iyer
In today's fast-changing business world, Companies that adapt and embrace new ideas often need help to keep up with the competition. However, fostering a culture of innovation takes much work. It takes vision, leadership and willingness to take risks in the right proportion. Sachin Dev Duggal, co-founder of Builder.ai, has perfected the art of this balance, creating a company culture where creativity and growth are nurtured at each stage.
LF Energy Webinar: Electrical Grid Modelling and Simulation Through PowSyBl -...DanBrown980551
Do you want to learn how to model and simulate an electrical network from scratch in under an hour?
Then welcome to this PowSyBl workshop, hosted by Rte, the French Transmission System Operator (TSO)!
During the webinar, you will discover the PowSyBl ecosystem as well as handle and study an electrical network through an interactive Python notebook.
PowSyBl is an open source project hosted by LF Energy, which offers a comprehensive set of features for electrical grid modelling and simulation. Among other advanced features, PowSyBl provides:
- A fully editable and extendable library for grid component modelling;
- Visualization tools to display your network;
- Grid simulation tools, such as power flows, security analyses (with or without remedial actions) and sensitivity analyses;
The framework is mostly written in Java, with a Python binding so that Python developers can access PowSyBl functionalities as well.
What you will learn during the webinar:
- For beginners: discover PowSyBl's functionalities through a quick general presentation and the notebook, without needing any expert coding skills;
- For advanced developers: master the skills to efficiently apply PowSyBl functionalities to your real-world scenarios.
Generating a custom Ruby SDK for your web service or Rails API using Smithyg2nightmarescribd
Have you ever wanted a Ruby client API to communicate with your web service? Smithy is a protocol-agnostic language for defining services and SDKs. Smithy Ruby is an implementation of Smithy that generates a Ruby SDK using a Smithy model. In this talk, we will explore Smithy and Smithy Ruby to learn how to generate custom feature-rich SDKs that can communicate with any web service, such as a Rails JSON API.
Dev Dives: Train smarter, not harder – active learning and UiPath LLMs for do...UiPathCommunity
💥 Speed, accuracy, and scaling – discover the superpowers of GenAI in action with UiPath Document Understanding and Communications Mining™:
See how to accelerate model training and optimize model performance with active learning
Learn about the latest enhancements to out-of-the-box document processing – with little to no training required
Get an exclusive demo of the new family of UiPath LLMs – GenAI models specialized for processing different types of documents and messages
This is a hands-on session specifically designed for automation developers and AI enthusiasts seeking to enhance their knowledge in leveraging the latest intelligent document processing capabilities offered by UiPath.
Speakers:
👨🏫 Andras Palfi, Senior Product Manager, UiPath
👩🏫 Lenka Dulovicova, Product Program Manager, UiPath
Connector Corner: Automate dynamic content and events by pushing a buttonDianaGray10
Here is something new! In our next Connector Corner webinar, we will demonstrate how you can use a single workflow to:
Create a campaign using Mailchimp with merge tags/fields
Send an interactive Slack channel message (using buttons)
Have the message received by managers and peers along with a test email for review
But there’s more:
In a second workflow supporting the same use case, you’ll see:
Your campaign sent to target colleagues for approval
If the “Approve” button is clicked, a Jira/Zendesk ticket is created for the marketing design team
But—if the “Reject” button is pushed, colleagues will be alerted via Slack message
Join us to learn more about this new, human-in-the-loop capability, brought to you by Integration Service connectors.
And...
Speakers:
Akshay Agnihotri, Product Manager
Charlie Greenberg, Host
Transcript: Selling digital books in 2024: Insights from industry leaders - T...BookNet Canada
The publishing industry has been selling digital audiobooks and ebooks for over a decade and has found its groove. What’s changed? What has stayed the same? Where do we go from here? Join a group of leading sales peers from across the industry for a conversation about the lessons learned since the popularization of digital books, best practices, digital book supply chain management, and more.
Link to video recording: https://bnctechforum.ca/sessions/selling-digital-books-in-2024-insights-from-industry-leaders/
Presented by BookNet Canada on May 28, 2024, with support from the Department of Canadian Heritage.
Accelerate your Kubernetes clusters with Varnish CachingThijs Feryn
A presentation about the usage and availability of Varnish on Kubernetes. This talk explores the capabilities of Varnish caching and shows how to use the Varnish Helm chart to deploy it to Kubernetes.
This presentation was delivered at K8SUG Singapore. See https://feryn.eu/presentations/accelerate-your-kubernetes-clusters-with-varnish-caching-k8sug-singapore-28-2024 for more details.
GDG Cloud Southlake #33: Boule & Rebala: Effective AppSec in SDLC using Deplo...James Anderson
Effective Application Security in Software Delivery lifecycle using Deployment Firewall and DBOM
The modern software delivery process (or the CI/CD process) includes many tools, distributed teams, open-source code, and cloud platforms. Constant focus on speed to release software to market, along with the traditional slow and manual security checks has caused gaps in continuous security as an important piece in the software supply chain. Today organizations feel more susceptible to external and internal cyber threats due to the vast attack surface in their applications supply chain and the lack of end-to-end governance and risk management.
The software team must secure its software delivery process to avoid vulnerability and security breaches. This needs to be achieved with existing tool chains and without extensive rework of the delivery processes. This talk will present strategies and techniques for providing visibility into the true risk of the existing vulnerabilities, preventing the introduction of security issues in the software, resolving vulnerabilities in production environments quickly, and capturing the deployment bill of materials (DBOM).
Speakers:
Bob Boule
Robert Boule is a technology enthusiast with PASSION for technology and making things work along with a knack for helping others understand how things work. He comes with around 20 years of solution engineering experience in application security, software continuous delivery, and SaaS platforms. He is known for his dynamic presentations in CI/CD and application security integrated in software delivery lifecycle.
Gopinath Rebala
Gopinath Rebala is the CTO of OpsMx, where he has overall responsibility for the machine learning and data processing architectures for Secure Software Delivery. Gopi also has a strong connection with our customers, leading design and architecture for strategic implementations. Gopi is a frequent speaker and well-known leader in continuous delivery and integrating security into software delivery.
UiPath Test Automation using UiPath Test Suite series, part 4DianaGray10
Welcome to UiPath Test Automation using UiPath Test Suite series part 4. In this session, we will cover Test Manager overview along with SAP heatmap.
The UiPath Test Manager overview with SAP heatmap webinar offers a concise yet comprehensive exploration of the role of a Test Manager within SAP environments, coupled with the utilization of heatmaps for effective testing strategies.
Participants will gain insights into the responsibilities, challenges, and best practices associated with test management in SAP projects. Additionally, the webinar delves into the significance of heatmaps as a visual aid for identifying testing priorities, areas of risk, and resource allocation within SAP landscapes. Through this session, attendees can expect to enhance their understanding of test management principles while learning practical approaches to optimize testing processes in SAP environments using heatmap visualization techniques
What will you get from this session?
1. Insights into SAP testing best practices
2. Heatmap utilization for testing
3. Optimization of testing processes
4. Demo
Topics covered:
Execution from the test manager
Orchestrator execution result
Defect reporting
SAP heatmap example with demo
Speaker:
Deepak Rai, Automation Practice Lead, Boundaryless Group and UiPath MVP
The Art of the Pitch: WordPress Relationships and SalesLaura Byrne
Clients don’t know what they don’t know. What web solutions are right for them? How does WordPress come into the picture? How do you make sure you understand scope and timeline? What do you do if sometime changes?
All these questions and more will be explored as we talk about matching clients’ needs with what your agency offers without pulling teeth or pulling your hair out. Practical tips, and strategies for successful relationship building that leads to closing the deal.
The Art of the Pitch: WordPress Relationships and Sales
Excel Useful Tips
1. 35 Excel Tips That Could Save You from Working All Night
2. INTRODUCTORY NOTE What is it: The following material was developed for the Excel training program. Target audience: 1st year associates and business analysts, although there is nothing wrong doing this training as well with EMs and APs. Duration: 3-4 hours to walk through the explanations and give everyone a chance to actually practice. Faculty: Since the seniors showed that they can do and therefore they can expect their team members to do the same.
3. 35 EXCEL TIPS THAT COULD SAVE YOU FROM WORKING ALL NIGHT 1. Split windows and freeze panes 2. Hide and Unhide command 3. Moving around a spreadsheet with Ctrl, Shift, and Arrow keys 4. Name cells/ranges 5. Sort command 6. Toggling among relational and absolute references 7. Fill down and fill right commands 8. IF function 9. AND and OR functions 10. SUM and SUMIF functions 11. Subtotals and Totals 12. SUMPRODUCT function 13 . NPV function 14. COUNT functions 15. ROUND, ROUNDUP and ROUNDDOWN functions 16. VLOOKUP and HLOOKUP functions 17. Insert Function command 18. Paste Special command 19. Auditing features 20. Goal Seek add-in 21. Solver add-in 22. Data tables 23. Scenarios add-in 24. Pivot Tables 25. Protecting cells and worksheets 26. Editing multiple worksheets simultaneously 27. Conditional formatting 28. Autofilter command 29. Customize tool bars 30. Changing default workbook 31. Group and Ungroup your spreadsheet 32. Switch off the Microsoft Actors 33. Clean up text 34. Keyboard shortcuts 35. Final thoughts
4.
5.
6.
7.
8.
9.
10.
11.
12.
13.
14.
15.
16.
17.
18.
19.
20.
21.
22.
23. 16. VLOOKUP AND HLOOKUP FUNCTIONS (CONTINUED) Define a name for cells in your data Range Number the columns to easily check your formulas Need to sort in ascending order for VLOOKUP function to work properly
24.
25.
26.
27.
28.
29.
30.
31.
32.
33. 23. SCENARIOS ADD-IN (SIMPLE EXAMPLE) Objective: You want to build a simple model to understand under which scenarios Airbus should build the A3XX a next generation super large airplane with more than 600 seats Simple model: Profit = number of planes sold x price x margin - development cost Scenarios Worst case Realistic Best case No. of planes 200 350 500 Price (million. USD) 120 130 150 Margin 20% 25% 30% R&D 13 billion USD 12 billion USD 11 billion USD