ACCURACY
● The abilityof an instrument to measure the accurate value is known as accuracy.
In other words, it is the the closeness of the measured value to a standard or
true value. Accuracy is obtained by taking small readings. The small reading
reduces the error of the calculation.
● Accuracy is a measure of the difference between the mean value or experimental
value of a set of measurements and the true value.
Accuracy = Mean Value – True Value
● The smaller the difference between the mean value and true value, the larger is
the accuracy. To understand this statement, let us consider an example.
3.
Suppose there isa compound that contains 30.8% of sulfur. You perform an experiment
to determine the same. Through method A, the mean value of sulfur obtained was 31.3%.
And through method B, the mean value obtained was 31.5%.
Accuracy of method A = 31.3 – 30.8 = 0.5%
Accuracy of method B = 31.5 – 30.8 = 0.7%
Hence, method A gives more accurate data. Accuracy also expresses the correctness
of measurement.
The concept of accuracy is not useful when the true value is not known to us. For
such cases, we use the concept of precision.
EXAMPLE:
4.
TYPES OF ACCURACY
PointAccuracy
- Point accuracy refers to the instrument’s accuracy just at a certain point on
its scale. This accuracy provides no information regarding the instrument’s overall
accuracy.
Accuracy as Percentage of the scale range
- A measurement’s accuracy is determined by its uniform scale range.
Accuracy as Percentage of True Value
- The accuracy of the instruments is assessed by comparing the measured
value to their true value. While measuring the accuracy, up to ±0.5% can be overlooked
from the true value.
5.
It refers tohow closely two or more measurements of the same
quantity agree with one another. It is expressed as the difference between a
measured value and the arithmetic mean value for a series of
measurements.
Precision = Individual Value – Arithmetic Mean
Thus, precision gives the extent of agreement between the
repeated measurements of the same quantity. This means, the smaller the
difference between the individual values of repeated measurements, the
greater the precision.
PRECISION
6.
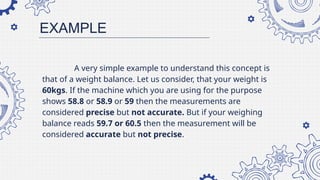
A very simpleexample to understand this concept is
that of a weight balance. Let us consider, that your weight is
60kgs. If the machine which you are using for the purpose
shows 58.8 or 58.9 or 59 then the measurements are
considered precise but not accurate. But if your weighing
balance reads 59.7 or 60.5 then the measurement will be
considered accurate but not precise.
EXAMPLE
7.
TYPES OF
PRECISION
Repeatability
The variancein readings that occurs when the same individual
measures the same part several times using the same equipment and
procedure under the same conditions is referred to as repeatability.
Reproducibility
The variance in readings when a different individual
measures the same part several times using the same equipment
under the same conditions is referred to as reproducibility.
8.
DIFFERENCE BETWEEN ACCURACYAND
PRECISION
Accuracy Precision
Accuracy is the measure of closeness of
the answer with the true value of the
quantity being measured.
Precision is a measure of reproducibility i.e.
getting the same value again and again in a
measurement.
Measurement can be accurate but not
necessarily precise.
Measurement can be precise but not
necessarily accurate.
It can be determined with a single
measurement.
It needs several measurements to be
determined.
Accuracy values have to be precise in most
cases.
Precise values may or may not be accurate.
It is called a degree of conformity. It is called a degree of reproducibility
10.
TYPES OF ERROR
Measurementerrors may be classified either random or systematic,
depending on how the measurement was obtained (an instrument could cause a
random error in one situation and a systematic error in another).
• Random errors are statistical fluctuations (in either direction) in the measured
data due to the precision limitations of the measurement device. Random errors
can be evaluated through statistical analysis and can be reduced by averaging
over many observations (see standard error).
• Systematic errors are reproducible inaccuracies that are consistently in the
same direction. These errors are difficult to detect and cannot be analyzed
statistically. If a systematic error is identified when calibrating against a standard,
applying a correction or correction factor to compensate for the effect can reduce
the bias. Unlike random errors, systematic errors cannot be detected or reduced
by increasing the number of observations.
11.
TYPES OF ERROR
Whenmaking careful measurements, our goal is to reduce as many
sources of error as possible and to keep track of those errors that we can not
eliminate. It is useful to know the types of errors that may occur, so that we may
recognize them when they arise. Common sources of error in physics laboratory
experiments:
• Incomplete definition (may be systematic or random) — One reason that it is
impossible to make exact measurements is that the measurement is not always
clearly defined.
For example, if two different people measure the length of the same
string, they would probably get different results because each person may stretch
the string with a different tension. The best way to minimize definition errors is to
carefully consider and specify the conditions that could affect the measurement.
12.
TYPES OF ERROR
•Failure to account for a factor (usually systematic) — The most challenging
part of designing an experiment is trying to control or account for all possible
factors except the one independent variable that is being analyzed.
For instance, you may inadvertently ignore air resistance when measuring
free-fall acceleration, or you may fail to account for the effect of the Earth's magnetic
field when measuring the field near a small magnet. The best way to account for
these sources of error is to brainstorm with your peers about all the factors that
could possibly affect your result. This brainstorm should be done before beginning
the experiment in order to plan and account for the confounding factors before taking
data. Sometimes a correction can be applied to a result after taking data to account
for an error that was not detected earlier.
13.
TYPES OF ERROR
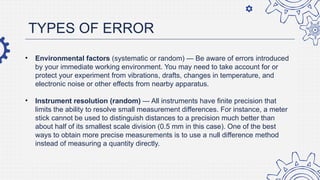
•Environmental factors (systematic or random) — Be aware of errors introduced
by your immediate working environment. You may need to take account for or
protect your experiment from vibrations, drafts, changes in temperature, and
electronic noise or other effects from nearby apparatus.
• Instrument resolution (random) — All instruments have finite precision that
limits the ability to resolve small measurement differences. For instance, a meter
stick cannot be used to distinguish distances to a precision much better than
about half of its smallest scale division (0.5 mm in this case). One of the best
ways to obtain more precise measurements is to use a null difference method
instead of measuring a quantity directly.
14.
TYPES OF ERROR
•Calibration (systematic) — Whenever possible, the calibration of an instrument
should be checked before taking data. If a calibration standard is not available,
the accuracy of the instrument should be checked by comparing with another
instrument that is at least as precise, or by consulting the technical data provided
by the manufacturer. Calibration errors are usually linear (measured as a fraction
of the full-scale reading), so that larger values result in greater absolute errors.
• Zero offset (systematic) — When making a measurement with a micrometer
caliper, electronic balance, or electrical meter, always check the zero reading
first. Re-zero the instrument if possible, or at least measure and record the zero
offset so that readings can be corrected later. It is also a good idea to check the
zero reading throughout the experiment. Failure to zero a device will result in a
constant error that is more significant for smaller measured values than for larger
ones.
15.
TYPES OF ERROR
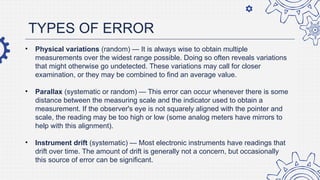
•Physical variations (random) — It is always wise to obtain multiple
measurements over the widest range possible. Doing so often reveals variations
that might otherwise go undetected. These variations may call for closer
examination, or they may be combined to find an average value.
• Parallax (systematic or random) — This error can occur whenever there is some
distance between the measuring scale and the indicator used to obtain a
measurement. If the observer's eye is not squarely aligned with the pointer and
scale, the reading may be too high or low (some analog meters have mirrors to
help with this alignment).
• Instrument drift (systematic) — Most electronic instruments have readings that
drift over time. The amount of drift is generally not a concern, but occasionally
this source of error can be significant.
16.
TYPES OF ERROR
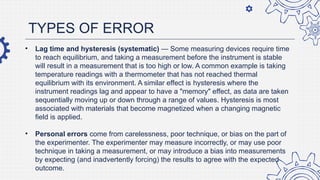
•Lag time and hysteresis (systematic) — Some measuring devices require time
to reach equilibrium, and taking a measurement before the instrument is stable
will result in a measurement that is too high or low. A common example is taking
temperature readings with a thermometer that has not reached thermal
equilibrium with its environment. A similar effect is hysteresis where the
instrument readings lag and appear to have a "memory" effect, as data are taken
sequentially moving up or down through a range of values. Hysteresis is most
associated with materials that become magnetized when a changing magnetic
field is applied.
• Personal errors come from carelessness, poor technique, or bias on the part of
the experimenter. The experimenter may measure incorrectly, or may use poor
technique in taking a measurement, or may introduce a bias into measurements
by expecting (and inadvertently forcing) the results to agree with the expected
outcome.
17.
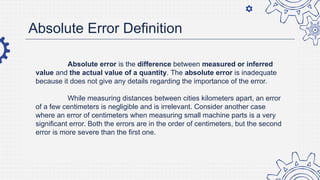
Absolute Error Definition
Absoluteerror is the difference between measured or inferred
value and the actual value of a quantity. The absolute error is inadequate
because it does not give any details regarding the importance of the error.
While measuring distances between cities kilometers apart, an error
of a few centimeters is negligible and is irrelevant. Consider another case
where an error of centimeters when measuring small machine parts is a very
significant error. Both the errors are in the order of centimeters, but the second
error is more severe than the first one.
18.
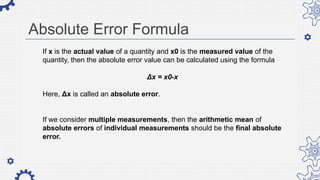
Absolute Error Formula
Ifx is the actual value of a quantity and x0 is the measured value of the
quantity, then the absolute error value can be calculated using the formula
Δx = x0-x
Here, Δx is called an absolute error.
If we consider multiple measurements, then the arithmetic mean of
absolute errors of individual measurements should be the final absolute
error.
19.
Absolute Error Example
Forexample, 24.13 is the actual value of a quantity and 25.09 is the
measure or inferred value, then the absolute error will be:
Absolute Error = 25.09 – 24.13
= 0.86
Most of the time it is sufficient to record only two decimal digits of the
absolute error. Thus, it is sufficient to state that the absolute error of the
approximation 4.55 to the correct value 4.538395 is 0.012.
20.
Relative Error
The relativeerror is defined as the ratio of the absolute error of the
measurement to the actual measurement. Using this method, we can
determine the magnitude of the absolute error in terms of the actual size of the
measurement. If the true measurement of the object is not known, then the
relative error can be found using the measured value. The relative error gives
an indication of how good measurement is relative to the size of the object being
measured.
21.
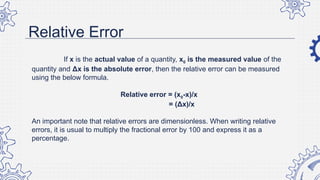
Relative Error
If xis the actual value of a quantity, x0 is the measured value of the
quantity and Δx is the absolute error, then the relative error can be measured
using the below formula.
Relative error = (x0-x)/x
= (Δx)/x
An important note that relative errors are dimensionless. When writing relative
errors, it is usual to multiply the fractional error by 100 and express it as a
percentage.
22.
Example 1:
Find theabsolute and relative errors of the approximation 125.67 to the value
119.66.
Solution:
Absolute error = |125.67-119.66|
=6.01
Relative error = |125.67-119.66|/119.66
= 0.05022
23.
PERCENT ERROR
Percent errorsindicate how big our errors are when we measure
something in an analysis process. Smaller percent errors indicate that we
are close to the accepted or original value. For example, a 1% error
indicates that we got very close to the accepted value, while 48% means
that we were quite a long way off from the true value. Measurement errors
are often unavoidable due to certain reasons like hands can shake,
material can be imprecise, or our instruments just might not have the
capability to estimate exactly. Percent error formula will let us know how
seriously these inevitable errors influenced our results.
24.
PERCENT ERROR FORMULA
Percenterror is the difference between estimated value and the
actual value in comparison to the actual value and is expressed as a
percentage. In other words, the percent error is the relative error multiplied
by 100.
The formula for percent error is:
PE = (|Estimated value-Actual value|/ Actual value) × 100
Here,
T = True or Actual value
E = Estimated value
25.
Estimating Uncertainty inRepeated Measurements
Suppose you time the period of oscillation of a pendulum using a
digital instrument (that you assume is measuring accurately) and find: T =
0.44 seconds. This single measurement of the period suggests a precision
of ±0.005 s, but this instrument precision may not give a complete sense of
the uncertainty. If you repeat the measurement several times and examine
the variation among the measured values, you can get a better idea of the
uncertainty in the period. For example, here are the results of 5
measurements, in seconds: 0.46, 0.44, 0.45, 0.44, 0.41.
26.
Estimating Uncertainty inRepeated Measurements
x1 + x2 + + xN
N
Average (mean) =
For this situation, the best estimate of the period is the average, or mean.
Whenever possible, repeat a measurement several times and average the
results. This average is generally the best estimate of the "true" value (unless the
data set is skewed by one or more outliers which should be examined to determine if
they are bad data points that should be omitted from the average or valid
measurements that require further investigation). Generally, the more repetitions you
make of a measurement, the better this estimate will be, but be careful to avoid
wasting time taking more measurements than is necessary for the precision required.
27.
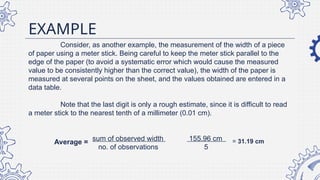
EXAMPLE
Consider, as anotherexample, the measurement of the width of a piece
of paper using a meter stick. Being careful to keep the meter stick parallel to the
edge of the paper (to avoid a systematic error which would cause the measured
value to be consistently higher than the correct value), the width of the paper is
measured at several points on the sheet, and the values obtained are entered in a
data table.
Note that the last digit is only a rough estimate, since it is difficult to read
a meter stick to the nearest tenth of a millimeter (0.01 cm).
sum of observed width 155.96 cm
no. of observations 5
= 31.19 cm
Average =
28.
VARIANCE
The term variancerefers to a statistical measurement
of the spread between numbers in a data set. More specifically,
variance measures how far each number in the set is from the
mean (average), and thus from every other number in the set.
29.
STANDARD DEVIATION
Standard deviationis the most common way to
characterize the spread of a data set. The standard deviation is
always slightly greater than the average deviation and is used
because of its association with the normal distribution that is
frequently encountered in statistical analyses.
30.
STANDARD DEVIATION
To calculatethe standard deviation for a sample of N measurements:
1. Sum all the measurements and divide by N to get the average or mean.
2. Now, subtract this average from each of the N measurements to obtain N "deviations".
3. Square each of these N deviations and add them all up.
4. Divide this result by (N − 1) and take the square root.
31.
EXAMPLE OF STANDARDDEVIATION
A garden contains 39 plants. The following plants were chosen
at random, and their heights were recorded in cm: 38, 51, 46,
79, and 57. Calculate their heights’ standard deviation.
32.
VARIANCE VS. STANDARD
DEVIATION
Varianceis the average squared deviations
from the mean, while standard deviation is the square
root of this number. Both measures reflect variability in
a distribution, but their units differ: Standard deviation
is expressed in the same units as the original values
(e.g., minutes or meters).