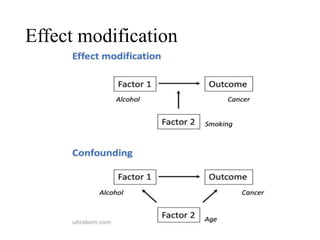
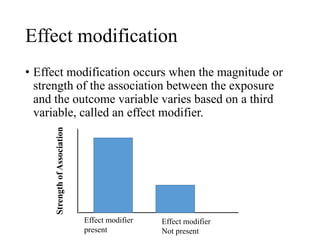
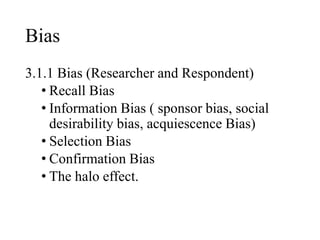
Epidemiology
Unit 3
Bias, Error, Confounding
and Effect Modification
4hrs
Radha Maharjan
MN(WHD)
Contents
3.1 Bias and Error in Epidemiology
3.1.1 Bias (Researcher and Respondent)
• Recall Bias
• Information Bias ( sponsor bias, social
desirability bias, acquiescence Bias)
• Selection Bias
• Confirmation Bias
• The halo effect.
Contents
3.1.2 Error
• Systematic Error
• Random Error
• Confounding & Effect Modification
Definition of Error
• A measure of the estimated difference between the
observed or calculated value of a quantity and its
true value.
Random error or Chance
• It is the by-chance error
• It makes observed value different from the true
value
• May occur through sampling variability or
random fluctuation of the event of interest due
to
• biological variability, sampling error and
measurement error (not due to machine)
• lack of precision in the measurement of an
association
Biological variability:
• The natural variability in a lab parameter due to
physiologic differences among subjects and
within the same subject over time.
• Differences between subjects due to differences in
diet, genetics or immune status.
Sampling error:
• Sampling error is a statistical error that occurs
when an analyst does not select a sample that
represents the entire population of data.
Measurement error:
• Measurement Error (also called Observational
Error) is the difference between a measured
quantity and its true value.
Random error or Chance
• Random error can never be completely
eliminated since we can study only a sample
of the population.
• Random error can be reduced by
• careful measurement of exposure and
outcome
• Proper selection of study
• Taking larger sample- increase the size of
the study.
Systematic error or Bias
• Systematic error (or bias) occurs in epidemiology
when results differ in a systematic manner from
the true values.
• Bias is any difference between the true value and
observed value due to all causes other than
random fluctuation and sampling variability.
• This type of error is generally more insidious and
hard to detect.
Systematic error or Bias
• For example over-estimate of blood sugar of every
subject by 0.05 mmol/l resulted from using
inaccurate analyser.
• The possible sources of systematic error are many
and varied but the important biases are selection
bias, measurement bias, confounding, information
bias, recall (respondent) bias, etc..
Sources of error in
epidemiological study
Common sources of error are
a) selection bias
b) absence or inadequacy of controls
c) unwarranted conclusions
d) improper interpretation of associations
e) mixing of non-comparable records
f) errors of measurement (intra-observer variation,
inter-observer variation), etc.
The error can be minimised through
• study design (by randomisation, restriction &
matching) and
• during analysis of the results (by stratification and
statistical modelling) ..
Selection bias
• Selection bias occurs when there is a systematic
difference between the characteristics of the
people selected for a study and the
characteristics of those who are not.
• An obvious source of selection bias occurs when
participants select themselves for a study, either
because they are unwell or because they are
particularly worried about an exposure.
Measurement bias
• Measurement bias occurs when the individual
measurements or classifications of disease or
exposure are inaccurate – that is, they do not
measure correctly what they are supposed to
measure.
• There are many sources of measurement bias and
their effects are of varying importance.
Measurement bias
• For instance, biochemical or physiological
measurements are never completely accurate and
different laboratories often produce different results
on the same specimen.
• If specimens from the exposed and control groups
are analysed randomly by different laboratories,
there is less chance for systematic measurement bias
than in the situation where all specimens from the
exposed group are analysed in one laboratory and
all those from the control group are analysed in
another
Confounding
• A confounder is an exposure, external to our
hypothesis, that biases our measure of association
unless it is controlled.
• When we compare our exposed population with the
unexposed comparison group the disease outcome
will be different in the two groups even if the
exposed had not been exposed.
• When we compare our exposed population with the
unexposed comparison group the disease outcome
will be different in the two groups even if the
exposed had not been exposed.
• For a schematic presentation of a simple alternative
causal link between E and D (E–C–D),
• Fig.
• Exposure (E)
• Disease (D)
• Confounder (C)
For example
• If E is alcohol, D is lung cancer,
and C is smoking
• Smoking would in many situations
confound the association E → D.
• Alcohol intake may be causally
related to smokingand smoking is
not part of the causal pathway we
take an interest in.
• Smoking and alcohol are expected to be associated
because they may share common causes such as
personality, peer pressure, and a genetic
predisposition for addiction.
The control of confounding
• Several methods are available to control
confounding, either through study design or during
the analysis of results.
• The methods commonly used to control
confounding in the design of an epidemiological
study are:
• randomization
• restriction
• matching.
• At the analysis stage, confounding can be controlled
by:
• stratification
• statistical modeling
Randomization
• In experimental studies, randomization is the ideal
method for ensuring that potential confounding
variables are equally distributed among the groups
being compared.
• The sample sizes have to be sufficiently large to
avoid random mal-distribution of such variables.
• Randomization avoids the association between
potentially confounding variables and the exposure
that is being considered.
Restriction
• We avoid confounding by eliminating the
association between E and C
• Limit the study to people who have particular
characteristics.
• For example, in a study on the effects of coffee on
coronary heart disease, participation in the study
could be restricted to nonsmokers, thus removing
any potential effect of confounding by cigarette
smoking.
• If C is age we can restrict the study to a narrow age
ban.
Restriction
• If C is sex we can restrict the study to males or
females.
• If C is smoking we can perform the study among
smokers and non-smokers only.
• We can also design the study in such a way that no
association exists between E and C.
Matching
• Matching is used to control confounding by
selecting study participants so as to ensure that
potential confounding variables are evenly
distributed in the two groups being compared.
• For example, in a case-control study of exercise
and coronary heart disease, each patient with heart
disease can be matched with a control of the same
age group and sex to ensure that confounding by
age and sex does not occur.
Matching
In cohort study:
• We can match the follow-up study to make exposed
and unexposed comparable concerning the
distribution of sex, age, smoking, etc., or
• We can control for confounding in the analyses,
given we have data on confounders, for example by
stratifying the analyses
• Matching has been used extensively in case-
control studies but it can lead to problems in the
selection of controls if the matching criteria are too
strict or too numerous; this is called
overmatching
• Matching can be expensive and time-consuming,
but is particularly useful if the danger exists of there
being no overlap between cases and controls, such
as in a situation where the cases are likely to be
older than the controls
Stratification and statistical
modelling
• In large studies it is usually preferable to control
for confounding in the analytical phase rather
than in the design phase.
• Confounding can then be controlled by
stratification, which involves the measurement of
the strength of associations in well defined and
homogeneous categories (strata) of the
confounding variable.
Stratification and statistical
modelling
• If age is a confounder, the association may be
measured in,10-year age groups;
• If sex or ethnicity is a confounder, the association
is measured separately in men and women or in the
different ethnic groups.
• Methods are available for summarizing the overall
association by producing a weighted average of
the estimates calculated in each separate stratum.
Stratification and statistical
modelling
• Although stratification is conceptually simple and
relatively easy to carry out, it is often limited by
the size of the study and it can not help to control
many factors simultaneously, as is often
necessary.
• In this situation, multivariate statistical modeling
is required to estimate the strength of the
associations while controlling for several
confounding variables simultaneously; a range of
statistical techniques is available for these
analyses.
Effect modification
Effect modification
• Effect modification occurs when the magnitude or
strength of the association between the exposure
and the outcome variable varies based on a third
variable, called an effect modifier.
Strength
of
Association
Effect modifier
present
Effect modifier
Not present
Assignment
• Difference between effect modification and
confounding.
Bias
3.1.1 Bias (Researcher and Respondent)
• Recall Bias
• Information Bias ( sponsor bias, social
desirability bias, acquiescence Bias)
• Selection Bias
• Confirmation Bias
• The halo effect.
Bias definition
• Deviation of results or inferences from the truth,
or processes lead to such deviation.
• Any trend in the collection, analysis,
interpretation, publication, or review of data that
can lead to conclusions that are systematically
different from the truth.
Recall bias
• Recall bias is a systematic error that occurs when
participants do not remember previous events or
experiences accurately or omit details: the
accuracy and volume of memories may be
influenced by subsequent events and experiences.
• Recall bias is a problem in studies that use self-
reporting, such as
• case-control studies and
• retrospective cohort studies.
Information Bias
• Information bias can occur when the means for
obtaining information about the subjects in the
study are inadequate so that as a result some of the
information gathered regarding exposures and/or
disease outcomes is incorrect.
Selection Bias
• Occurs when individuals or groups in a study
differ systematically from the population of
interest leading to a systematic error in an
association or outcome
• For example, participants included in an influenza
vaccine trial may be healthy young adults,
whereas those who are most likely to receive the
intervention in practice may be elderly and have
many comorbidities, and are therefore not
representative.
Selection Bias
Selection bias conti……
• Selection bias can arise in studies because groups
of participants may differ in ways other than the
interventions or exposures under investigation.
• When this is the case, the results of the study are
biased by confounding.
Confirmation bias
• Confirmation bias is a type of cognitive bias and
represents an error of inductive inference toward
confirmation of the hypothesis under study.
• Confirmation bias is a phenomenon wherein
decision makers have been shown to actively seek
out and assign more weight to evidence that
confirms their hypothesis, and ignore or under-
weigh evidence that could disconfirm their
hypothesis.
The halo effect.
• The halo effect is a type of cognitive bias in which
our overall impression of a person influences how
we feel and think about their character.
• Essentially, your overall impression of a person
("He is nice!") impacts your evaluations of that
person's specific traits ("He is also smart!").
• Perceptions of a single trait can carry over to how
people perceive other aspects of that person.
The halo effect conti…
• The "halo effect" is when one trait of a person or
thing is used to make an overall judgment of that
person or thing.
• It supports rapid decisions, even if biased ones.

Epidemiology: unit 3 bias.pptx

  • 1.
    Epidemiology Unit 3 Bias, Error,Confounding and Effect Modification 4hrs Radha Maharjan MN(WHD)
  • 2.
    Contents 3.1 Bias andError in Epidemiology 3.1.1 Bias (Researcher and Respondent) • Recall Bias • Information Bias ( sponsor bias, social desirability bias, acquiescence Bias) • Selection Bias • Confirmation Bias • The halo effect.
  • 3.
    Contents 3.1.2 Error • SystematicError • Random Error • Confounding & Effect Modification
  • 4.
    Definition of Error •A measure of the estimated difference between the observed or calculated value of a quantity and its true value.
  • 5.
    Random error orChance • It is the by-chance error • It makes observed value different from the true value • May occur through sampling variability or random fluctuation of the event of interest due to • biological variability, sampling error and measurement error (not due to machine) • lack of precision in the measurement of an association
  • 6.
    Biological variability: • Thenatural variability in a lab parameter due to physiologic differences among subjects and within the same subject over time. • Differences between subjects due to differences in diet, genetics or immune status.
  • 7.
    Sampling error: • Samplingerror is a statistical error that occurs when an analyst does not select a sample that represents the entire population of data. Measurement error: • Measurement Error (also called Observational Error) is the difference between a measured quantity and its true value.
  • 8.
    Random error orChance • Random error can never be completely eliminated since we can study only a sample of the population. • Random error can be reduced by • careful measurement of exposure and outcome • Proper selection of study • Taking larger sample- increase the size of the study.
  • 9.
    Systematic error orBias • Systematic error (or bias) occurs in epidemiology when results differ in a systematic manner from the true values. • Bias is any difference between the true value and observed value due to all causes other than random fluctuation and sampling variability. • This type of error is generally more insidious and hard to detect.
  • 10.
    Systematic error orBias • For example over-estimate of blood sugar of every subject by 0.05 mmol/l resulted from using inaccurate analyser. • The possible sources of systematic error are many and varied but the important biases are selection bias, measurement bias, confounding, information bias, recall (respondent) bias, etc..
  • 11.
    Sources of errorin epidemiological study Common sources of error are a) selection bias b) absence or inadequacy of controls c) unwarranted conclusions d) improper interpretation of associations e) mixing of non-comparable records f) errors of measurement (intra-observer variation, inter-observer variation), etc.
  • 12.
    The error canbe minimised through • study design (by randomisation, restriction & matching) and • during analysis of the results (by stratification and statistical modelling) ..
  • 13.
    Selection bias • Selectionbias occurs when there is a systematic difference between the characteristics of the people selected for a study and the characteristics of those who are not. • An obvious source of selection bias occurs when participants select themselves for a study, either because they are unwell or because they are particularly worried about an exposure.
  • 14.
    Measurement bias • Measurementbias occurs when the individual measurements or classifications of disease or exposure are inaccurate – that is, they do not measure correctly what they are supposed to measure. • There are many sources of measurement bias and their effects are of varying importance.
  • 15.
    Measurement bias • Forinstance, biochemical or physiological measurements are never completely accurate and different laboratories often produce different results on the same specimen. • If specimens from the exposed and control groups are analysed randomly by different laboratories, there is less chance for systematic measurement bias than in the situation where all specimens from the exposed group are analysed in one laboratory and all those from the control group are analysed in another
  • 16.
    Confounding • A confounderis an exposure, external to our hypothesis, that biases our measure of association unless it is controlled. • When we compare our exposed population with the unexposed comparison group the disease outcome will be different in the two groups even if the exposed had not been exposed.
  • 17.
    • When wecompare our exposed population with the unexposed comparison group the disease outcome will be different in the two groups even if the exposed had not been exposed. • For a schematic presentation of a simple alternative causal link between E and D (E–C–D),
  • 18.
    • Fig. • Exposure(E) • Disease (D) • Confounder (C)
  • 19.
    For example • IfE is alcohol, D is lung cancer, and C is smoking • Smoking would in many situations confound the association E → D. • Alcohol intake may be causally related to smokingand smoking is not part of the causal pathway we take an interest in.
  • 20.
    • Smoking andalcohol are expected to be associated because they may share common causes such as personality, peer pressure, and a genetic predisposition for addiction.
  • 22.
    The control ofconfounding • Several methods are available to control confounding, either through study design or during the analysis of results. • The methods commonly used to control confounding in the design of an epidemiological study are: • randomization • restriction • matching.
  • 23.
    • At theanalysis stage, confounding can be controlled by: • stratification • statistical modeling
  • 24.
    Randomization • In experimentalstudies, randomization is the ideal method for ensuring that potential confounding variables are equally distributed among the groups being compared. • The sample sizes have to be sufficiently large to avoid random mal-distribution of such variables. • Randomization avoids the association between potentially confounding variables and the exposure that is being considered.
  • 25.
    Restriction • We avoidconfounding by eliminating the association between E and C • Limit the study to people who have particular characteristics. • For example, in a study on the effects of coffee on coronary heart disease, participation in the study could be restricted to nonsmokers, thus removing any potential effect of confounding by cigarette smoking. • If C is age we can restrict the study to a narrow age ban.
  • 26.
    Restriction • If Cis sex we can restrict the study to males or females. • If C is smoking we can perform the study among smokers and non-smokers only. • We can also design the study in such a way that no association exists between E and C.
  • 27.
    Matching • Matching isused to control confounding by selecting study participants so as to ensure that potential confounding variables are evenly distributed in the two groups being compared. • For example, in a case-control study of exercise and coronary heart disease, each patient with heart disease can be matched with a control of the same age group and sex to ensure that confounding by age and sex does not occur.
  • 28.
    Matching In cohort study: •We can match the follow-up study to make exposed and unexposed comparable concerning the distribution of sex, age, smoking, etc., or • We can control for confounding in the analyses, given we have data on confounders, for example by stratifying the analyses
  • 29.
    • Matching hasbeen used extensively in case- control studies but it can lead to problems in the selection of controls if the matching criteria are too strict or too numerous; this is called overmatching • Matching can be expensive and time-consuming, but is particularly useful if the danger exists of there being no overlap between cases and controls, such as in a situation where the cases are likely to be older than the controls
  • 30.
    Stratification and statistical modelling •In large studies it is usually preferable to control for confounding in the analytical phase rather than in the design phase. • Confounding can then be controlled by stratification, which involves the measurement of the strength of associations in well defined and homogeneous categories (strata) of the confounding variable.
  • 31.
    Stratification and statistical modelling •If age is a confounder, the association may be measured in,10-year age groups; • If sex or ethnicity is a confounder, the association is measured separately in men and women or in the different ethnic groups. • Methods are available for summarizing the overall association by producing a weighted average of the estimates calculated in each separate stratum.
  • 32.
    Stratification and statistical modelling •Although stratification is conceptually simple and relatively easy to carry out, it is often limited by the size of the study and it can not help to control many factors simultaneously, as is often necessary. • In this situation, multivariate statistical modeling is required to estimate the strength of the associations while controlling for several confounding variables simultaneously; a range of statistical techniques is available for these analyses.
  • 33.
  • 34.
    Effect modification • Effectmodification occurs when the magnitude or strength of the association between the exposure and the outcome variable varies based on a third variable, called an effect modifier. Strength of Association Effect modifier present Effect modifier Not present
  • 35.
    Assignment • Difference betweeneffect modification and confounding.
  • 36.
    Bias 3.1.1 Bias (Researcherand Respondent) • Recall Bias • Information Bias ( sponsor bias, social desirability bias, acquiescence Bias) • Selection Bias • Confirmation Bias • The halo effect.
  • 37.
    Bias definition • Deviationof results or inferences from the truth, or processes lead to such deviation. • Any trend in the collection, analysis, interpretation, publication, or review of data that can lead to conclusions that are systematically different from the truth.
  • 38.
    Recall bias • Recallbias is a systematic error that occurs when participants do not remember previous events or experiences accurately or omit details: the accuracy and volume of memories may be influenced by subsequent events and experiences. • Recall bias is a problem in studies that use self- reporting, such as • case-control studies and • retrospective cohort studies.
  • 39.
    Information Bias • Informationbias can occur when the means for obtaining information about the subjects in the study are inadequate so that as a result some of the information gathered regarding exposures and/or disease outcomes is incorrect.
  • 40.
    Selection Bias • Occurswhen individuals or groups in a study differ systematically from the population of interest leading to a systematic error in an association or outcome • For example, participants included in an influenza vaccine trial may be healthy young adults, whereas those who are most likely to receive the intervention in practice may be elderly and have many comorbidities, and are therefore not representative.
  • 41.
  • 42.
    Selection bias conti…… •Selection bias can arise in studies because groups of participants may differ in ways other than the interventions or exposures under investigation. • When this is the case, the results of the study are biased by confounding.
  • 43.
    Confirmation bias • Confirmationbias is a type of cognitive bias and represents an error of inductive inference toward confirmation of the hypothesis under study. • Confirmation bias is a phenomenon wherein decision makers have been shown to actively seek out and assign more weight to evidence that confirms their hypothesis, and ignore or under- weigh evidence that could disconfirm their hypothesis.
  • 44.
    The halo effect. •The halo effect is a type of cognitive bias in which our overall impression of a person influences how we feel and think about their character. • Essentially, your overall impression of a person ("He is nice!") impacts your evaluations of that person's specific traits ("He is also smart!"). • Perceptions of a single trait can carry over to how people perceive other aspects of that person.
  • 45.
    The halo effectconti… • The "halo effect" is when one trait of a person or thing is used to make an overall judgment of that person or thing. • It supports rapid decisions, even if biased ones.

Editor's Notes

  • #31 Stratification is defined as the act of sorting data, people, and objects into distinct groups or layers.