Downloaded 581 times
![Key Features
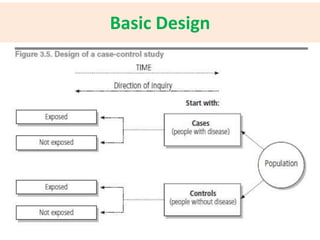
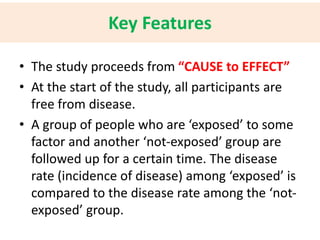
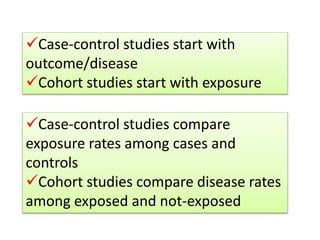
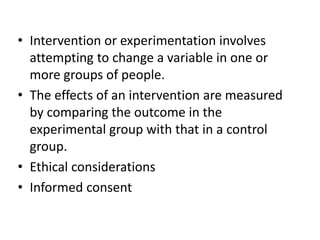
• The exposure experience of a group of people
who have the disease [CASES] is compared to
the exposure experience of a similar
(matched) group who do not have the disease
[CONTROLS]
• Suitable for rare diseases or diseases with long
latency periods
• The study proceeds backwards from “EFFECT
to CAUSE’](https://image.slidesharecdn.com/basicstepsinasurvey-141215031326-conversion-gate02/85/Epidemiological-Studies-15-320.jpg)

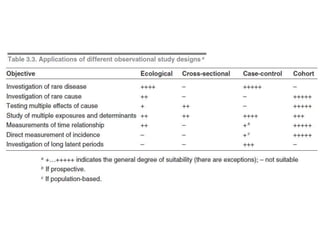
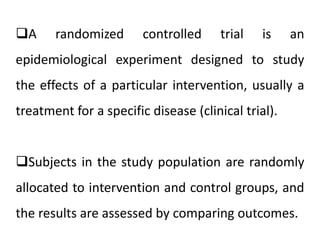
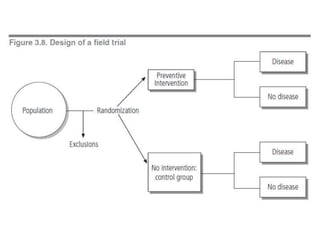


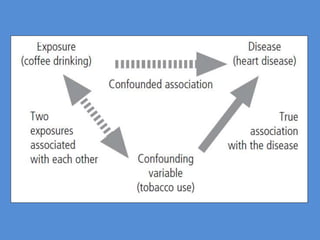
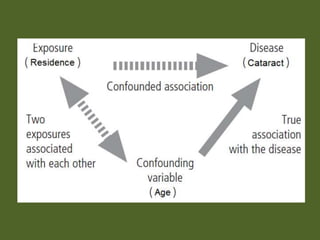
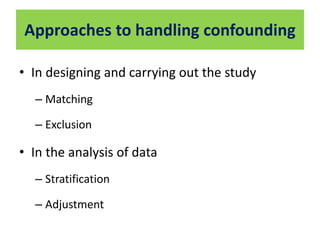

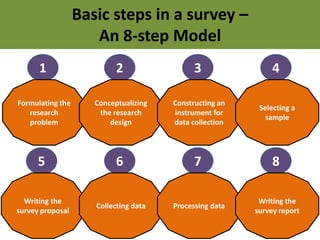
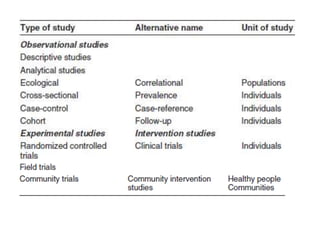
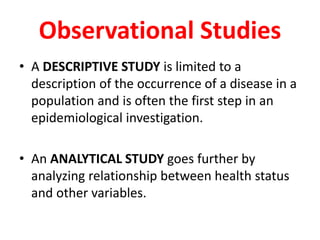
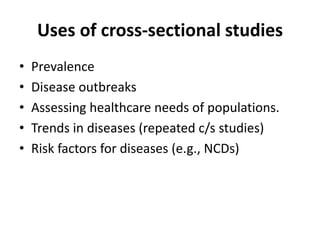
This document outlines different types of epidemiological study designs including observational studies like descriptive studies, analytical studies, ecological studies, cross-sectional studies and case-control studies. It also discusses experimental study designs like randomized controlled trials, field trials and community trials. Key features and steps are provided for case-control studies and cohort studies. Sources of bias and errors in epidemiological studies are also summarized.


![SMOKE - The Convenient Truth [1st place Worlds Best Presentation Contest] by ...](https://cdn.slidesharecdn.com/ss_thumbnails/smoke-theconvenienttruth-ep-101028211434-phpapp01-thumbnail.jpg?width=640&height=640&fit=bounds)