A cross-sectional study involves identifying a population at a single point in time and measuring variables like exposures and outcomes simultaneously. It can be descriptive by measuring single variables or analytical by examining associations between variables. While able to estimate disease prevalence and exposure proportions quickly, cross-sectional studies cannot determine causation due to issues like recall bias and inability to assess temporal sequence. Analysis uses contingency tables to calculate prevalence rates and measures of association like prevalence rate ratios.


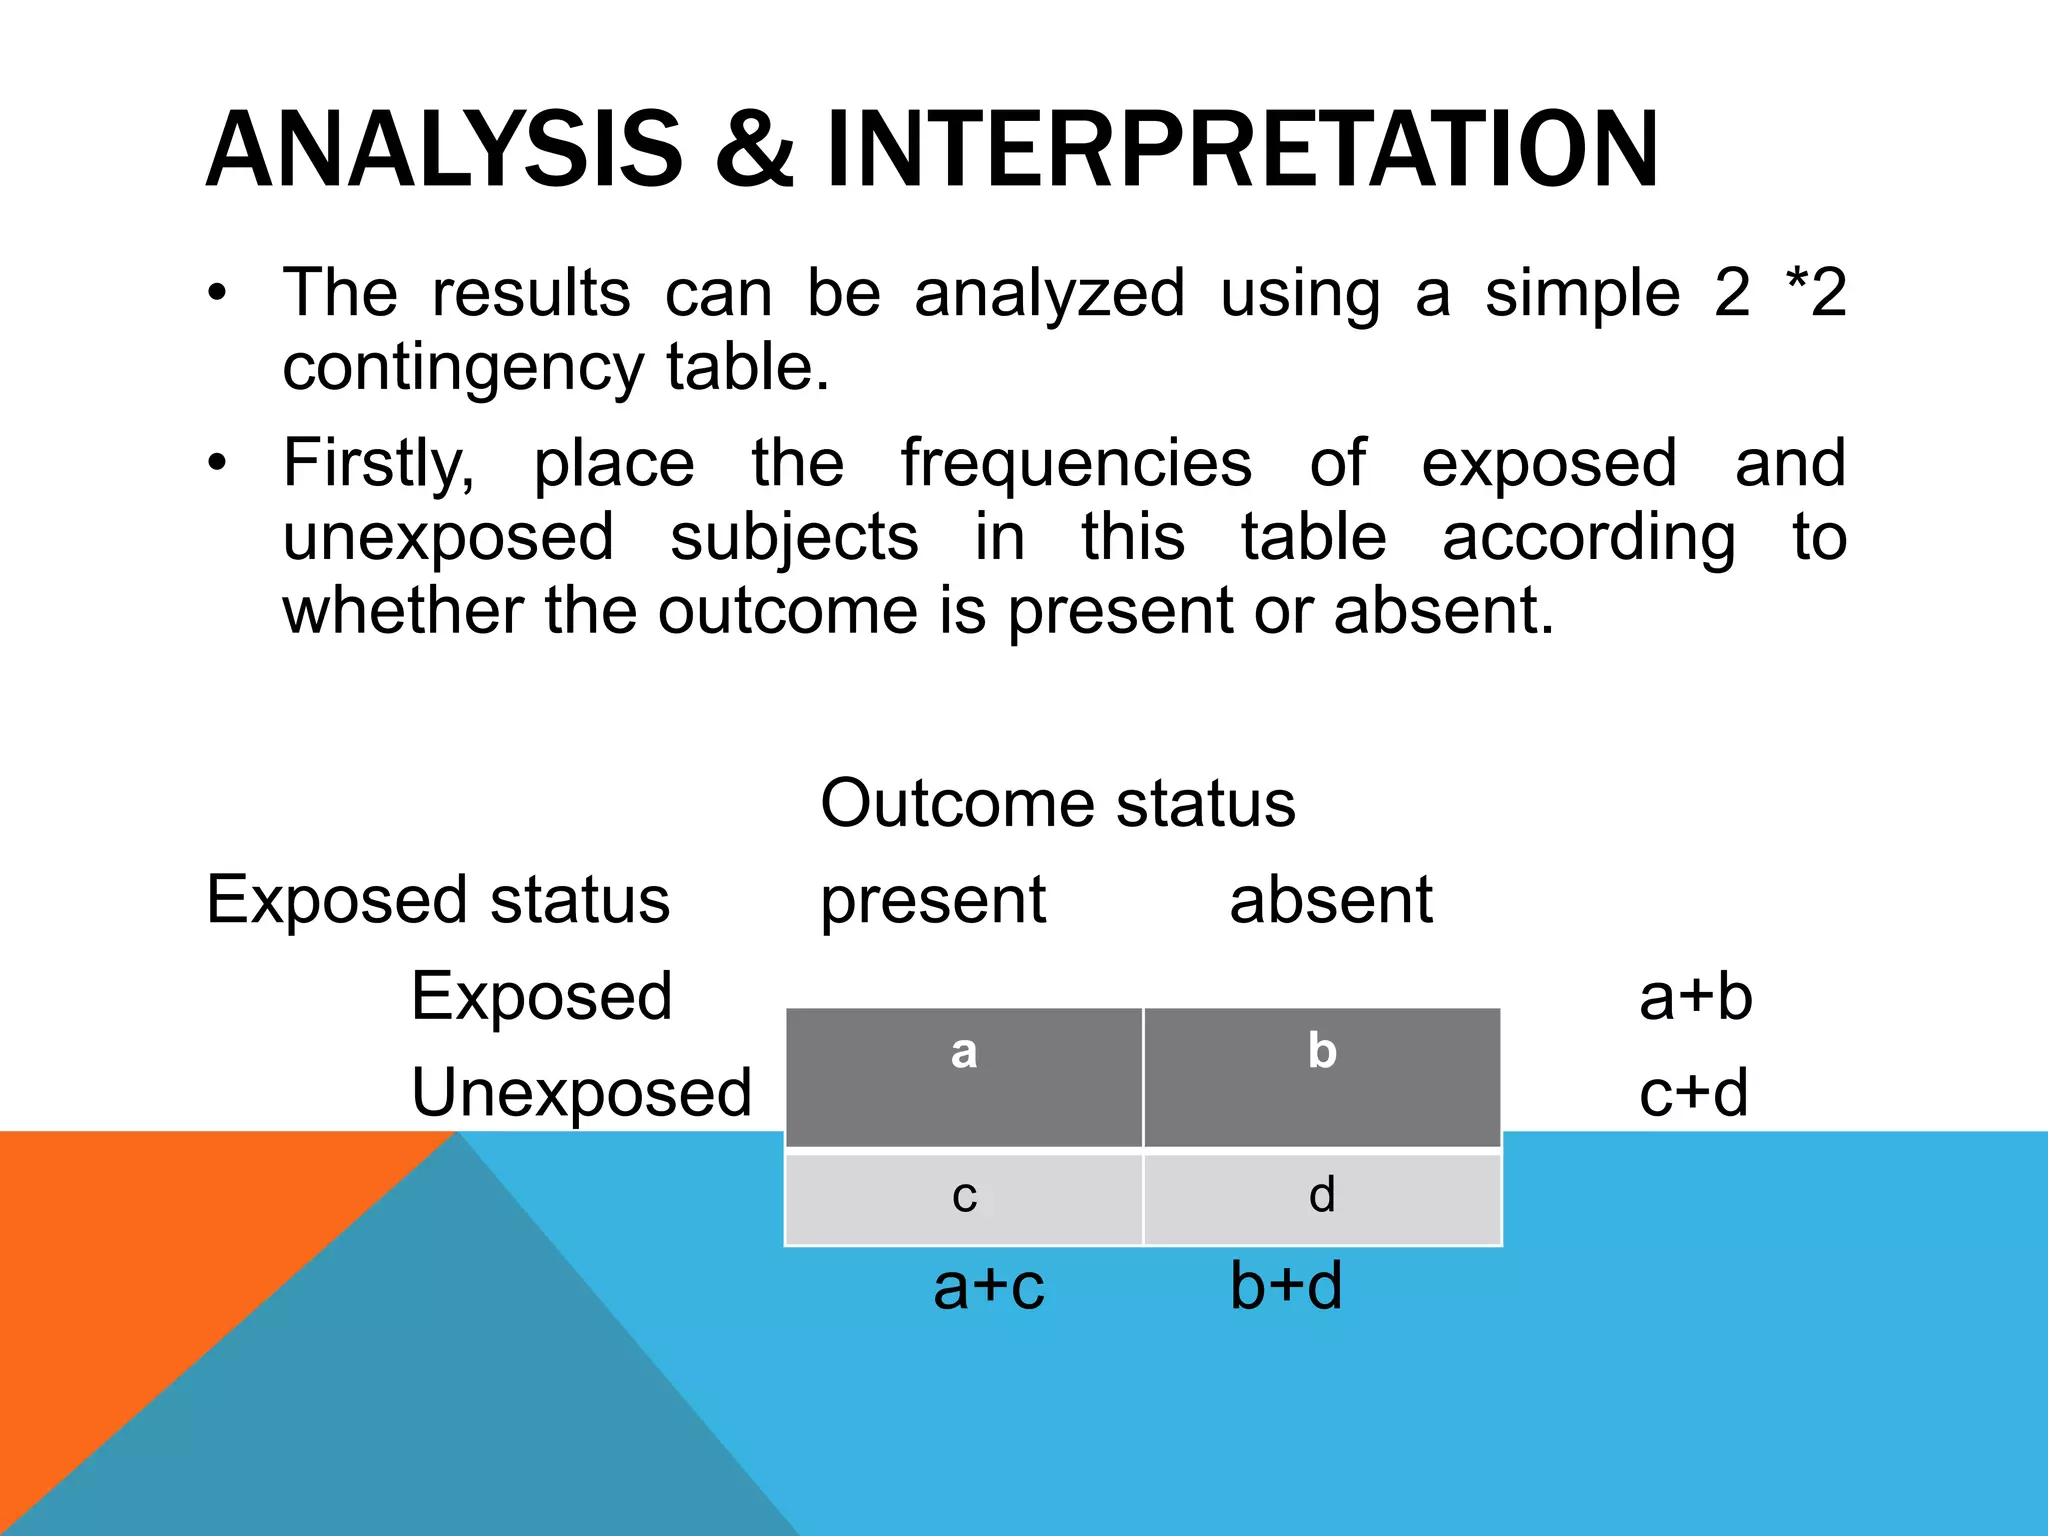
![• The frequencies a,b,c & d represents the no. of
exposed person with disease , the no. of exposed
person without disease, the no. of unexposed person
with disease, and the no. of unexposed person
wihtout disease, respectively.
• These values helps to calculate the prevalence rate
and measures the association.
• Crude prevalence rate (overall prevalence rate) is
calculated as,
PR = [(a+c) / n] * 10ⁿ](https://image.slidesharecdn.com/cross-secstudydrrahul-150706160215-lva1-app6891/75/Cross-sec-study-dr-rahul-15-2048.jpg)
![• Prevalence Rate among exposed subjects
PRe = [a / (a+b) ] * 10ⁿ
• Prevalence Rate among unexposed subjects
PRue = [c / (c+d) ] *10ⁿ
Now, these rates can be used to calculate the Prevalence
rate ratio (Prevalence ratio) and Prevalence rate
difference as under,
PRR = PRe / PRue
PRD = PRe - PRue](https://image.slidesharecdn.com/cross-secstudydrrahul-150706160215-lva1-app6891/75/Cross-sec-study-dr-rahul-16-2048.jpg)
![The statistical significance of PRR can be determined by the
chi square test of independence (X²), which for a 2*2
contingency table can be calculated by,
X² = n (ad - bc) ²
(a+b) (c+d) (a+c) (b+d)
If value of X²,
• From 3.84 to 6.63, association is considered as statistically
significant at p <=0.5
• From 6.64 to 10.82, association is significant at p <=0.01
• >=10.83, association is significant at p <=0.001
A 95%confidence intervall for PRR can be estimated using a
formula developed by D.Katz and associates.
95%CI = exp {ln(PRR) ± 1.96 √ [(b/a) / (a+b)] + [(d/c) (c+d)]}](https://image.slidesharecdn.com/cross-secstudydrrahul-150706160215-lva1-app6891/75/Cross-sec-study-dr-rahul-18-2048.jpg)