Downloaded 111 times
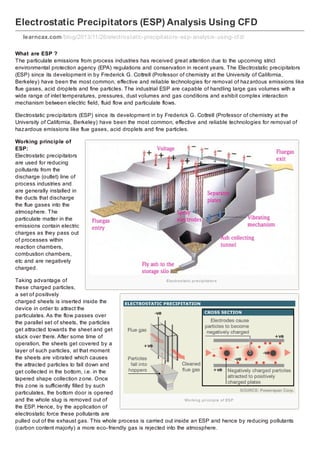
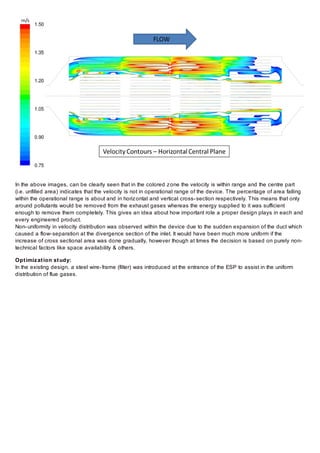


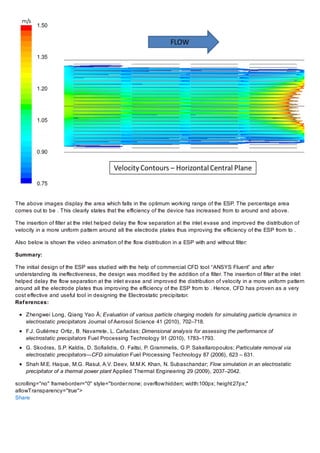

The document discusses the use of electrostatic precipitators (ESP) for reducing particulate emissions in industrial processes, highlighting their operational efficiency and importance in complying with environmental regulations. It details the working principle, challenges faced in ESP designs, and the utilization of Computational Fluid Dynamics (CFD) for optimizing ESP performance, particularly emphasizing the improvement achieved with design modifications like a filter at the inlet. Overall, the study demonstrates how CFD is crucial for enhancing ESP efficiency and reducing operational costs.
![[PPT] on Steam Turbine](https://cdn.slidesharecdn.com/ss_thumbnails/spsharmafinalppt-140608082156-phpapp01-thumbnail.jpg?width=640&height=640&fit=bounds)


![ESP (STEAG) - Session 1 Part 2_ppt [Read-Only] [Compatibility Mode].pdf](https://cdn.slidesharecdn.com/ss_thumbnails/espsteag-session1part2pptread-onlycompatibilitymode-250605064152-25f30eb4-thumbnail.jpg?width=640&height=640&fit=bounds)