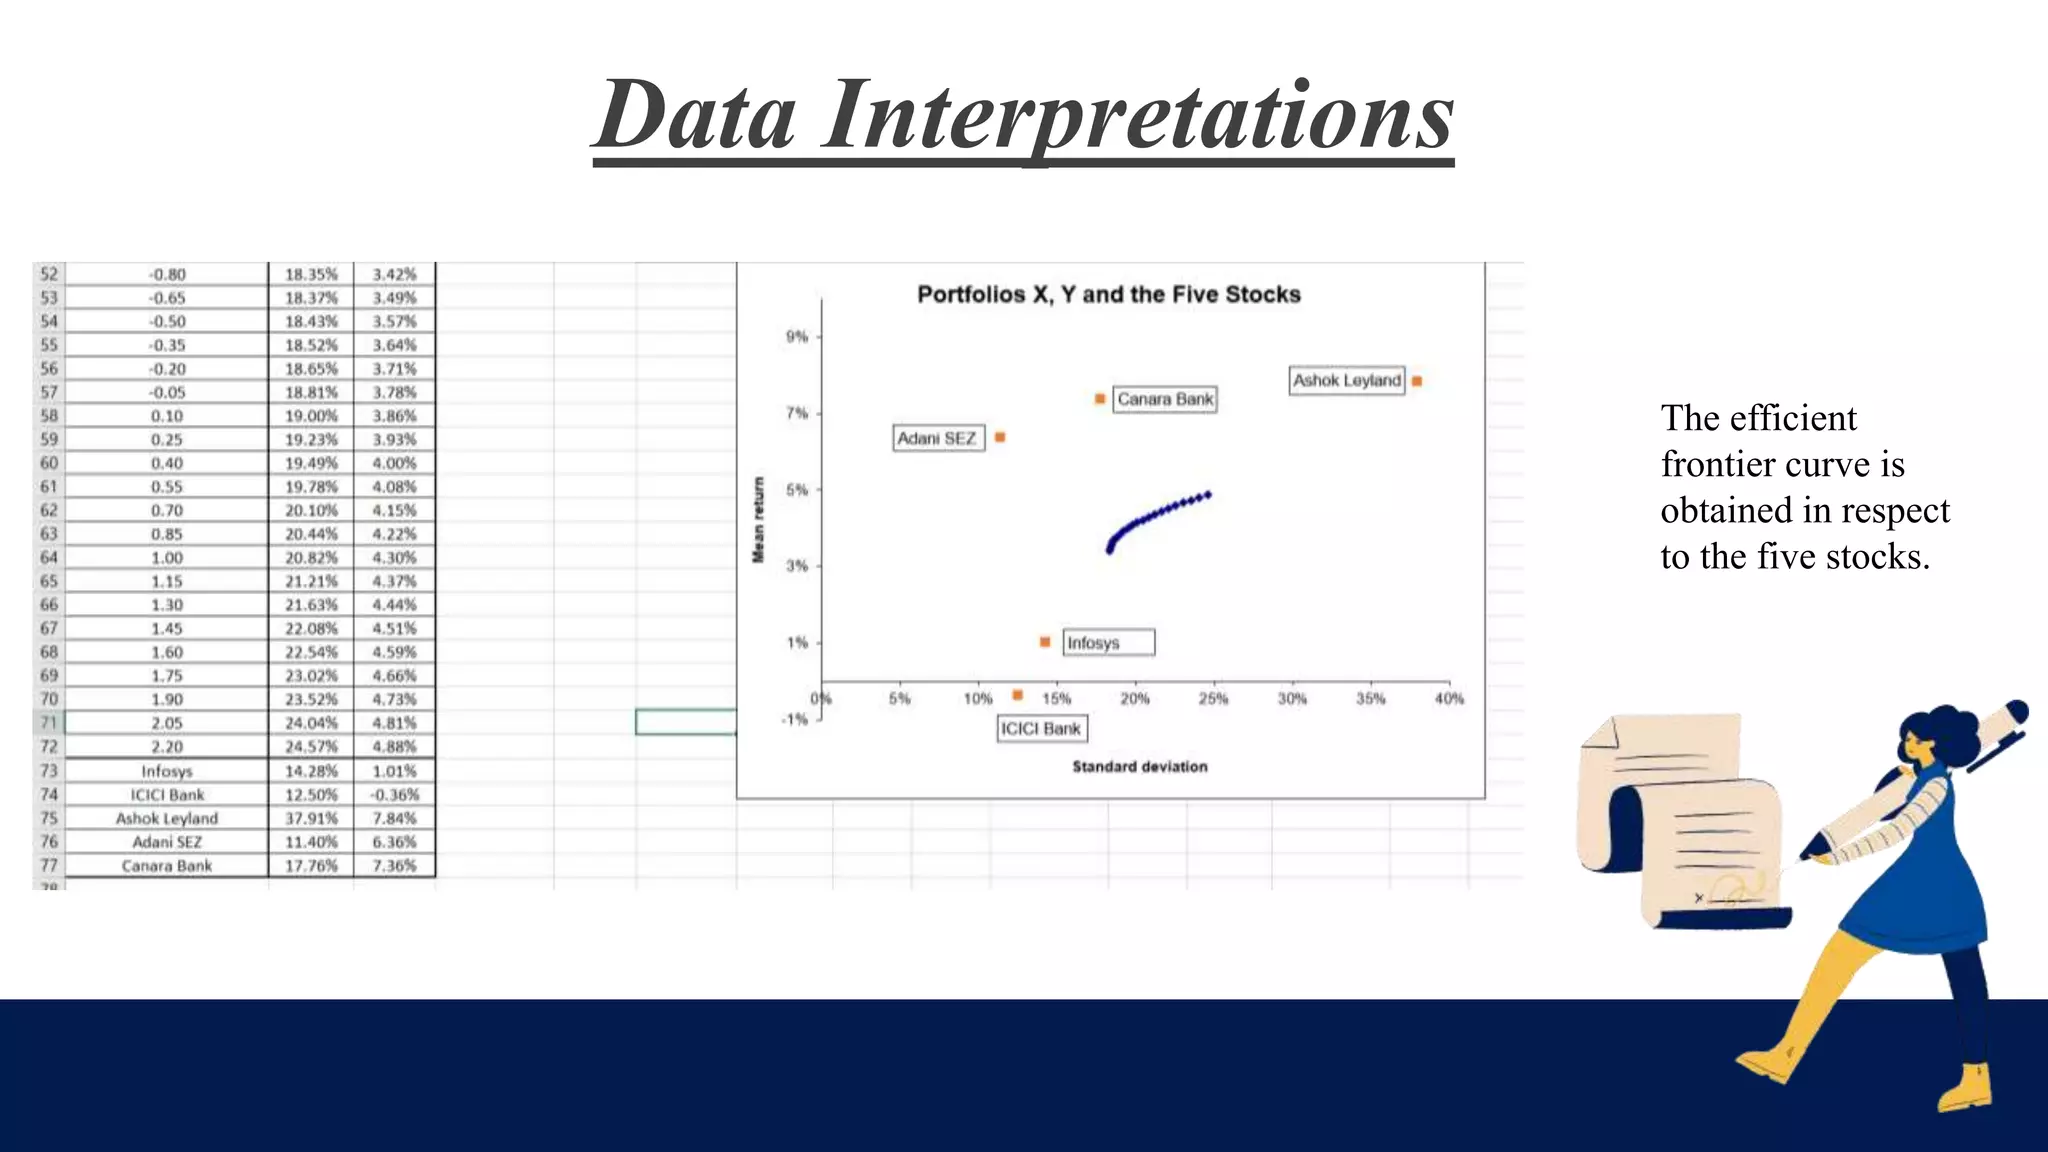
EFFICIENT
FRONTIER
Portfolio Management
Presenters:
Group: 2
Name Registration Number
Vishakha Gupta 21PGDM096
Aditya Mondal 21PGDM102
Arka Guha 21PGDM115
Dipayan Ghosh 21PGDM124
Karishma Agarwal 21PGDM134
Moquarim Akhter 21PGDM141
Sonali Bhandari 21PGDM178
3/11/2023 Annual Review 2
Explanation of The Dataset
We have selected the following stocks in our portfolio: 1. Infosys
2. ICICI Bank
3. Ashok Leyland
4. Adani SEZ
5. Canara Bank
To calculate the efficient Frontier of the portfolio we
used the 10 years of historical data on the returns of
these stocks.
The historical data for the years 2011 to 2021 was
collected from the NSE website.
3/11/2023 Annual Review 3
An efficient frontier is a set of investment portfolios that are expected to provide the highest returns
at a given level of risk. A portfolio is said to be efficient if there is no other portfolio that offers
higher returns for a lower or equal amount of risk. Where portfolios are located on the efficient
frontier depends on the investor’s degree of risk tolerance.
Efficient Frontier
5%
7%
9%
11%
13%
15%
30% 40% 50% 60% 70% 80%
Mean
return
Standard deviation
Portfolios x, y and the Four Stocks
Stock
The efficient frontier is a curved
line. It is because every increase in
risk results in a relatively smaller
amount of returns. In other words,
there is a diminishing marginal
return to risk, and it results in a
curvature.
3/11/2023 Annual Review 4
Steps in Excel
 First the Historical Returns of the five stocks are taken from the NSE
website and their mean, standard deviation & variance are calculated.
 Following that the excess return matrix is created in respect to the mean
returns of the stocks.
 Next we have created the variance covariance matrix by multiplying the
excess return matrix with its transpose.
 Following to that weights are assigned for the five stocks separately for
Portfolio X & Y
 The mean, Variance, Co-variance and the correlation of the two portfolios
are calculated.
 The return combinations are calculated for the portfolio with the mean
return and the standard deviation.
 Finally the portfolio is calculated in respect to different weights and the
efficient frontier curve is obtained.
3/11/2023 Annual Review 5
Data Interpretations
The efficient
frontier curve is
obtained in respect
to the five stocks.
3/11/2023 Annual Review 6
THANK
YOU!!

Efficient Frontier - Group 2.pptx

  • 1.
    EFFICIENT FRONTIER Portfolio Management Presenters: Group: 2 NameRegistration Number Vishakha Gupta 21PGDM096 Aditya Mondal 21PGDM102 Arka Guha 21PGDM115 Dipayan Ghosh 21PGDM124 Karishma Agarwal 21PGDM134 Moquarim Akhter 21PGDM141 Sonali Bhandari 21PGDM178
  • 2.
    3/11/2023 Annual Review2 Explanation of The Dataset We have selected the following stocks in our portfolio: 1. Infosys 2. ICICI Bank 3. Ashok Leyland 4. Adani SEZ 5. Canara Bank To calculate the efficient Frontier of the portfolio we used the 10 years of historical data on the returns of these stocks. The historical data for the years 2011 to 2021 was collected from the NSE website.
  • 3.
    3/11/2023 Annual Review3 An efficient frontier is a set of investment portfolios that are expected to provide the highest returns at a given level of risk. A portfolio is said to be efficient if there is no other portfolio that offers higher returns for a lower or equal amount of risk. Where portfolios are located on the efficient frontier depends on the investor’s degree of risk tolerance. Efficient Frontier 5% 7% 9% 11% 13% 15% 30% 40% 50% 60% 70% 80% Mean return Standard deviation Portfolios x, y and the Four Stocks Stock The efficient frontier is a curved line. It is because every increase in risk results in a relatively smaller amount of returns. In other words, there is a diminishing marginal return to risk, and it results in a curvature.
  • 4.
    3/11/2023 Annual Review4 Steps in Excel  First the Historical Returns of the five stocks are taken from the NSE website and their mean, standard deviation & variance are calculated.  Following that the excess return matrix is created in respect to the mean returns of the stocks.  Next we have created the variance covariance matrix by multiplying the excess return matrix with its transpose.  Following to that weights are assigned for the five stocks separately for Portfolio X & Y  The mean, Variance, Co-variance and the correlation of the two portfolios are calculated.  The return combinations are calculated for the portfolio with the mean return and the standard deviation.  Finally the portfolio is calculated in respect to different weights and the efficient frontier curve is obtained.
  • 5.
    3/11/2023 Annual Review5 Data Interpretations The efficient frontier curve is obtained in respect to the five stocks.
  • 6.