Download to read offline


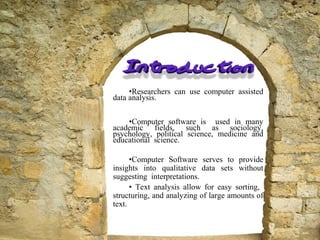

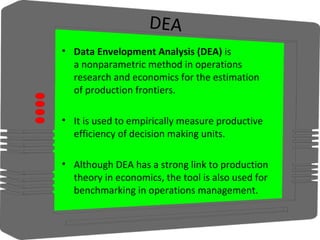
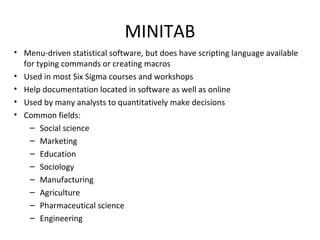
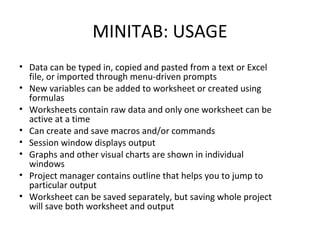
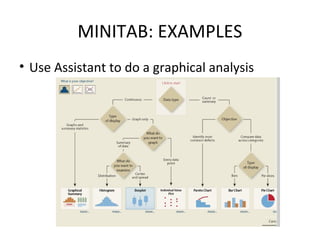
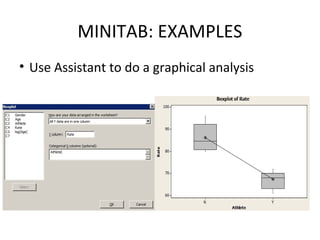
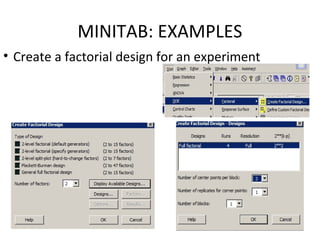
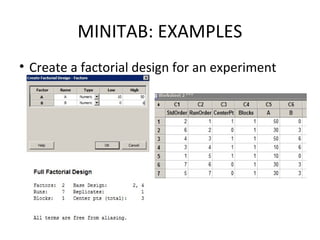


This document discusses various computer software packages that are used for data analysis. It describes how researchers can use computer-assisted data analysis and mentions fields that commonly use these tools like sociology, psychology, and medicine. Examples of specific software packages are given like SPSS, Excel, Minitab, Stata, and Origin which can assist with tasks like data management, statistical analysis, data visualization, and modeling. Details are provided on the uses, features, and examples of how to operate some of these programs.