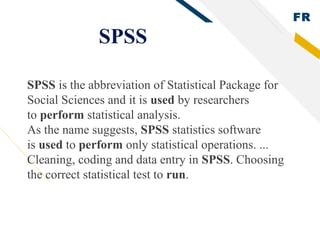
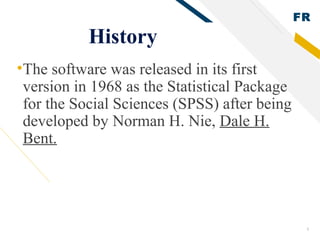
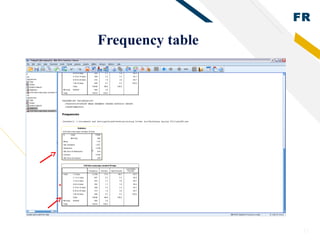
SPSS
By Madiha Khadim
1
FR
SPSS
SPSS is the abbreviation of Statistical Package for
Social Sciences and it is used by researchers
to perform statistical analysis.
As the name suggests, SPSS statistics software
is used to perform only statistical operations. ...
Cleaning, coding and data entry in SPSS. Choosing
the correct statistical test to run.
FR
3
History
•The software was released in its first
version in 1968 as the Statistical Package
for the Social Sciences (SPSS) after being
developed by Norman H. Nie, Dale H.
Bent.
FR
4
Continue….
•SPSS Statistics is a software package used
for interactive, or statistical analysis. Long
produced by SPSS, it was acquired by IBM in
2009. The current versions (2018) are
named IBM SPSS Statistics.
•The software name originally stood
for Statistical Package for the Social
Sciences(SPSS), reflecting the original market,
although the software is now popular in other
fields as well, including the health sciences and
marketing.
FR
5
Use of SPSS in research
•SPSS, which stands for statistical package
for the social sciences, is an application
that can aid in quantitative Data handling.
Before SPSS, researchers had to run
statistical tests on data sets by hand.
However, SPSS automates this process.
•Data management
•Data analysis
FR
6
Continue….
•SPSS is short for Statistical Package for the
Social Sciences, and it's used by various kinds
of researchers for complex statistical data
analysis. ... Most top research agencies use
SPSS to analyze survey data and mine text data
so that they can get the most out of their
research projects.
FR
7
Statistical Analysis
SPSS is among the most widely used programs for
statistical analysis in social science.
Statistics included in the base software:
Descriptive statistics:
Cross tabulation,
Frequencies,
Descriptive,
Explore,
Descriptive Ratio Statistics
FR
8
Test
•Bivariate statistics: Means, t-
test, ANOVA, Correlation
(bivariate, partial, distances),
•Parametric tests Prediction for numerical
outcomes: Linear regression, Prediction
for identifying groups
•Factor analysis
FR
9
SPSS Interface
•Data view
•The place to enter data
•Columns: variables
•Rows: records
•Variable view
•The place to enter variables
•List of all variables
•Characteristics of all variables
FR
10
Enter data in SPSS 22. Version
Columns:
variables
Rows: cases
Under Data
View
FR
11
Before the data entry
•You need a code book/scoring guide
•You give ID number for each case (NOT real
identification numbers of your subjects) if you use
paper survey.
•You also can use Excel to do data entry.
FR
12
Example of a code book
•How You old are:
•1 (12 Years)
•2 (13 Years)
•3 (14 Years)
•4 (15 Years)
•5 (16 Years)
•6 (17 Years)
•7 (18 Years)
A Code book is about how you code your
variables. What are in code book?
1.Variable names
2.Values for each response option
3.How to recode variables
FR
13
Enter variables
1. Click this
Window
1. Click Variable View
2. Type variable name under
Name column (e.g. Q01).
3. Type: Numeric, string, etc.
4. Label: description of variables.
2. Type
variable name
3. Type:
numeric or
string
4. Description
of variable
FR
14
FR
15
Enter variables
Based on your code book!
FR
16
Variables
FR
17
Enter cases
Under Data
View
1. Two variables in the data set.
2. They are: Code and Q01.
3. Q01 is about participants’ ages: 1 =
12 years or younger, 2 = 13 years, 3
= 14 years…
FR
18
Continue
Save this file
as SPSS data
FR
19
Clean data after import data files
•Key in values and labels for each variable
•Run frequency for each variable
•Check outputs to see if you have variables with wrong
values.
•Check missing values and physical surveys if you use
paper surveys, and make sure they are real missing.
•Sometimes, you need to recode string variables into
numeric variables
FR
20
Continue
Wrong
entries
FR
21
Missing Value
• Defines missing values
• The values are excluded from some analysis
• Options:
• Up to 3 discrete missing values
• A range of missing values plus one discrete missing value
• s
FR
22
Columns and Align
•Columns sets the amount of space reserved to display
the contents of the variable in Data View; generally
the default value is adequate
•Align sets whether the contents of the variable appear
on the left, centre or right of the cell in Data View
•Numeric variables are right-hand justified by default
and string variables left-hand justified by default; the
defaults are generally adequate
FR
23
Measure
• Levels of measurement:
• Nominal
• Ordinal
• Interval
• Ratio
• In SPSS, interval and ratio are designated together as Scale
• The default for string variables is Nominal
• The default for numeric variables is Scale
FR
24
Save
•The file must always be saved in order to save the
work that has been done to date:
•File/Save
•Move to the target directory
•Enter a file name
•Save
FR
25
Variable transformation
• Recode variables
1. Select Transform
Recode into Different
Variables
2. Select variable that you want
to transform (e.g. Q20): we
want
1= Yes and 0 = No
3. Click Arrow button to put
your variable into the right
window
4. Under Output Variable: type
name for new variable and
label, then click Change
FR
26
Variable Transformation
Compute variable
Example 1. Create a new variable: drug use (During the past
30 days, any use of cigarettes, alcohol, and marijuana is
defined as use, else as non-use). There are two categories for
the new variable (use vs. non-use). Coding: 1= Use and 0 =
Non-use
1. Use Q30, Q41, and Q47 from survey
2. Non-users means those who answered 0 days/times to all
three questions.
3. Go to Transform Compute Variable
FR
27
Continue
4. Type “drug use” under
Numeric
Use ”1”
5. Type “0” under Numeric
Expression. 0 means
Non-use
6. Click If button.
FR
28
Continue
7. With help of that
Arrow button, type
Q30= 1 & Q41 = 1 & Q47= 1
then click Continue
8. Do the same thing for
Use, but the numeric
expression is different:
Q30> 1 | Q41> 1 | Q47>1
AND
OR
FR
29
Continue
9. Click OK
10. After click OK,
a small window asks
if you want to
change existing
variable because
drug use was already
created when you
first define non-use.
11. Click ok.
FR
30
Continue
• Compute variables
• Example 2: Convert string variable into numeric variable
1. Enter 1 at Numeric
Expression.
2. Click If button and type
1= ‘Female’
3. Then click Ok.
4. Enter 2 at Numeric
Expression.
5. Click If button and type
2 = ‘Male’
6. Then click Ok
FR
31
Sort and select cases
You will see a new variable: filter_ (Variable view)
FR
32
Continue
FR
33
Frequency table
FR
34
Graphs
1. Skewness: a measure of the
asymmetry of a distribution.
The normal distribution is
symmetric and has a skewness
value of zero.
Positive skewness: a long right tail.
Negative skewness: a long left tail.
Departure from symmetry : a
skewness value more than twice
its standard error.
2. Kurtosis: A measure of the extent
to which observations cluster around
a central point. For a normal
distribution, the value of the kurtosis
statistic is zero. Leptokurtic data
values are more peaked, whereas
platykurtic data values are flatter and
more dispersed along the X axis.
Normal
Curve
FR
35
Normal Distributions
FR
36
FR
37
SPSS SPSS

Spss beginners

  • 1.
  • 2.
    FR SPSS SPSS is theabbreviation of Statistical Package for Social Sciences and it is used by researchers to perform statistical analysis. As the name suggests, SPSS statistics software is used to perform only statistical operations. ... Cleaning, coding and data entry in SPSS. Choosing the correct statistical test to run.
  • 3.
    FR 3 History •The software wasreleased in its first version in 1968 as the Statistical Package for the Social Sciences (SPSS) after being developed by Norman H. Nie, Dale H. Bent.
  • 4.
    FR 4 Continue…. •SPSS Statistics isa software package used for interactive, or statistical analysis. Long produced by SPSS, it was acquired by IBM in 2009. The current versions (2018) are named IBM SPSS Statistics. •The software name originally stood for Statistical Package for the Social Sciences(SPSS), reflecting the original market, although the software is now popular in other fields as well, including the health sciences and marketing.
  • 5.
    FR 5 Use of SPSSin research •SPSS, which stands for statistical package for the social sciences, is an application that can aid in quantitative Data handling. Before SPSS, researchers had to run statistical tests on data sets by hand. However, SPSS automates this process. •Data management •Data analysis
  • 6.
    FR 6 Continue…. •SPSS is shortfor Statistical Package for the Social Sciences, and it's used by various kinds of researchers for complex statistical data analysis. ... Most top research agencies use SPSS to analyze survey data and mine text data so that they can get the most out of their research projects.
  • 7.
    FR 7 Statistical Analysis SPSS isamong the most widely used programs for statistical analysis in social science. Statistics included in the base software: Descriptive statistics: Cross tabulation, Frequencies, Descriptive, Explore, Descriptive Ratio Statistics
  • 8.
    FR 8 Test •Bivariate statistics: Means,t- test, ANOVA, Correlation (bivariate, partial, distances), •Parametric tests Prediction for numerical outcomes: Linear regression, Prediction for identifying groups •Factor analysis
  • 9.
    FR 9 SPSS Interface •Data view •Theplace to enter data •Columns: variables •Rows: records •Variable view •The place to enter variables •List of all variables •Characteristics of all variables
  • 10.
    FR 10 Enter data inSPSS 22. Version Columns: variables Rows: cases Under Data View
  • 11.
    FR 11 Before the dataentry •You need a code book/scoring guide •You give ID number for each case (NOT real identification numbers of your subjects) if you use paper survey. •You also can use Excel to do data entry.
  • 12.
    FR 12 Example of acode book •How You old are: •1 (12 Years) •2 (13 Years) •3 (14 Years) •4 (15 Years) •5 (16 Years) •6 (17 Years) •7 (18 Years) A Code book is about how you code your variables. What are in code book? 1.Variable names 2.Values for each response option 3.How to recode variables
  • 13.
    FR 13 Enter variables 1. Clickthis Window 1. Click Variable View 2. Type variable name under Name column (e.g. Q01). 3. Type: Numeric, string, etc. 4. Label: description of variables. 2. Type variable name 3. Type: numeric or string 4. Description of variable
  • 14.
  • 15.
  • 16.
  • 17.
    FR 17 Enter cases Under Data View 1.Two variables in the data set. 2. They are: Code and Q01. 3. Q01 is about participants’ ages: 1 = 12 years or younger, 2 = 13 years, 3 = 14 years…
  • 18.
  • 19.
    FR 19 Clean data afterimport data files •Key in values and labels for each variable •Run frequency for each variable •Check outputs to see if you have variables with wrong values. •Check missing values and physical surveys if you use paper surveys, and make sure they are real missing. •Sometimes, you need to recode string variables into numeric variables
  • 20.
  • 21.
    FR 21 Missing Value • Definesmissing values • The values are excluded from some analysis • Options: • Up to 3 discrete missing values • A range of missing values plus one discrete missing value • s
  • 22.
    FR 22 Columns and Align •Columnssets the amount of space reserved to display the contents of the variable in Data View; generally the default value is adequate •Align sets whether the contents of the variable appear on the left, centre or right of the cell in Data View •Numeric variables are right-hand justified by default and string variables left-hand justified by default; the defaults are generally adequate
  • 23.
    FR 23 Measure • Levels ofmeasurement: • Nominal • Ordinal • Interval • Ratio • In SPSS, interval and ratio are designated together as Scale • The default for string variables is Nominal • The default for numeric variables is Scale
  • 24.
    FR 24 Save •The file mustalways be saved in order to save the work that has been done to date: •File/Save •Move to the target directory •Enter a file name •Save
  • 25.
    FR 25 Variable transformation • Recodevariables 1. Select Transform Recode into Different Variables 2. Select variable that you want to transform (e.g. Q20): we want 1= Yes and 0 = No 3. Click Arrow button to put your variable into the right window 4. Under Output Variable: type name for new variable and label, then click Change
  • 26.
    FR 26 Variable Transformation Compute variable Example1. Create a new variable: drug use (During the past 30 days, any use of cigarettes, alcohol, and marijuana is defined as use, else as non-use). There are two categories for the new variable (use vs. non-use). Coding: 1= Use and 0 = Non-use 1. Use Q30, Q41, and Q47 from survey 2. Non-users means those who answered 0 days/times to all three questions. 3. Go to Transform Compute Variable
  • 27.
    FR 27 Continue 4. Type “druguse” under Numeric Use ”1” 5. Type “0” under Numeric Expression. 0 means Non-use 6. Click If button.
  • 28.
    FR 28 Continue 7. With helpof that Arrow button, type Q30= 1 & Q41 = 1 & Q47= 1 then click Continue 8. Do the same thing for Use, but the numeric expression is different: Q30> 1 | Q41> 1 | Q47>1 AND OR
  • 29.
    FR 29 Continue 9. Click OK 10.After click OK, a small window asks if you want to change existing variable because drug use was already created when you first define non-use. 11. Click ok.
  • 30.
    FR 30 Continue • Compute variables •Example 2: Convert string variable into numeric variable 1. Enter 1 at Numeric Expression. 2. Click If button and type 1= ‘Female’ 3. Then click Ok. 4. Enter 2 at Numeric Expression. 5. Click If button and type 2 = ‘Male’ 6. Then click Ok
  • 31.
    FR 31 Sort and selectcases You will see a new variable: filter_ (Variable view)
  • 32.
  • 33.
  • 34.
    FR 34 Graphs 1. Skewness: ameasure of the asymmetry of a distribution. The normal distribution is symmetric and has a skewness value of zero. Positive skewness: a long right tail. Negative skewness: a long left tail. Departure from symmetry : a skewness value more than twice its standard error. 2. Kurtosis: A measure of the extent to which observations cluster around a central point. For a normal distribution, the value of the kurtosis statistic is zero. Leptokurtic data values are more peaked, whereas platykurtic data values are flatter and more dispersed along the X axis. Normal Curve
  • 35.
  • 36.
  • 37.