Downloaded 102 times

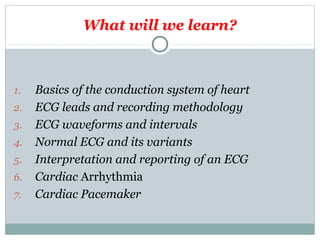
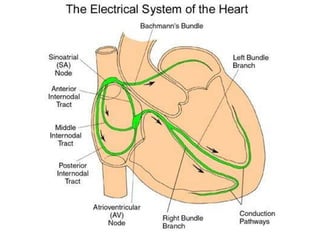
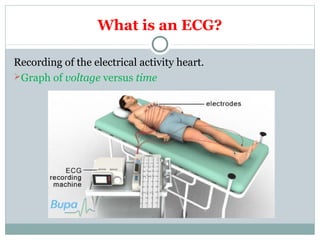
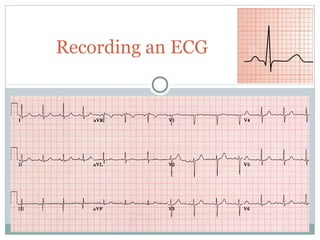
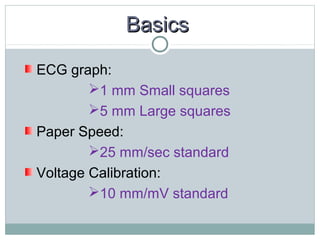
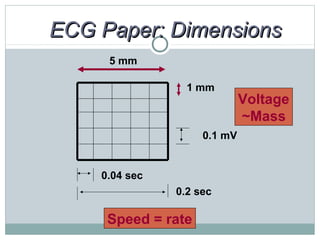
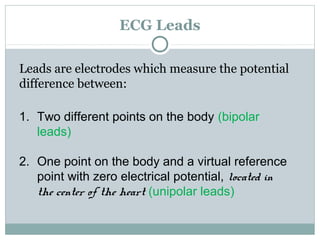
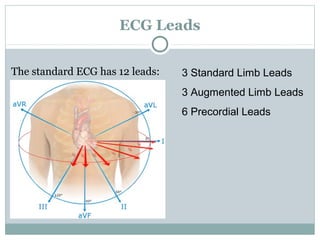


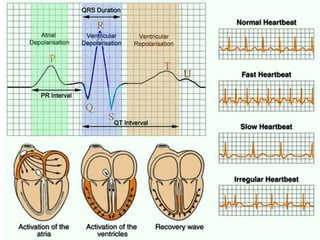
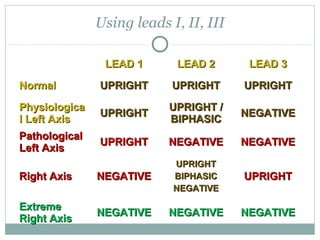
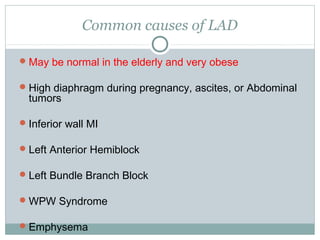
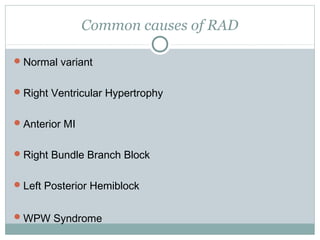
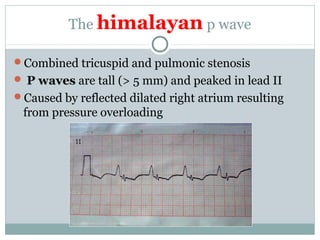

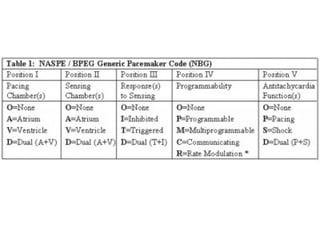
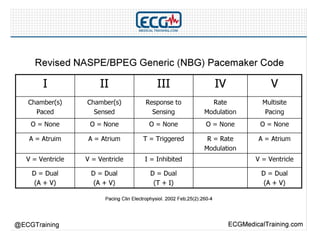


This document provides an overview of electrocardiography (ECG), including basics of the cardiac conduction system, ECG leads and recording methodology, normal ECG waveforms and intervals, cardiac arrhythmias, and pacemakers. Key topics covered include the standard 12-lead ECG, techniques for interpreting rate, rhythm, intervals, and axis, common normal variants and abnormalities, types of arrhythmias including sinus, atrial, and ventricular rhythms, and basics of cardiac pacemaker function. The document serves as an educational guide for understanding ECGs and their clinical applications.


![PERI-PROSTHETIC FRACTURE NAIL-PLATE CONSTRUCT [NPC].pptx](https://cdn.slidesharecdn.com/ss_thumbnails/drarunkumardrmohamedashrafperiprostheticfrasturenail-plateconstructnpc-260209164459-7e9d15a1-thumbnail.jpg?width=640&height=640&fit=bounds)


