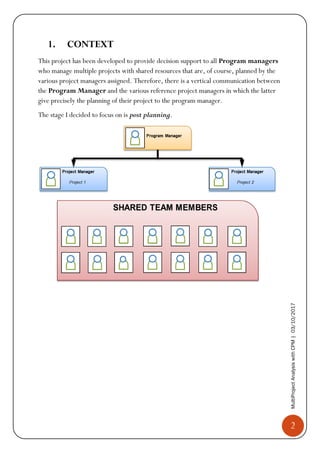
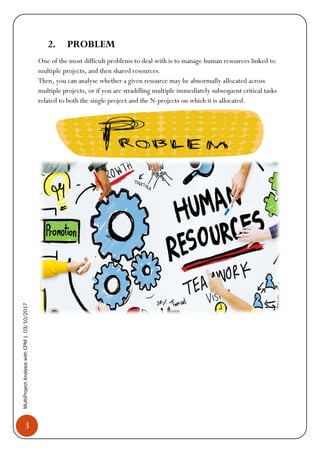
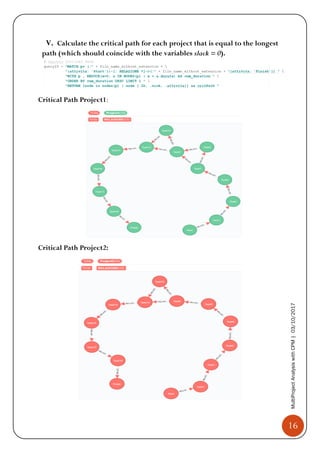
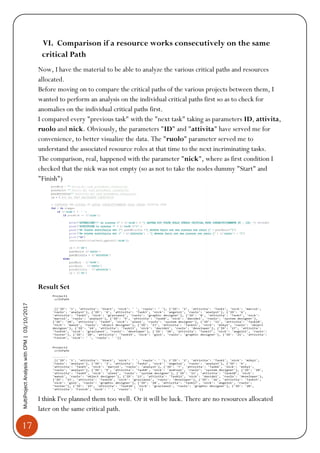
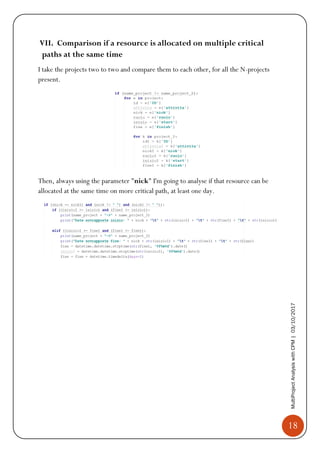
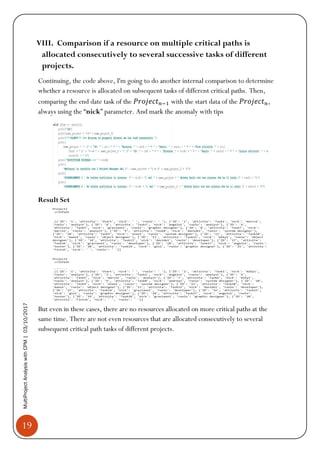
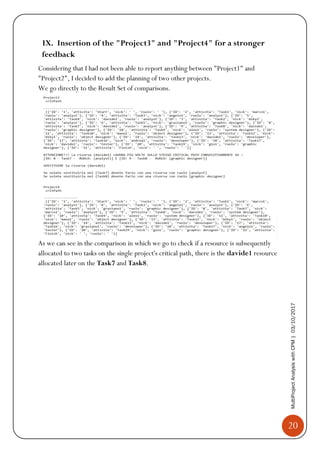
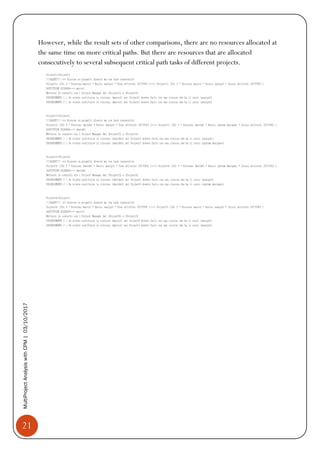
BUSINESS INNOVATION AND INFORMATICS
3 ottobre 2017
Author: Michele Palumbo
MultiProject Analysis with CPM
Course of IT Project Management
1
MultiProjectAnalysiswithCPM|03/10/2017
MultiProject Analysis with CPM
Course of IT Project Management
INDEX
1. CONTEXT................................................................................................ 2
2. PROBLEM ............................................................................................... 3
3. SOLUTION......................................................................................................4
3.1 CRITICAL PATH METHOD (CPM) ........................................................ 4
3.2 TOOLS USED FOR THE PROGRAM.......................................................... 7
3.3 THE STEP OF THE SOLUTION ................................................................ 9
I. Initial Situation............................................................................... 9
II. Load the .csv files on Neo4j and create the graphs ...................................11
III. I connect resources to each project ........................................................12
IV. Calculation ES, EF, LS, LF, Slack and add them to the graphs. ...................14
V. Calculate the critical path for each project .............................................16
VI. Comparison if a resource works consecutively on the same critical Path............ 17
VII. Compare if a resource is allocated on multiple critical paths at the same time .. 18
VIII. Comparison if a resource on multiple critical paths is allocated consecutively to
several successive tasks of different projects..............................................19
IX. Insertion of the "Project3" and "Project4" for a stronger feedback ................20
2
MultiProjectAnalysiswithCPM|03/10/2017
1. CONTEXT
This project has been developed to provide decision support to all Program managers
who manage multiple projects with shared resources that are, of course, planned by the
various project managers assigned. Therefore, there is a vertical communication between
the Program Manager and the various reference project managers in which the latter
give precisely the planning of their project to the program manager.
The stage I decided to focus on is post planning.
3
MultiProjectAnalysiswithCPM|03/10/2017
2. PROBLEM
One of the most difficult problems to deal with is to manage human resources linked to
multiple projects, and then shared resources.
Then, you can analyse whether a given resource may be abnormally allocated across
multiple projects, or if you are straddling multiple immediately subsequent critical tasks
related to both the single project and the N-projects on which it is allocated.
4
MultiProjectAnalysiswithCPM|03/10/2017
3. SOLUTION
To try to solve these problems, I decided to develop a software by following the approach
of data analysis through the Critical Path Method (CPM)
3.1. Critical Path Method (CPM)
It is a technique of analysis of the scheduling lattice that foresees the calculation of the
minimum and maximum start and end dates for each scheduled activity. These
calculations are purely theoretical because they do not take into account any resource
limits. Only at the end of the process will the resources be taken into account, and the
network will, if necessary, be rescheduled.
The Critical Path Method is a subsequent simplified application of the PERT.
In the CPM the determination of the durations is deterministic (more precise), then
disappears the probability function that there is in the PERT (that happens with a 3-factor
estimate: A = optimistic duration, M = Most likely duration, B = pessimistic duration,
and the average is calculated with this formula 
𝐴+4𝑀+𝐵
6
).
The PERT is indicated in case of projects where the times can be very variable, while the
CPM is more consistent in the situation of greater accuracy of dependence between
resources and times.
The critical path definition is: "The sequence of scheduled tasks that determines the
minimum duration of the project. It is usually the longest path of the project. "
Therefore, the critical path is the longest chain of activities (or chains, if they are more
than one) that have a total float equal to zero and that determine the minimum duration
of the whole project.
The Total Float (also known as Total Slack) can be defined as the amount of time ( I
referred to working days) that can slip the start date of an activity without affecting the end
date of the entire project. We will see, later, how it is calculated.
The steps to put into practice the CPM are:
1) To build the reticle, you need to start from the WBS where all the activities
foreseen by the project have been listed and their durations have been estimated.
 I used how to estimate the deterministic one, required by CPM
2) After you identify the project tasks and estimate the durations, you must define
the logical constraints, which are the sequential dependencies between the tasks.
 I used the logical constraint FS – Finish to Start
5
MultiProjectAnalysiswithCPM|03/10/2017
3) They represent the activities, identified by the WBS, on a graph oriented and
acyclic. The possible modes of representation are:
• AON (Activity On Node), where the activities are represented by the graph
nodes. The first node is always the beginning of the project; The last one is
always the end of the project.
• AOA (Activity On Arrow) where the activities are represented by the arcs that
connect two node of the graph.
 I used the AON network where I have only one initial node and one final
node. For to guarantee the uniqueness of the source and the well of the
network I decided to use a "Start" source node without predecessors and a
"Finish" well node without successors.
4) At this point, to calculate the "slack" (which will the critical activities and
activities that can slip) you need to determine for each task, 4 times, in this way:
• Earliest start time (ES)
Is equal to the earliest finish time (EF) of the previous activity.
N.B. for activities with more than one predecessor, it is the max time among all
the preceding activities.
𝐸𝑆𝑗 = max(𝐸𝐹𝑖)
• Earliest finish time (EF)
Is equal to the earliest start time (𝐸𝑆𝑗) + the estimated time of duration ( 𝑑𝑗)
𝐸𝐹𝑗 = 𝐸𝐹𝑖 + 𝑑𝑗
• Latest start time (LS)
Is equal to the latest finish time (𝐿𝐹𝑗) of activity - the estimated time of
duration (𝑑𝑗)
𝐿𝑆𝑗 = 𝐿𝐹𝑗 − 𝑑𝑗
6
MultiProjectAnalysiswithCPM|03/10/2017
• Latest finish time (LF)
Is equal to the latest start time (𝐿𝑆𝑗) of the next activity.
N.B. for activities with more than one successor, is the minimum of latest start
times.
𝐿𝐹𝑖 = max(𝐿𝑆𝑗)
5) In summary, it is possible to say that the method consists of a repetitive calculation
performed before "forward", to obtain the minimum start and end dates (ES and
EF), and then "backward" in such a way as to obtain the maximum dates (LS and
LF). Depending on the flexibility of the activities, the critical path will be
identified. So, at this point, we can say that the total time required to complete
the project is the first moment of start of the node "Finish"
𝑃𝑟𝑜𝑗𝑒𝑐𝑡𝐶𝑜𝑚𝑝𝑙𝑒𝑡𝑖𝑜𝑛𝑇𝑖𝑚𝑒 = 𝐸𝑆 𝐹𝑖𝑛𝑖𝑠ℎ
This is also the longest path of the graph (from start to finish) in terms of
cumulative duration, where this cumulative duration is the completion time of the
project. This longer path is the critical path.
The critical path, as we have already said, consists of those activities in which an
increase of any of their durations would increase the overall time of completion of
the project. These activities have a time 𝑠𝑙𝑎𝑐𝑘 = 0 , so there will be no way to
increase their durations without increasing the overall length of the project. An
activity j, instead, it is not on critical path if it has a 𝑝𝑜𝑠𝑖𝑡𝑖𝑣𝑒 𝑠𝑙𝑎𝑐𝑘, which is the
difference between 𝐿𝑆𝑗 and 𝐸𝑆𝑗 :
𝑠𝑙𝑎𝑐𝑘𝑗 = 𝐿𝑆𝑗 − 𝐸𝑆𝑗
The activities with 𝑝𝑜𝑠𝑖𝑡𝑖𝑣𝑒 𝑠𝑙𝑎𝑐𝑘 can be increased, obviously always on the basis
of the slack, without compromising the overall time of completion of the project.
To conclude, we can also say that:
• 𝐸𝑆𝑆𝑡𝑎𝑟𝑡 = 𝐸𝐹𝑆𝑡𝑎𝑟𝑡 = 𝐿𝑆𝑆𝑡𝑎𝑟𝑡 = 𝐿𝐹𝑆𝑡𝑎𝑟𝑡 = 0
• 𝐸𝑆 𝐹𝑖𝑛𝑖𝑠ℎ = 𝐸𝐹𝐹𝑖𝑛𝑖𝑠ℎ = 𝐿𝑆 𝐹𝑖𝑛𝑖𝑠ℎ = 𝐿𝐹𝐹𝑖𝑛𝑖𝑠ℎ = 𝑃𝑟𝑜𝑗𝐶𝑜𝑚𝑝𝑙𝑒𝑡𝑇𝑖𝑚𝑒
7
MultiProjectAnalysiswithCPM|03/10/2017
3.2. Tools used for the program
The tools used to develop the software are: Neo4j and PyCharm,
languages: Cypher and Python,
libraries: pandas and py2neo
• Neo4j
Neo4J is one of the most widely used graph databases in the Big Data field.
The foundational structure for the graph databases is the "node-relationship"; Storing and
navigating is done using nodes, their relationships and their properties.
The graphs represent one of the most efficient and natural ways of working with data:
they are extremely intuitive and show the interconnection of concepts and ideas.
NEO4J helps in the management of large data docks, for example with issues related to
big data and IoT.
Neo4J supports a declarative language called Cypher, specifically designed to
interrogate the graphs and their components.
The Cypher commands are vaguely based on SQL syntax and are designed for ad hoc
graph data queries.
8
MultiProjectAnalysiswithCPM|03/10/2017
• PyCharm
PyCharm is a IDE for Python.
"The intelligent Python IDE with unique code assistance and analysis, for productive
Python development on all levels"
• Library: pandas
Pandas is a software library written for the Python programming language for
manipulating and analyzing data.
 I used this library to read the .csv files
• Library: py2neo
Py2neo is a client library and comprehensive toolkit for working with Neo4j from
within Python applications and from the command line. The core library has no external
dependencies and has been carefully designed to be easy and intuitive to use.
9
MultiProjectAnalysiswithCPM|03/10/2017
3.3. The steps of the solution
The solution that will be proposed below is based on planning two projects with shared
resources. Obviously, the software is generic so you will be able to manage N-projects
with as many N-resources.
I. Initial Situation
Initially, I identified the activities of the two projects through WBS. I have, therefore,
planned the human resources distributed on the two projects in order to make them
compatible with each other. Next, I brought the three tables (two for projects and one
for the resources) in format (. csv) to be able to read them easily from pandas and upload
them to the database Neo4j.
 The constraint to make the schedule compatible with the system is to insert a "start"
node and a "Finish" node that correspond to the beginning of the project and at the end of
the project. And, of course, they must have the same structure.
Here are the project and resource datasets:
10
MultiProjectAnalysiswithCPM|03/10/2017
11
MultiProjectAnalysiswithCPM|03/10/2017
II. Load the .csv files on Neo4j and create the graphs
• Load the resources first, so that they can be connected later to the projects.
• Load and create a graph for each project. In order to make the system generic and,
therefore, a single graph that can go well for each project I made sure to take me from
the folder containing the files. csv all those files that begin with "Project".
 To use the system, you must save the files that relate to projects such as "Project *
* * * * *. csv"
The graph of the “Project1”
12
MultiProjectAnalysiswithCPM|03/10/2017
The graph of the “Project2”
III. I connect resources to each project
The graph of resources linked to the “Project1”
13
MultiProjectAnalysiswithCPM|03/10/2017
The graph of resources linked to the “Project2”
The graph of resources linked to both "Project1" and "Project2"
14
MultiProjectAnalysiswithCPM|03/10/2017
IV. Calculation ES, EF, LS, LF, Slack and add them to the graphs.
I perform the calculations I explained above (in section 3.1) to find the critical and
flexible activities of projects.
• Add and Set variables ES, EF, LS, LF = 0 to the “Start” node.
• Set variables EF and ES
• Update the variables ES, EF, LS, LF of the “Finish” node
I update the properties of the "Finish" node based on the information previously
calculated "forward" before calculating the variables LS and LF.
• Set the variables LS and LF
• Set the variable slack
15
MultiProjectAnalysiswithCPM|03/10/2017
• View ES, EF, LS, LF and Slack Times for each project.
Project1 table:
Project2 table:
16
MultiProjectAnalysiswithCPM|03/10/2017
V. Calculate the critical path for each project that is equal to the longest
path (which should coincide with the variables slack = 0).
Critical Path Project1:
Critical Path Project2:
17
MultiProjectAnalysiswithCPM|03/10/2017
VI. Comparison if a resource works consecutively on the same
critical Path
Now, I have the material to be able to analyze the various critical paths and resources
allocated.
Before moving on to compare the critical paths of the various projects between them, I
wanted to perform an analysis on the individual critical paths first so as to check for
anomalies on the individual critical paths first.
I compared every "previous task" with the "next task" taking as parameters ID, attivita,
ruolo and nick. Obviously, the parameters "ID" and "attivita" have served me for
convenience, to better visualize the data. The "ruolo" parameter served me to
understand the associated resource roles at that time to the next incriminating tasks.
The comparison, real, happened with the parameter "nick", where as first condition I
checked that the nick was not empty (so as not to take the nodes dummy "Start" and
"Finish")
Result Set
I think I've planned them too well. Or it will be luck. There are no resources allocated
later on the same critical path.
18
MultiProjectAnalysiswithCPM|03/10/2017
VII. Comparison if a resource is allocated on multiple critical
paths at the same time
I take the projects two to two and compare them to each other, for all the N-projects
present.
Then, always using the parameter "nick" I'm going to analyse if that resource can be
allocated at the same time on more critical path, at least one day.
19
MultiProjectAnalysiswithCPM|03/10/2017
VIII. Comparison if a resource on multiple critical paths is
allocated consecutively to several successive tasks of different
projects.
Continuing, the code above, I'm going to do another internal comparison to determine
whether a resource is allocated on subsequent tasks of different critical paths. Then,
comparing the end date task of the 𝑃𝑟𝑜𝑗𝑒𝑐𝑡 𝑛−1 with the start data of the 𝑃𝑟𝑜𝑗𝑒𝑐𝑡 𝑛,
always using the “nick” parameter. And mark the anomaly with tips
Result Set
But even in these cases, there are no resources allocated on more critical paths at the
same time. There are not even resources that are allocated consecutively to several
subsequent critical path tasks of different projects.
20
MultiProjectAnalysiswithCPM|03/10/2017
IX. Insertion of the "Project3" and "Project4" for a stronger
feedback
Considering that I had not been able to report anything between "Project1" and
"Project2", I decided to add the planning of two other projects.
We go directly to the Result Set of comparisons.
As we can see in the comparison in which we go to check if a resource is subsequently
allocated to two tasks on the single project's critical path, there is the davide1 resource
allocated later on the Task7 and Task8.
21
MultiProjectAnalysiswithCPM|03/10/2017
However, while the result sets of other comparisons, there are no resources allocated at
the same time on more critical paths. But there are resources that are allocated
consecutively to several subsequent critical path tasks of different projects.

[Document] MultiProject analysis with Critical Path Method

  • 1.
    BUSINESS INNOVATION ANDINFORMATICS 3 ottobre 2017 Author: Michele Palumbo MultiProject Analysis with CPM Course of IT Project Management
  • 2.
    1 MultiProjectAnalysiswithCPM|03/10/2017 MultiProject Analysis withCPM Course of IT Project Management INDEX 1. CONTEXT................................................................................................ 2 2. PROBLEM ............................................................................................... 3 3. SOLUTION......................................................................................................4 3.1 CRITICAL PATH METHOD (CPM) ........................................................ 4 3.2 TOOLS USED FOR THE PROGRAM.......................................................... 7 3.3 THE STEP OF THE SOLUTION ................................................................ 9 I. Initial Situation............................................................................... 9 II. Load the .csv files on Neo4j and create the graphs ...................................11 III. I connect resources to each project ........................................................12 IV. Calculation ES, EF, LS, LF, Slack and add them to the graphs. ...................14 V. Calculate the critical path for each project .............................................16 VI. Comparison if a resource works consecutively on the same critical Path............ 17 VII. Compare if a resource is allocated on multiple critical paths at the same time .. 18 VIII. Comparison if a resource on multiple critical paths is allocated consecutively to several successive tasks of different projects..............................................19 IX. Insertion of the "Project3" and "Project4" for a stronger feedback ................20
  • 3.
    2 MultiProjectAnalysiswithCPM|03/10/2017 1. CONTEXT This projecthas been developed to provide decision support to all Program managers who manage multiple projects with shared resources that are, of course, planned by the various project managers assigned. Therefore, there is a vertical communication between the Program Manager and the various reference project managers in which the latter give precisely the planning of their project to the program manager. The stage I decided to focus on is post planning.
  • 4.
    3 MultiProjectAnalysiswithCPM|03/10/2017 2. PROBLEM One ofthe most difficult problems to deal with is to manage human resources linked to multiple projects, and then shared resources. Then, you can analyse whether a given resource may be abnormally allocated across multiple projects, or if you are straddling multiple immediately subsequent critical tasks related to both the single project and the N-projects on which it is allocated.
  • 5.
    4 MultiProjectAnalysiswithCPM|03/10/2017 3. SOLUTION To tryto solve these problems, I decided to develop a software by following the approach of data analysis through the Critical Path Method (CPM) 3.1. Critical Path Method (CPM) It is a technique of analysis of the scheduling lattice that foresees the calculation of the minimum and maximum start and end dates for each scheduled activity. These calculations are purely theoretical because they do not take into account any resource limits. Only at the end of the process will the resources be taken into account, and the network will, if necessary, be rescheduled. The Critical Path Method is a subsequent simplified application of the PERT. In the CPM the determination of the durations is deterministic (more precise), then disappears the probability function that there is in the PERT (that happens with a 3-factor estimate: A = optimistic duration, M = Most likely duration, B = pessimistic duration, and the average is calculated with this formula  𝐴+4𝑀+𝐵 6 ). The PERT is indicated in case of projects where the times can be very variable, while the CPM is more consistent in the situation of greater accuracy of dependence between resources and times. The critical path definition is: "The sequence of scheduled tasks that determines the minimum duration of the project. It is usually the longest path of the project. " Therefore, the critical path is the longest chain of activities (or chains, if they are more than one) that have a total float equal to zero and that determine the minimum duration of the whole project. The Total Float (also known as Total Slack) can be defined as the amount of time ( I referred to working days) that can slip the start date of an activity without affecting the end date of the entire project. We will see, later, how it is calculated. The steps to put into practice the CPM are: 1) To build the reticle, you need to start from the WBS where all the activities foreseen by the project have been listed and their durations have been estimated.  I used how to estimate the deterministic one, required by CPM 2) After you identify the project tasks and estimate the durations, you must define the logical constraints, which are the sequential dependencies between the tasks.  I used the logical constraint FS – Finish to Start
  • 6.
    5 MultiProjectAnalysiswithCPM|03/10/2017 3) They representthe activities, identified by the WBS, on a graph oriented and acyclic. The possible modes of representation are: • AON (Activity On Node), where the activities are represented by the graph nodes. The first node is always the beginning of the project; The last one is always the end of the project. • AOA (Activity On Arrow) where the activities are represented by the arcs that connect two node of the graph.  I used the AON network where I have only one initial node and one final node. For to guarantee the uniqueness of the source and the well of the network I decided to use a "Start" source node without predecessors and a "Finish" well node without successors. 4) At this point, to calculate the "slack" (which will the critical activities and activities that can slip) you need to determine for each task, 4 times, in this way: • Earliest start time (ES) Is equal to the earliest finish time (EF) of the previous activity. N.B. for activities with more than one predecessor, it is the max time among all the preceding activities. 𝐸𝑆𝑗 = max(𝐸𝐹𝑖) • Earliest finish time (EF) Is equal to the earliest start time (𝐸𝑆𝑗) + the estimated time of duration ( 𝑑𝑗) 𝐸𝐹𝑗 = 𝐸𝐹𝑖 + 𝑑𝑗 • Latest start time (LS) Is equal to the latest finish time (𝐿𝐹𝑗) of activity - the estimated time of duration (𝑑𝑗) 𝐿𝑆𝑗 = 𝐿𝐹𝑗 − 𝑑𝑗
  • 7.
    6 MultiProjectAnalysiswithCPM|03/10/2017 • Latest finishtime (LF) Is equal to the latest start time (𝐿𝑆𝑗) of the next activity. N.B. for activities with more than one successor, is the minimum of latest start times. 𝐿𝐹𝑖 = max(𝐿𝑆𝑗) 5) In summary, it is possible to say that the method consists of a repetitive calculation performed before "forward", to obtain the minimum start and end dates (ES and EF), and then "backward" in such a way as to obtain the maximum dates (LS and LF). Depending on the flexibility of the activities, the critical path will be identified. So, at this point, we can say that the total time required to complete the project is the first moment of start of the node "Finish" 𝑃𝑟𝑜𝑗𝑒𝑐𝑡𝐶𝑜𝑚𝑝𝑙𝑒𝑡𝑖𝑜𝑛𝑇𝑖𝑚𝑒 = 𝐸𝑆 𝐹𝑖𝑛𝑖𝑠ℎ This is also the longest path of the graph (from start to finish) in terms of cumulative duration, where this cumulative duration is the completion time of the project. This longer path is the critical path. The critical path, as we have already said, consists of those activities in which an increase of any of their durations would increase the overall time of completion of the project. These activities have a time 𝑠𝑙𝑎𝑐𝑘 = 0 , so there will be no way to increase their durations without increasing the overall length of the project. An activity j, instead, it is not on critical path if it has a 𝑝𝑜𝑠𝑖𝑡𝑖𝑣𝑒 𝑠𝑙𝑎𝑐𝑘, which is the difference between 𝐿𝑆𝑗 and 𝐸𝑆𝑗 : 𝑠𝑙𝑎𝑐𝑘𝑗 = 𝐿𝑆𝑗 − 𝐸𝑆𝑗 The activities with 𝑝𝑜𝑠𝑖𝑡𝑖𝑣𝑒 𝑠𝑙𝑎𝑐𝑘 can be increased, obviously always on the basis of the slack, without compromising the overall time of completion of the project. To conclude, we can also say that: • 𝐸𝑆𝑆𝑡𝑎𝑟𝑡 = 𝐸𝐹𝑆𝑡𝑎𝑟𝑡 = 𝐿𝑆𝑆𝑡𝑎𝑟𝑡 = 𝐿𝐹𝑆𝑡𝑎𝑟𝑡 = 0 • 𝐸𝑆 𝐹𝑖𝑛𝑖𝑠ℎ = 𝐸𝐹𝐹𝑖𝑛𝑖𝑠ℎ = 𝐿𝑆 𝐹𝑖𝑛𝑖𝑠ℎ = 𝐿𝐹𝐹𝑖𝑛𝑖𝑠ℎ = 𝑃𝑟𝑜𝑗𝐶𝑜𝑚𝑝𝑙𝑒𝑡𝑇𝑖𝑚𝑒
  • 8.
    7 MultiProjectAnalysiswithCPM|03/10/2017 3.2. Tools usedfor the program The tools used to develop the software are: Neo4j and PyCharm, languages: Cypher and Python, libraries: pandas and py2neo • Neo4j Neo4J is one of the most widely used graph databases in the Big Data field. The foundational structure for the graph databases is the "node-relationship"; Storing and navigating is done using nodes, their relationships and their properties. The graphs represent one of the most efficient and natural ways of working with data: they are extremely intuitive and show the interconnection of concepts and ideas. NEO4J helps in the management of large data docks, for example with issues related to big data and IoT. Neo4J supports a declarative language called Cypher, specifically designed to interrogate the graphs and their components. The Cypher commands are vaguely based on SQL syntax and are designed for ad hoc graph data queries.
  • 9.
    8 MultiProjectAnalysiswithCPM|03/10/2017 • PyCharm PyCharm isa IDE for Python. "The intelligent Python IDE with unique code assistance and analysis, for productive Python development on all levels" • Library: pandas Pandas is a software library written for the Python programming language for manipulating and analyzing data.  I used this library to read the .csv files • Library: py2neo Py2neo is a client library and comprehensive toolkit for working with Neo4j from within Python applications and from the command line. The core library has no external dependencies and has been carefully designed to be easy and intuitive to use.
  • 10.
    9 MultiProjectAnalysiswithCPM|03/10/2017 3.3. The stepsof the solution The solution that will be proposed below is based on planning two projects with shared resources. Obviously, the software is generic so you will be able to manage N-projects with as many N-resources. I. Initial Situation Initially, I identified the activities of the two projects through WBS. I have, therefore, planned the human resources distributed on the two projects in order to make them compatible with each other. Next, I brought the three tables (two for projects and one for the resources) in format (. csv) to be able to read them easily from pandas and upload them to the database Neo4j.  The constraint to make the schedule compatible with the system is to insert a "start" node and a "Finish" node that correspond to the beginning of the project and at the end of the project. And, of course, they must have the same structure. Here are the project and resource datasets:
  • 11.
  • 12.
    11 MultiProjectAnalysiswithCPM|03/10/2017 II. Load the.csv files on Neo4j and create the graphs • Load the resources first, so that they can be connected later to the projects. • Load and create a graph for each project. In order to make the system generic and, therefore, a single graph that can go well for each project I made sure to take me from the folder containing the files. csv all those files that begin with "Project".  To use the system, you must save the files that relate to projects such as "Project * * * * * *. csv" The graph of the “Project1”
  • 13.
    12 MultiProjectAnalysiswithCPM|03/10/2017 The graph ofthe “Project2” III. I connect resources to each project The graph of resources linked to the “Project1”
  • 14.
    13 MultiProjectAnalysiswithCPM|03/10/2017 The graph ofresources linked to the “Project2” The graph of resources linked to both "Project1" and "Project2"
  • 15.
    14 MultiProjectAnalysiswithCPM|03/10/2017 IV. Calculation ES,EF, LS, LF, Slack and add them to the graphs. I perform the calculations I explained above (in section 3.1) to find the critical and flexible activities of projects. • Add and Set variables ES, EF, LS, LF = 0 to the “Start” node. • Set variables EF and ES • Update the variables ES, EF, LS, LF of the “Finish” node I update the properties of the "Finish" node based on the information previously calculated "forward" before calculating the variables LS and LF. • Set the variables LS and LF • Set the variable slack
  • 16.
    15 MultiProjectAnalysiswithCPM|03/10/2017 • View ES,EF, LS, LF and Slack Times for each project. Project1 table: Project2 table:
  • 17.
    16 MultiProjectAnalysiswithCPM|03/10/2017 V. Calculate thecritical path for each project that is equal to the longest path (which should coincide with the variables slack = 0). Critical Path Project1: Critical Path Project2:
  • 18.
    17 MultiProjectAnalysiswithCPM|03/10/2017 VI. Comparison ifa resource works consecutively on the same critical Path Now, I have the material to be able to analyze the various critical paths and resources allocated. Before moving on to compare the critical paths of the various projects between them, I wanted to perform an analysis on the individual critical paths first so as to check for anomalies on the individual critical paths first. I compared every "previous task" with the "next task" taking as parameters ID, attivita, ruolo and nick. Obviously, the parameters "ID" and "attivita" have served me for convenience, to better visualize the data. The "ruolo" parameter served me to understand the associated resource roles at that time to the next incriminating tasks. The comparison, real, happened with the parameter "nick", where as first condition I checked that the nick was not empty (so as not to take the nodes dummy "Start" and "Finish") Result Set I think I've planned them too well. Or it will be luck. There are no resources allocated later on the same critical path.
  • 19.
    18 MultiProjectAnalysiswithCPM|03/10/2017 VII. Comparison ifa resource is allocated on multiple critical paths at the same time I take the projects two to two and compare them to each other, for all the N-projects present. Then, always using the parameter "nick" I'm going to analyse if that resource can be allocated at the same time on more critical path, at least one day.
  • 20.
    19 MultiProjectAnalysiswithCPM|03/10/2017 VIII. Comparison ifa resource on multiple critical paths is allocated consecutively to several successive tasks of different projects. Continuing, the code above, I'm going to do another internal comparison to determine whether a resource is allocated on subsequent tasks of different critical paths. Then, comparing the end date task of the 𝑃𝑟𝑜𝑗𝑒𝑐𝑡 𝑛−1 with the start data of the 𝑃𝑟𝑜𝑗𝑒𝑐𝑡 𝑛, always using the “nick” parameter. And mark the anomaly with tips Result Set But even in these cases, there are no resources allocated on more critical paths at the same time. There are not even resources that are allocated consecutively to several subsequent critical path tasks of different projects.
  • 21.
    20 MultiProjectAnalysiswithCPM|03/10/2017 IX. Insertion ofthe "Project3" and "Project4" for a stronger feedback Considering that I had not been able to report anything between "Project1" and "Project2", I decided to add the planning of two other projects. We go directly to the Result Set of comparisons. As we can see in the comparison in which we go to check if a resource is subsequently allocated to two tasks on the single project's critical path, there is the davide1 resource allocated later on the Task7 and Task8.
  • 22.
    21 MultiProjectAnalysiswithCPM|03/10/2017 However, while theresult sets of other comparisons, there are no resources allocated at the same time on more critical paths. But there are resources that are allocated consecutively to several subsequent critical path tasks of different projects.