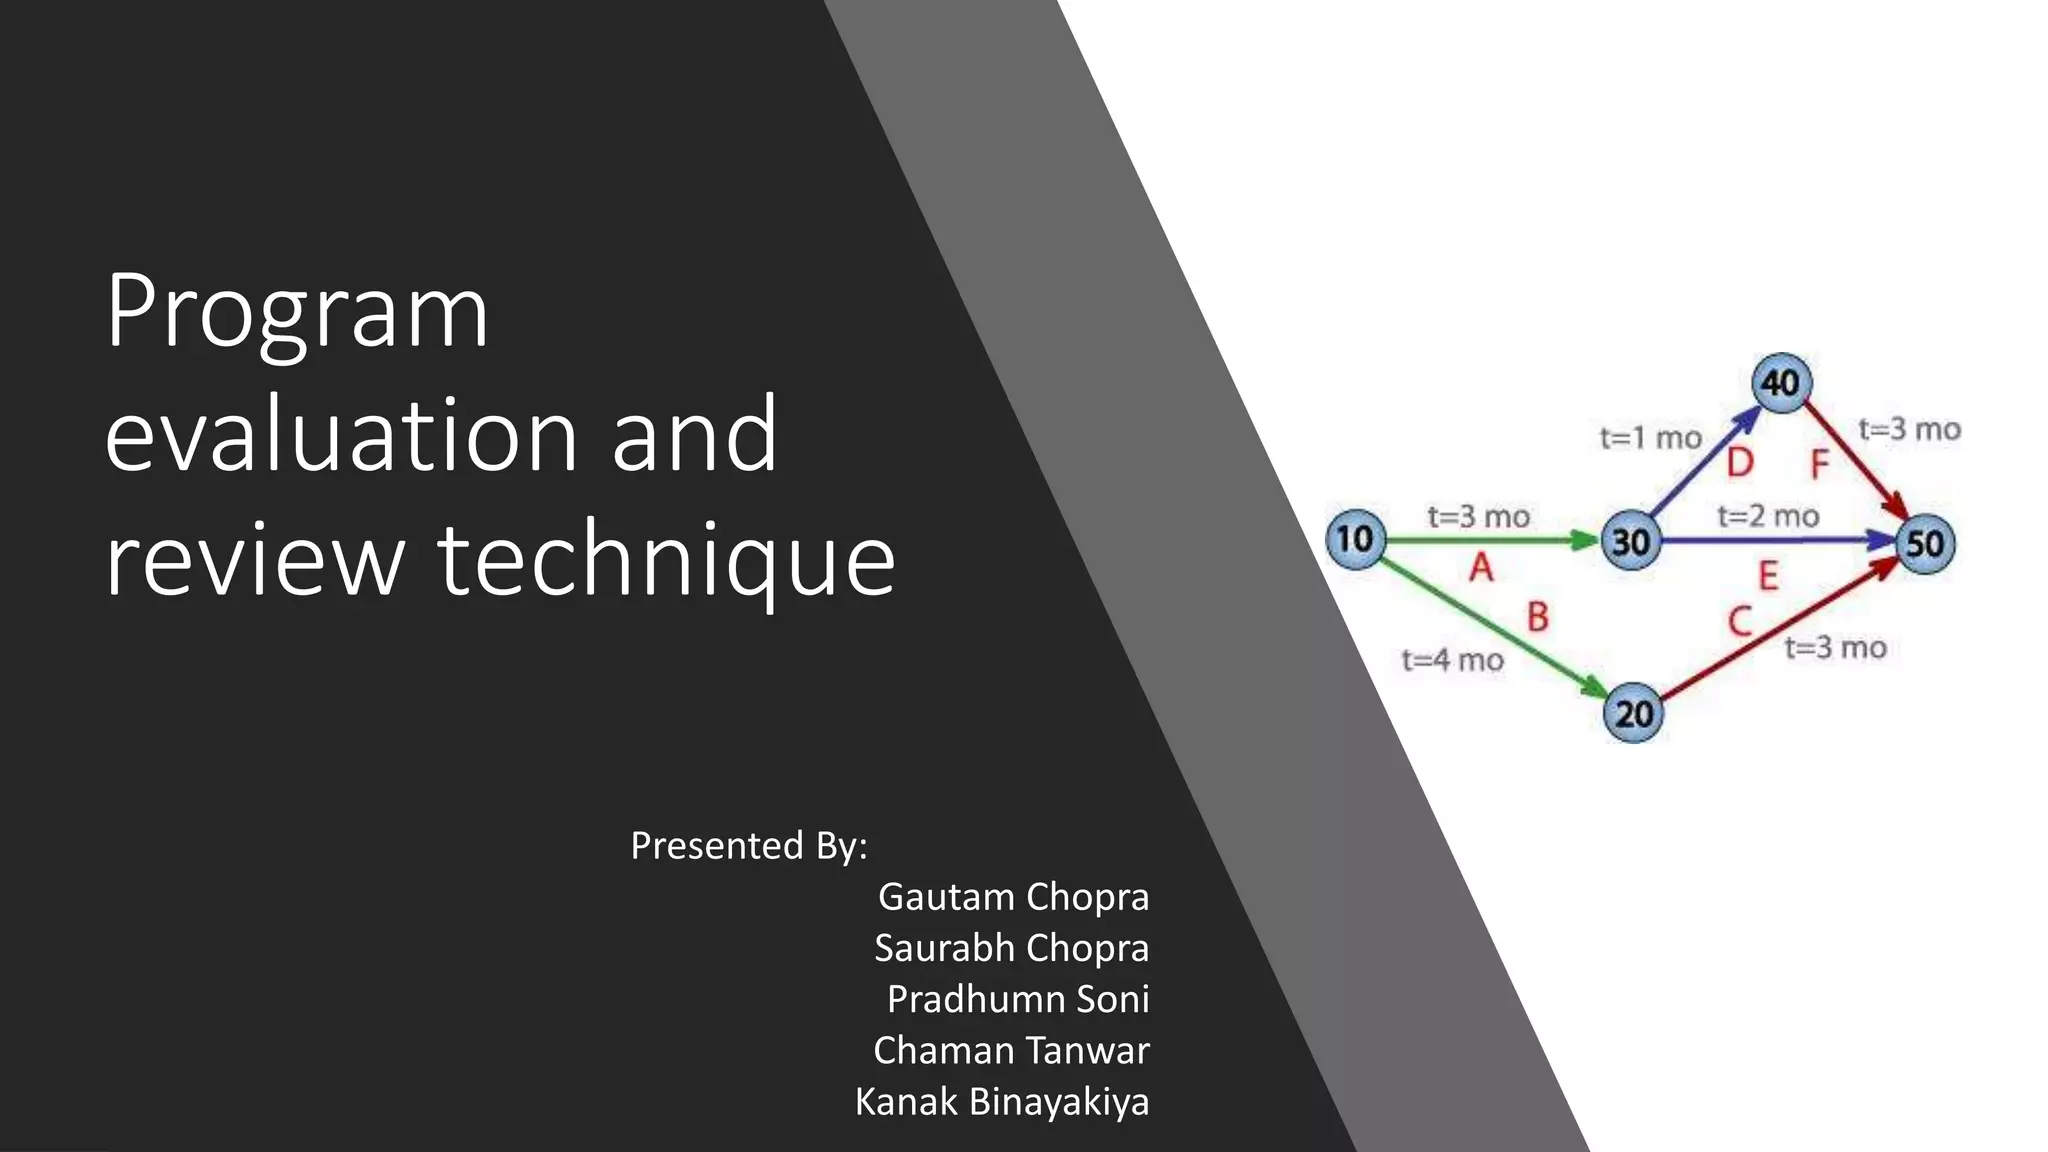
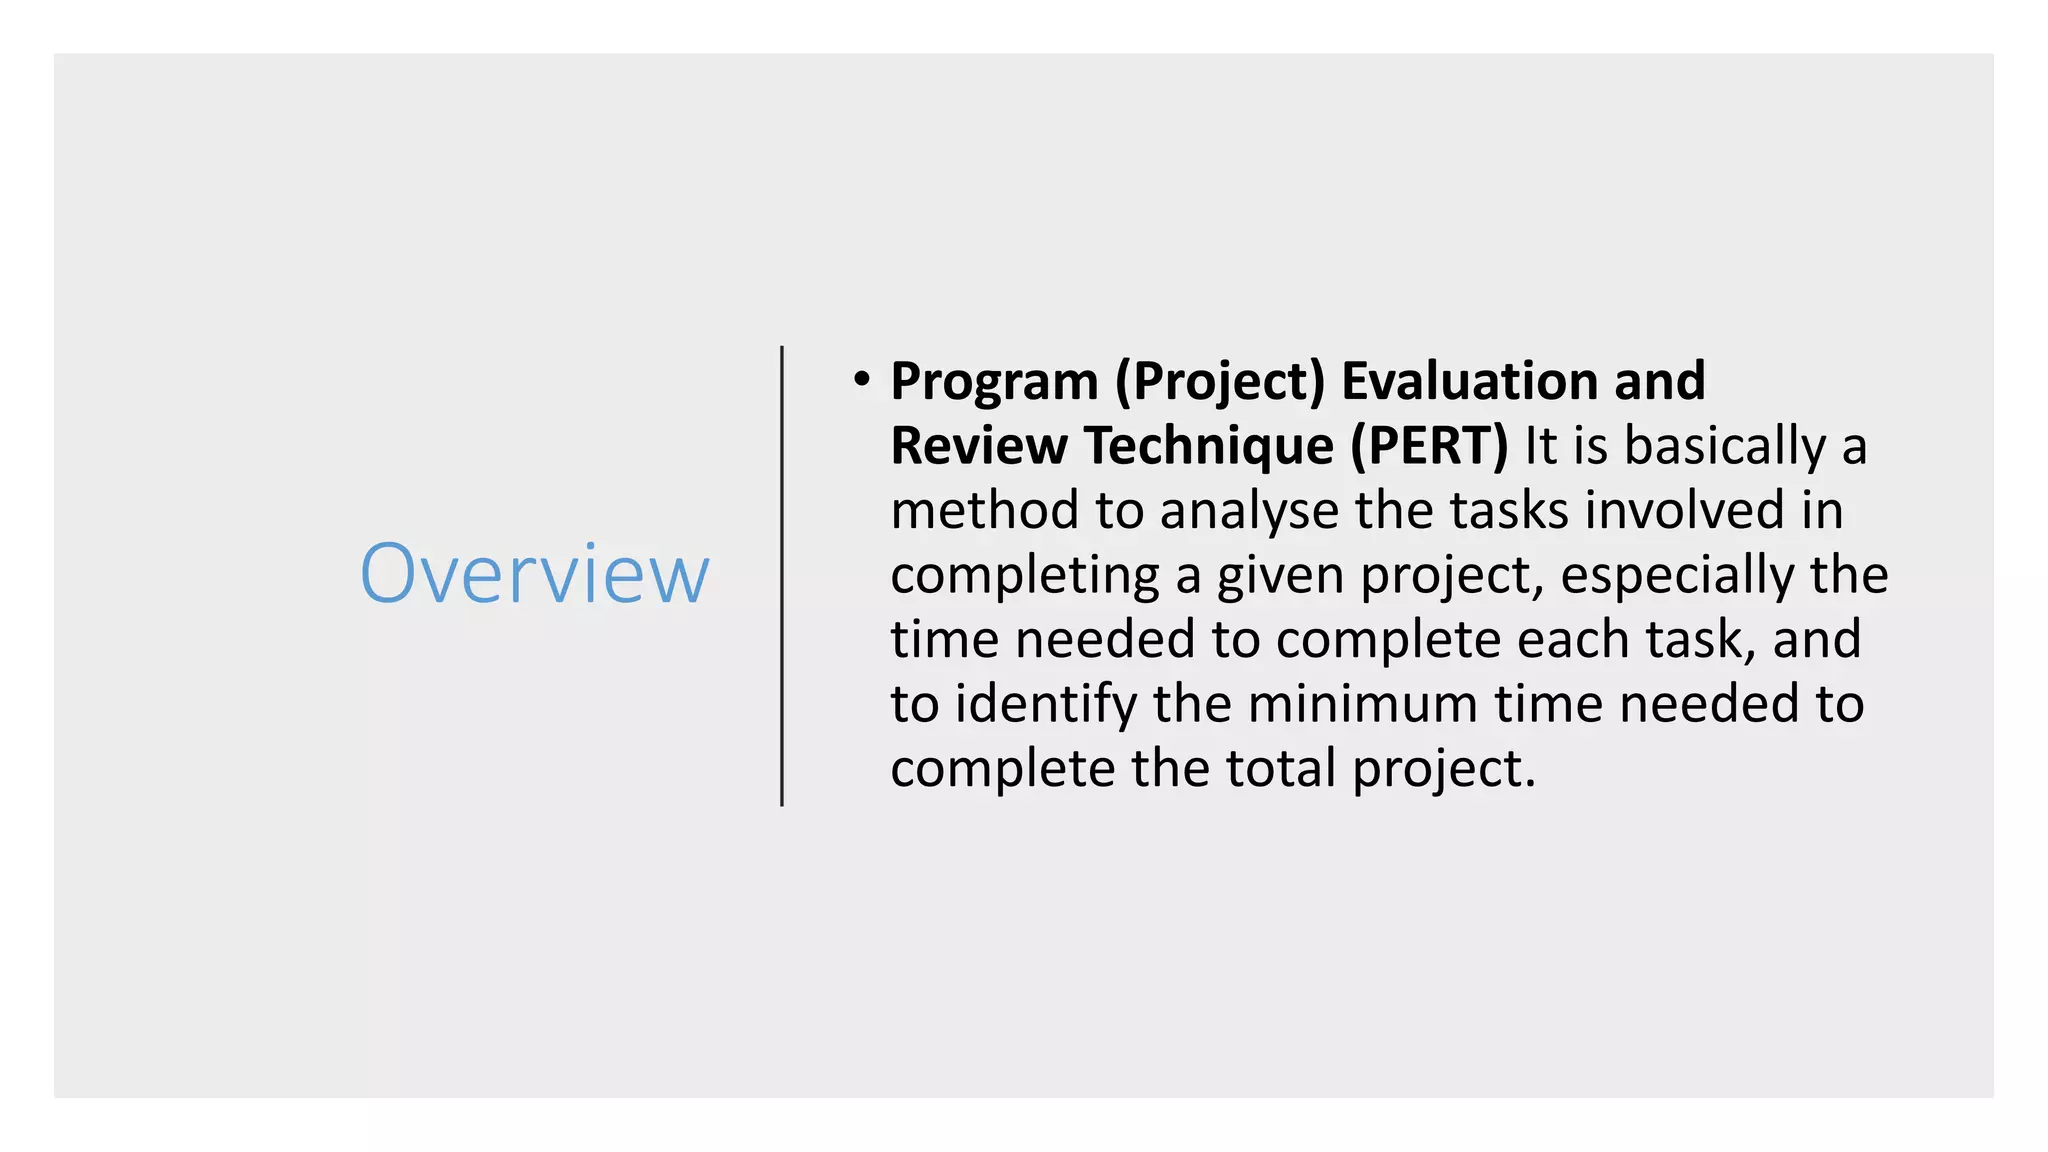
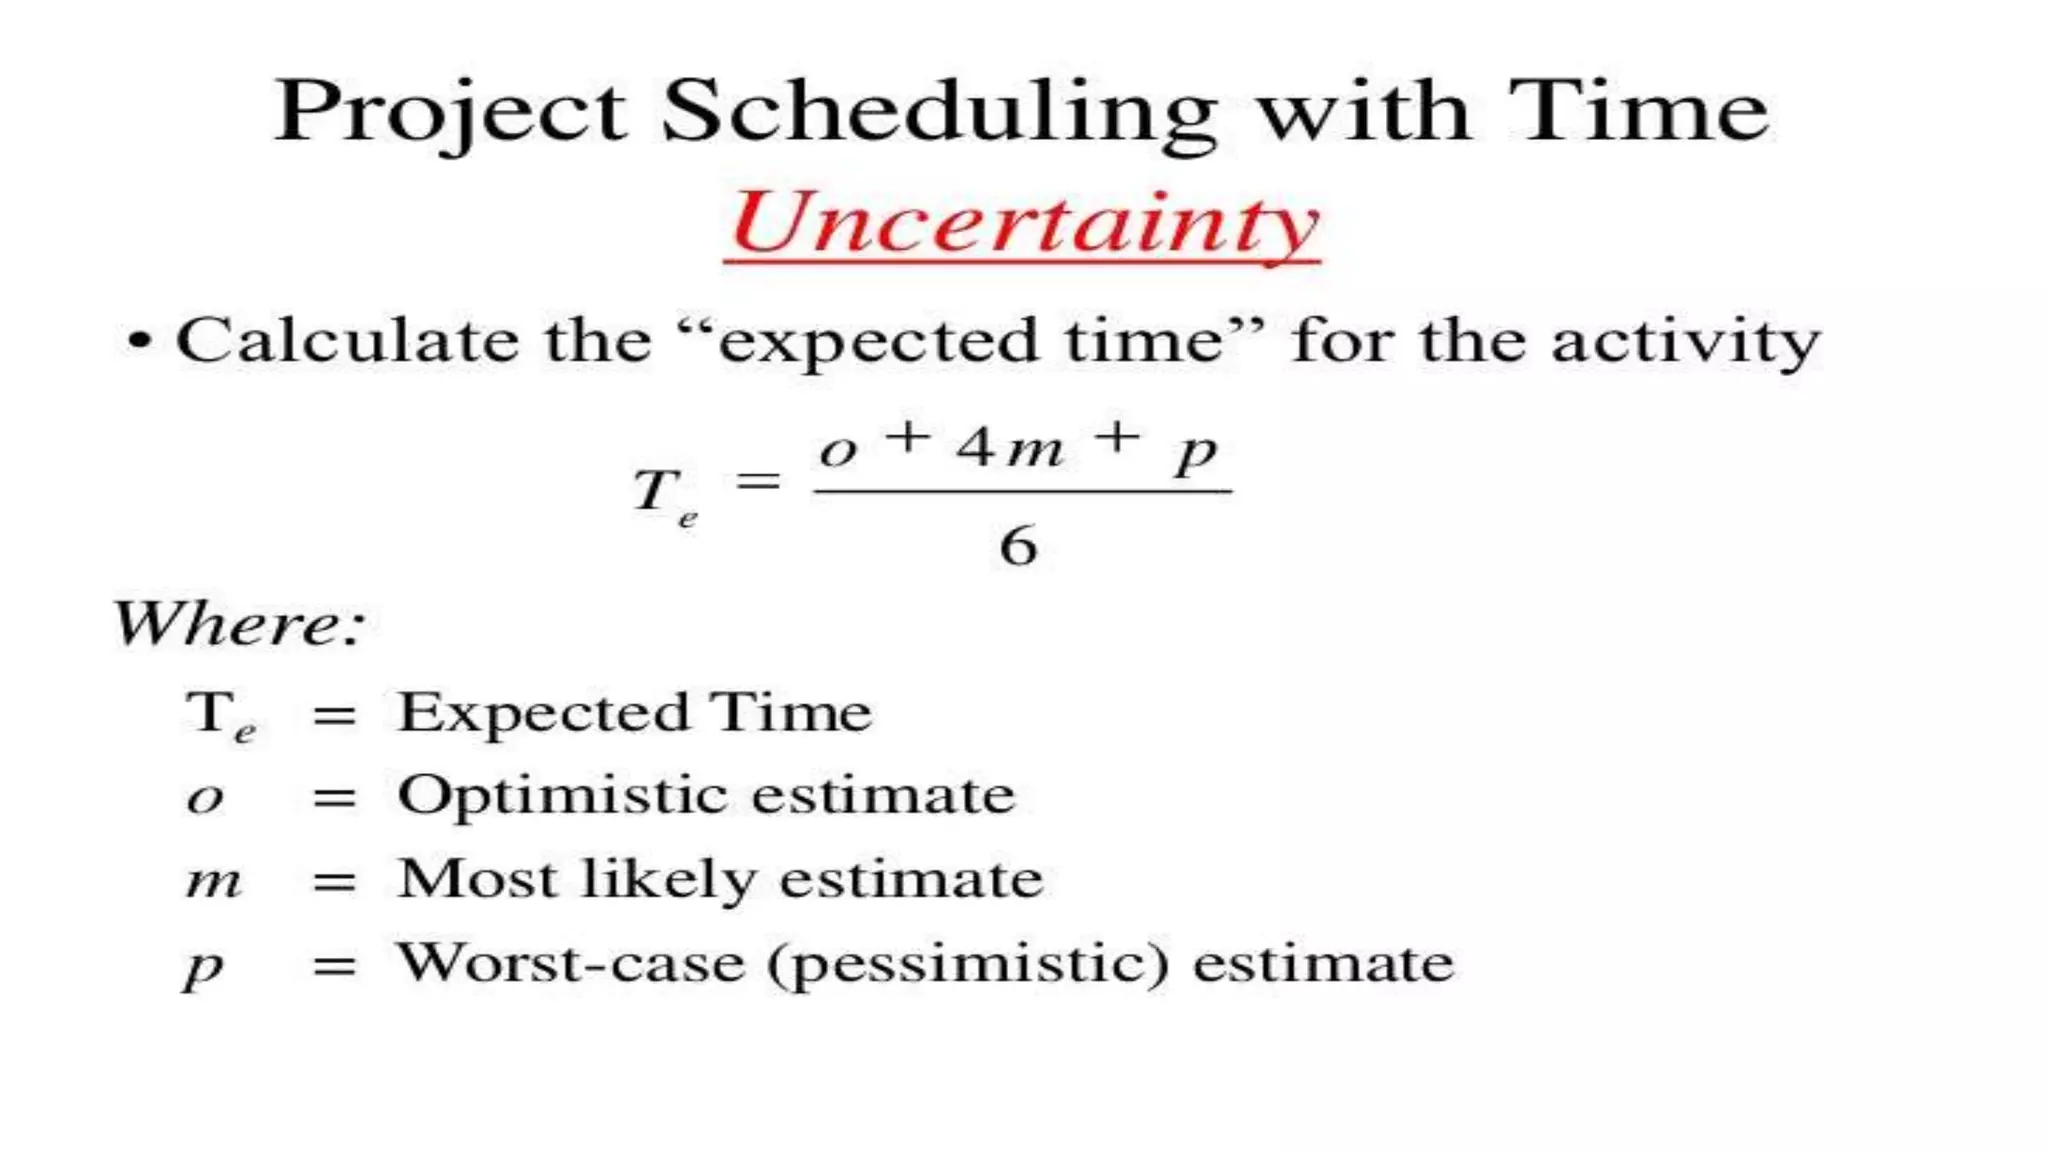
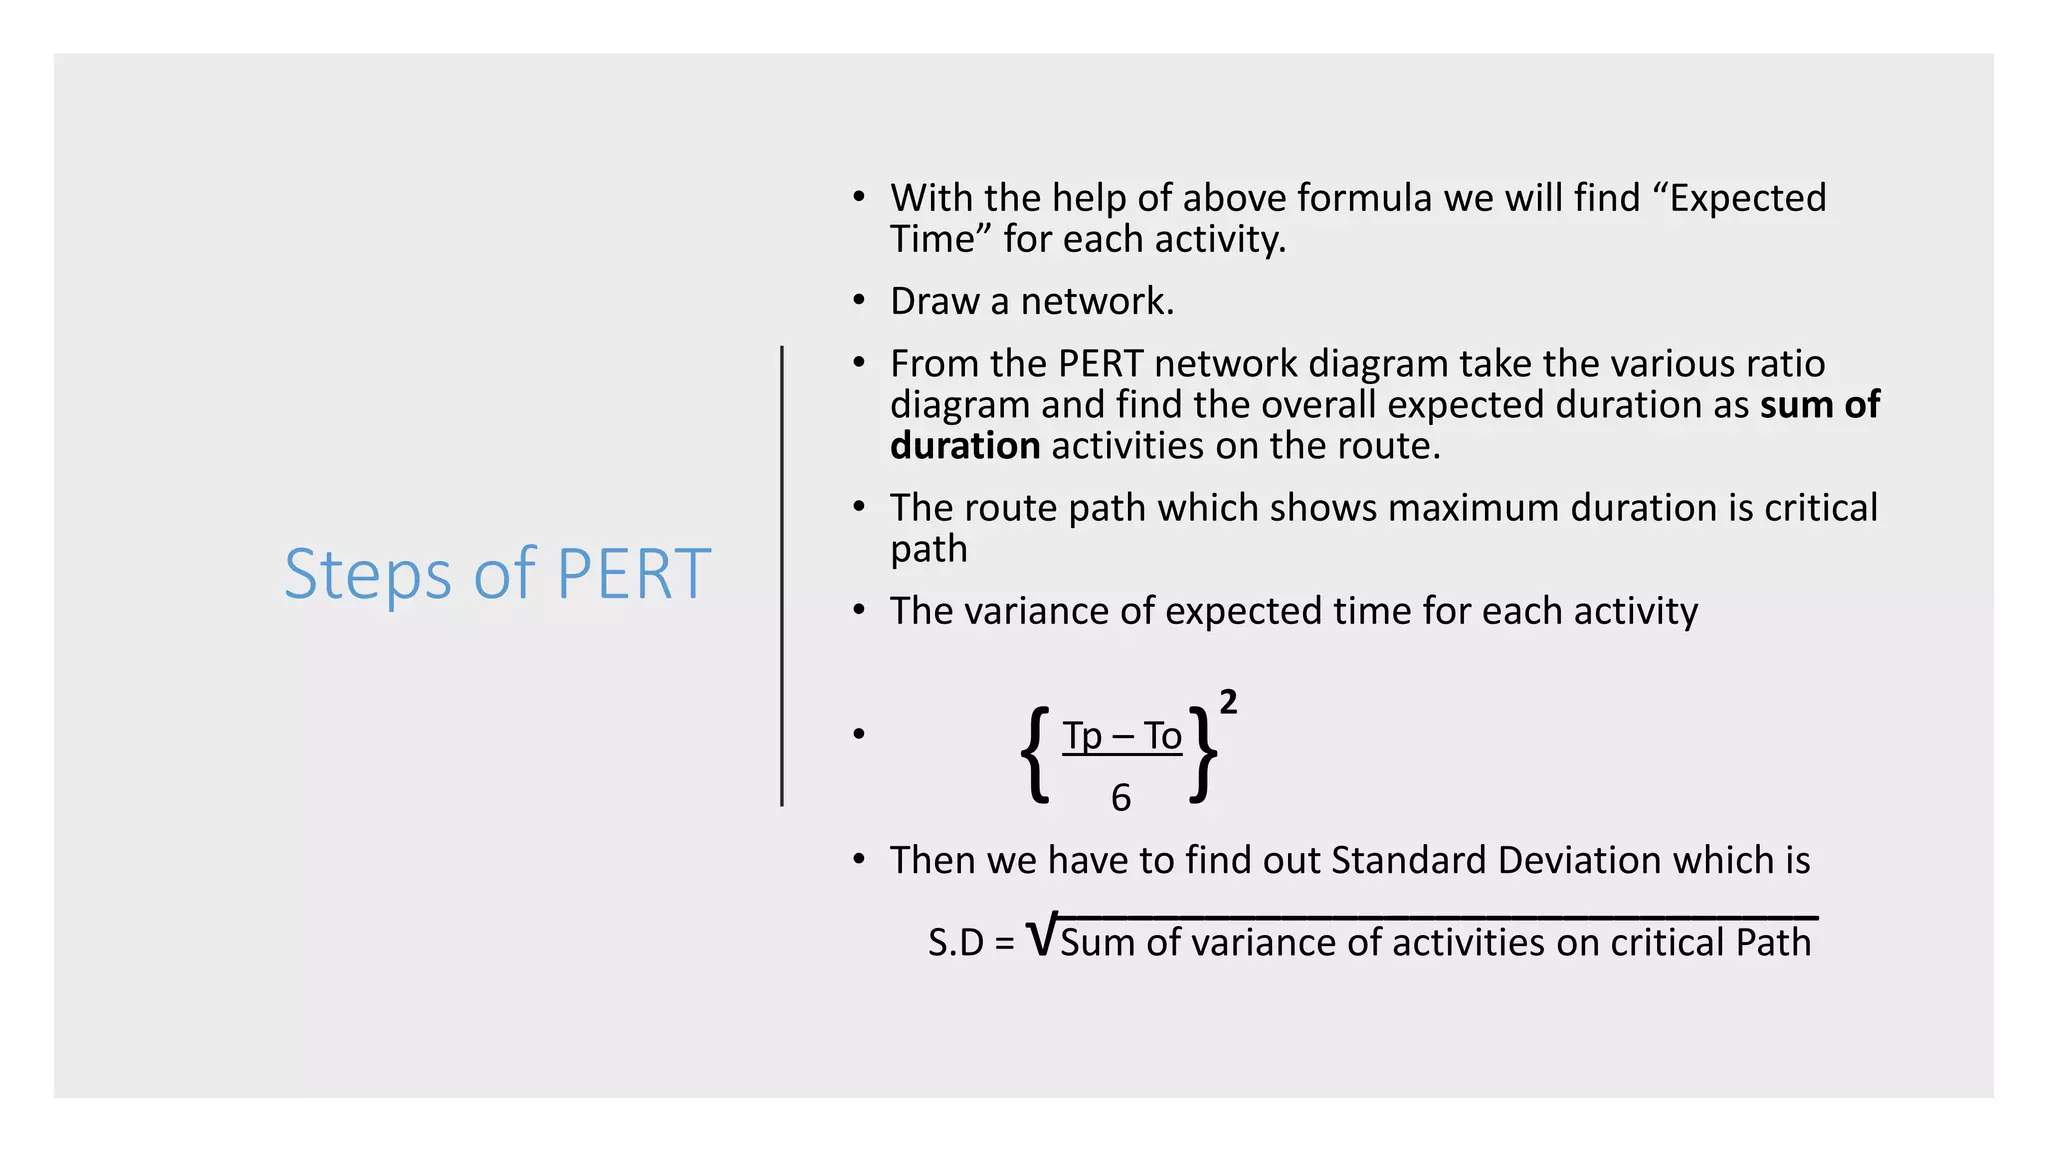
Program
evaluation and
review technique
Presented By:
Gautam Chopra
Saurabh Chopra
Pradhumn Soni
Chaman Tanwar
Kanak Binayakiya
Contents
• Overview
• History
• Terminology
• Implementation
• As project scheduling tool
Overview
• Program (Project) Evaluation and
Review Technique (PERT) It is basically a
method to analyse the tasks involved in
completing a given project, especially the
time needed to complete each task, and
to identify the minimum time needed to
complete the total project.
Terminology
• OPTIMISTIC TIME (O): Best time if
everything goes perfectly
• REALISTIC TIME(M): Most likely time
• PESSIMISTIC TIME(P): A worst-case
situation
Steps of PERT
• With the help of above formula we will find “Expected
Time” for each activity.
• Draw a network.
• From the PERT network diagram take the various ratio
diagram and find the overall expected duration as sum of
duration activities on the route.
• The route path which shows maximum duration is critical
path
• The variance of expected time for each activity
• Tp – To
6
• Then we have to find out Standard Deviation which is
S.D = √Sum of variance of activities on critical Path
{ }
2
______________________________
Jobs
Duration
Optimistic Most Likely Pessimistic Expected Duration Variance
1-2 3 6 15 7 4
2-3 6 12 30 14 16
3-5 5 11 17 11 4
7-8 4 19 28 18 16
5-8 1 4 7 4 1
6-7 3 9 27 11 16
4-5 3 6 15 7 4
1-6 2 5 14 6 4
2-4 2 5 8 5 1
EXAMPLE:-
1 2 3 5
8
7
6
4
• 1-2-3-5-8 = 7+14+11+4 =36
• 1-2-4-5-8 = 7+5+7+4 =23
• 1-6-7-8 = 6+11+18 = 35
Activity 1-2-3-5-8 is having longer duration so it is lying on
the critical path.
Standard Deviation
1-2-3-5-8
S.D. =√2+16+4+1
= √25
S.D. = 5
THANK YOU

Program evaluation and review technique

  • 1.
    Program evaluation and review technique PresentedBy: Gautam Chopra Saurabh Chopra Pradhumn Soni Chaman Tanwar Kanak Binayakiya
  • 2.
    Contents • Overview • History •Terminology • Implementation • As project scheduling tool
  • 3.
    Overview • Program (Project)Evaluation and Review Technique (PERT) It is basically a method to analyse the tasks involved in completing a given project, especially the time needed to complete each task, and to identify the minimum time needed to complete the total project.
  • 4.
    Terminology • OPTIMISTIC TIME(O): Best time if everything goes perfectly • REALISTIC TIME(M): Most likely time • PESSIMISTIC TIME(P): A worst-case situation
  • 6.
    Steps of PERT •With the help of above formula we will find “Expected Time” for each activity. • Draw a network. • From the PERT network diagram take the various ratio diagram and find the overall expected duration as sum of duration activities on the route. • The route path which shows maximum duration is critical path • The variance of expected time for each activity • Tp – To 6 • Then we have to find out Standard Deviation which is S.D = √Sum of variance of activities on critical Path { } 2 ______________________________
  • 7.
    Jobs Duration Optimistic Most LikelyPessimistic Expected Duration Variance 1-2 3 6 15 7 4 2-3 6 12 30 14 16 3-5 5 11 17 11 4 7-8 4 19 28 18 16 5-8 1 4 7 4 1 6-7 3 9 27 11 16 4-5 3 6 15 7 4 1-6 2 5 14 6 4 2-4 2 5 8 5 1 EXAMPLE:-
  • 8.
    1 2 35 8 7 6 4
  • 9.
    • 1-2-3-5-8 =7+14+11+4 =36 • 1-2-4-5-8 = 7+5+7+4 =23 • 1-6-7-8 = 6+11+18 = 35 Activity 1-2-3-5-8 is having longer duration so it is lying on the critical path.
  • 10.
  • 11.

Editor's Notes

  • #5 Consider talking about: Events and activities Management tools
  • #7 Consider talking about: Example Next step, creating network diagram by hand or by using diagram software Next step, determination of critical path and possible slack