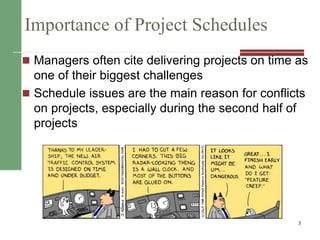
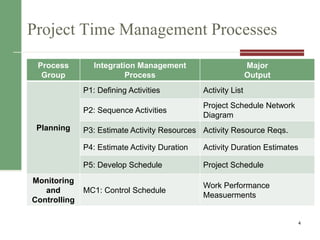
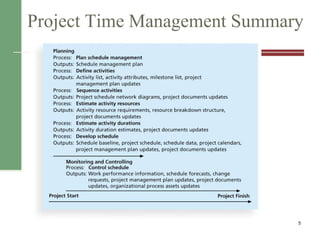
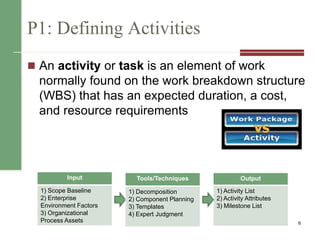
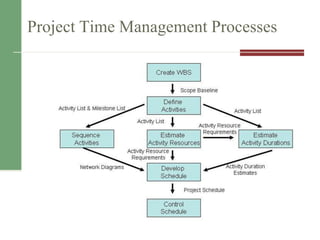
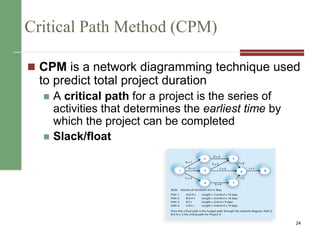
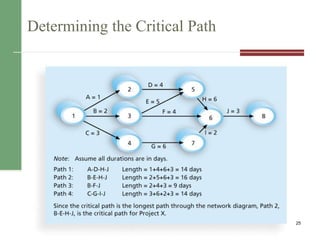
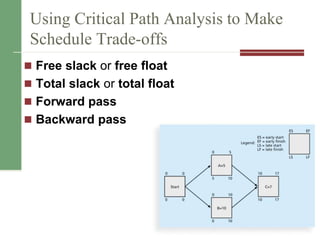
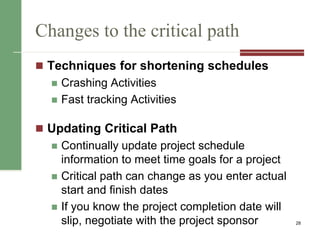
Project Time Management
PMI Knowledge Areas
Announcements
 Project Deliverables
 Project – Integration Mgmt
 Project – Scope Mgmt (due Friday)
 Exercise 2 – available Friday
 Midterm Next Monday
2
Importance of Project Schedules
 Managers often cite delivering projects on time as
one of their biggest challenges
 Schedule issues are the main reason for conflicts
on projects, especially during the second half of
projects
3
Project Time Management Processes
4
Process
Group
Integration Management
Process
Major
Output
Planning
P1: Defining Activities Activity List
P2: Sequence Activities
Project Schedule Network
Diagram
P3: Estimate Activity Resources Activity Resource Reqs.
P4: Estimate Activity Duration Activity Duration Estimates
P5: Develop Schedule Project Schedule
Monitoring
and
Controlling
MC1: Control Schedule
Work Performance
Measuerments
Project Time Management Summary
5
P1: Defining Activities
 An activity or task is an element of work
normally found on the work breakdown structure
(WBS) that has an expected duration, a cost,
and resource requirements
6
Input
1) Scope Baseline
2) Enterprise
Environment Factors
3) Organizational
Process Assets
Tools/Techniques
1) Decomposition
2) Component Planning
3) Templates
4) Expert Judgment
Output
1) Activity List
2) Activity Attributes
3) Milestone List
Activity Lists, Attributes &
Milestones
 An activity list is a tabulation of activities to
be included on a project schedule that
includes
 Activity attributes
 A milestone is a significant event that
normally has no duration
 Examples include obtaining customer sign-off
on key documents or completion of specific
products
7
P2: Sequencing Activities
 Involves reviewing activities and determining
dependencies
 A dependency or relationship is the
sequencing of project activities or tasks
 You must determine dependencies in order to
use critical path analysis
8
Input
1) Activity List &
Attributes
2) Milestone List
3) Scope Statement
4) Org Process Assets
Tools/Techniques
1) Determine Dependency
2) PDM
3) Apply Leads/Lags
4) Schedule Network
templates
Output
1) Project Schedule
Network Diagrams
2) Update Project Docs
Network Diagrams
 A network diagram is a schematic display of
the logical relationships among, or
sequencing of, project activities
 Two main formats are the arrow and
precedence diagramming methods
9
Activity-on-arrow (AOA) or Arrow
Diagramming Method (ADM)
 Activities are represented by arrows
 Nodes or circles are the starting and ending
points of activities
 Can only show finish-to-start dependencies
10
Precedence Diagramming Method
(PDM)
 Activities are represented by boxes
 Arrows show relationships between activities
 More popular than ADM method and used by
project management software
11
http://csb.uncw.edu/people/cummingsj/classes/MIS492/Exercises/SampleTime.mpp
Figure 6-3. Task Dependency Types
12
Reasons for Creating Dependencies
 Mandatory dependencies (hard logic)
 Discretionary dependencies (soft logic)
 External dependencies
13
P3: Estimating Activity Resources
 A resource breakdown structure is a
hierarchical structure that identifies the project’s
resources by category and type
14
Input
1) Activity List &
Attributes
2) Resource Calendars
3) Enterprise Factors
4) Org Process Assets
Output
1) Activity Resource Req
2) Resource Breakdown
Structure
3) Updates to Project
Docs
Tools/Techniques
1) Alternative Analysis
2) Bottom-up Estimating
3) Expert Judgment
4) PM Software
5) Estimating Data
Determine the
resource requirements
for each activity
Estimating Activity Resources
 Consider important issues in estimating
resources
 How difficult will it be to do specific activities on
this project?
 What is the organization’s history in doing similar
activities?
 Are the required resources available?
15
P4: Activity Duration Estimating
 Duration vs. Effort
 People doing the work should help create
estimates, and an expert should review them
 Instead of providing activity estimates as a
discrete number, such as four weeks, it’s often
helpful to create a three-point estimate
16
In Reality…This is quite challenging
 Stable Activities
 straightforward estimating
 Dependent Activities
 amount needed for testing is dependent on a
successful test or unsuccessful test.
 3-point estimates or analogous work well.
 Uncertain Activities
 No previous precedence (complex projects)
 Start with 3-point estimate to set boundaries then
use analogous to set actual estimate 17
P5: Developing the Schedule
 Ultimate goal is to create a realistic project
schedule that provides a basis for monitoring
project progress for the time dimension of the
project
18
Input
1) Activity List & Attributes
2) Activity Resource Reqs
3) Resource Calendars
4) Schedule Diagrams
5) Duration Estimate
6) Scope Statement
7) Enterprise Factors
8) Org Process Assets
Output
1) Project Schedule
2) Schedule baseline
3) Schedule data
4) Updates to Project
Docs
Tools/Techniques
1) Schedule Network
analysis
2) Critical Path Method
3) Schedule Compression
4) What-if Scenarios
5) Resource Leveling
6) Critical Chain Method
7) Applying Leads/Lags
8) PM Software
Project Time Management Processes
19
Gantt Charts
 Gantt charts provide a standard format for
displaying project schedule information by listing
project activities and their corresponding start
and finish dates in a calendar format
 Symbols include:
 A black diamond: a milestones
 Thick black bars: summary tasks
 Lighter horizontal bars: durations of tasks
 Arrows: dependencies between tasks
20
Gantt Chart for Software Launch Project
21
Milestones and Gantt Charts
 Many people like to focus on meeting
milestones, especially for large projects
 Normally create milestone by entering tasks with
a zero duration, or you can mark any task as a
milestone
 Milestones should follow the SMART Criteria
1. Define milestones early and include in Gantt chart
2. Keep milestones small and frequent
3. The set of milestones must be all-encompassing
4. Each milestone must be binary (either complete or incomplete)
5. Carefully monitor the critical path
22
Project Time Management Techniques
 Critical Path Method
 Critical Chain Scheduling
 PERT
23
Critical Path Method (CPM)
 CPM is a network diagramming technique used
to predict total project duration
 A critical path for a project is the series of
activities that determines the earliest time by
which the project can be completed
 Slack/float
24
Determining the Critical Path
25
Draw the Network (Arrow)
Activity Initial Node Final Node Estimated Duration
A 1 2 2
B 2 3 2
C 2 4 3
D 2 5 4
E 3 6 2
F 4 6 3
G 5 7 6
H 6 8 2
I 6 7 5
J 7 8 1
K 8 9 2
1. How long will it take to complete each path (how many?)
2. Which path is the critical path?
Using Critical Path Analysis to Make
Schedule Trade-offs
 Free slack or free float
 Total slack or total float
 Forward pass
 Backward pass
27
Changes to the critical path
 Techniques for shortening schedules
 Crashing Activities
 Fast tracking Activities
 Updating Critical Path
 Continually update project schedule
information to meet time goals for a project
 Critical path can change as you enter actual
start and finish dates
 If you know the project completion date will
slip, negotiate with the project sponsor 28
PM Network: On the Right Track
 Fast tracking almost always results in
increased risk
 Ask yourself questions
 Probability of producing expected benefits
 Resource Availability & complexity
 Buy-in – Is Everyone on Board?
 Can the PM manage it?
29
Critical Chain Scheduling
 Critical chain scheduling
 a method of scheduling that considers limited
resources when creating a project schedule and
includes buffers to protect the project completion
date
30
Buffers and Critical Chain
 A buffer is additional time to complete a task
 In traditional estimates, people often add a buffer
to each task and use it if it’s needed or not
 Critical chain scheduling removes buffers from
individual tasks and instead creates
 a project buffer or additional time added before
the project’s due date
 feeding buffers or additional time added before
tasks on the critical path
31
Program Evaluation and Review
Technique (PERT)
 PERT is a network analysis technique used to
estimate project duration when there is a high
degree of uncertainty about the individual
activity duration estimates
PERT weighted average =
optimistic time + 4X most likely time + pessimistic time
6
32
PERT Example
What days should be included for the following activity:
Activity A:
Optimistic Estimate = 8 days
Most Likely Estimate = 10 days
Pessimistic Estimate = 24 days
33
Final Notes on Project Schedule
Development
 Iterative Process
 Review and revise the duration and resource
estimates
 You want to create something that can get approved
 Approved schedule will then act as the baseline to
track progress
34
PM Network: Time Tamers
 Heathrow Airport
 Project control handbook
 DOE - $3 billion over 70 projects
 Master schedule with critical path
 Belleli Energy Srl
 Worst case scenarios and impact to critical
path
35
MC1: Schedule Control Suggestions
 Perform reality checks on schedules
 Allow for contingencies
 Don’t plan for everyone to work at 100%
capacity all the time
 Hold progress meetings with stakeholders
and be clear and honest in communicating
schedule issues
36
Controlling the Schedule
 Goals are to know the status of the schedule,
influence factors that cause schedule changes,
determine that the schedule has changed, and
manage changes when they occur
 Reality Checks on Schedule
 First review the draft schedule or estimated
completion date in the project charter
 Prepare a more detailed schedule with the team
 Make sure the schedule is realistic and followed
 Alert top management well in advance if there are
schedule problems
37
Using Software to Assist in Time
Management
 Software for facilitating communications helps
people exchange schedule-related
information
 Decision support models help analyze trade-
offs that can be made
 Project management software can help in
various time management areas
38
Words of Caution on Using Project
Management Software
 Many people misuse project management
software because they don’t understand
important concepts and have not had training
 You must enter dependencies to have dates
adjust automatically and to determine the
critical path
 You must enter actual schedule information
to compare planned and actual progress
39
Chapter Summary
 Project time management is often cited as the
main source of conflict on projects, and most IT
projects exceed time estimates
 Main processes include
 Plan schedule management
 Define activities
 Sequence activities
 Estimate activity resources
 Estimate activity durations
 Develop schedule
 Control schedule 40
CAPM Questions
 You know from a network diagram that Activity B
cannot start until Activity A is finished. Which of
the following are true:
a) Activities A and B have a start to finish dependency
b) Activities A and B have a finish to start dependency
c) Activity B has a mandatory dependency on Activity A
d) Activities A and B are on a critical path
41
CAPM Questions
 What is the crashing technique used for?
a) Network Diagramming
b) Duration Compression
c) Cost Reduction
d) Activity Sequencing
42

08 ch06

  • 1.
  • 2.
    Announcements  Project Deliverables Project – Integration Mgmt  Project – Scope Mgmt (due Friday)  Exercise 2 – available Friday  Midterm Next Monday 2
  • 3.
    Importance of ProjectSchedules  Managers often cite delivering projects on time as one of their biggest challenges  Schedule issues are the main reason for conflicts on projects, especially during the second half of projects 3
  • 4.
    Project Time ManagementProcesses 4 Process Group Integration Management Process Major Output Planning P1: Defining Activities Activity List P2: Sequence Activities Project Schedule Network Diagram P3: Estimate Activity Resources Activity Resource Reqs. P4: Estimate Activity Duration Activity Duration Estimates P5: Develop Schedule Project Schedule Monitoring and Controlling MC1: Control Schedule Work Performance Measuerments
  • 5.
  • 6.
    P1: Defining Activities An activity or task is an element of work normally found on the work breakdown structure (WBS) that has an expected duration, a cost, and resource requirements 6 Input 1) Scope Baseline 2) Enterprise Environment Factors 3) Organizational Process Assets Tools/Techniques 1) Decomposition 2) Component Planning 3) Templates 4) Expert Judgment Output 1) Activity List 2) Activity Attributes 3) Milestone List
  • 7.
    Activity Lists, Attributes& Milestones  An activity list is a tabulation of activities to be included on a project schedule that includes  Activity attributes  A milestone is a significant event that normally has no duration  Examples include obtaining customer sign-off on key documents or completion of specific products 7
  • 8.
    P2: Sequencing Activities Involves reviewing activities and determining dependencies  A dependency or relationship is the sequencing of project activities or tasks  You must determine dependencies in order to use critical path analysis 8 Input 1) Activity List & Attributes 2) Milestone List 3) Scope Statement 4) Org Process Assets Tools/Techniques 1) Determine Dependency 2) PDM 3) Apply Leads/Lags 4) Schedule Network templates Output 1) Project Schedule Network Diagrams 2) Update Project Docs
  • 9.
    Network Diagrams  Anetwork diagram is a schematic display of the logical relationships among, or sequencing of, project activities  Two main formats are the arrow and precedence diagramming methods 9
  • 10.
    Activity-on-arrow (AOA) orArrow Diagramming Method (ADM)  Activities are represented by arrows  Nodes or circles are the starting and ending points of activities  Can only show finish-to-start dependencies 10
  • 11.
    Precedence Diagramming Method (PDM) Activities are represented by boxes  Arrows show relationships between activities  More popular than ADM method and used by project management software 11 http://csb.uncw.edu/people/cummingsj/classes/MIS492/Exercises/SampleTime.mpp
  • 12.
    Figure 6-3. TaskDependency Types 12
  • 13.
    Reasons for CreatingDependencies  Mandatory dependencies (hard logic)  Discretionary dependencies (soft logic)  External dependencies 13
  • 14.
    P3: Estimating ActivityResources  A resource breakdown structure is a hierarchical structure that identifies the project’s resources by category and type 14 Input 1) Activity List & Attributes 2) Resource Calendars 3) Enterprise Factors 4) Org Process Assets Output 1) Activity Resource Req 2) Resource Breakdown Structure 3) Updates to Project Docs Tools/Techniques 1) Alternative Analysis 2) Bottom-up Estimating 3) Expert Judgment 4) PM Software 5) Estimating Data Determine the resource requirements for each activity
  • 15.
    Estimating Activity Resources Consider important issues in estimating resources  How difficult will it be to do specific activities on this project?  What is the organization’s history in doing similar activities?  Are the required resources available? 15
  • 16.
    P4: Activity DurationEstimating  Duration vs. Effort  People doing the work should help create estimates, and an expert should review them  Instead of providing activity estimates as a discrete number, such as four weeks, it’s often helpful to create a three-point estimate 16
  • 17.
    In Reality…This isquite challenging  Stable Activities  straightforward estimating  Dependent Activities  amount needed for testing is dependent on a successful test or unsuccessful test.  3-point estimates or analogous work well.  Uncertain Activities  No previous precedence (complex projects)  Start with 3-point estimate to set boundaries then use analogous to set actual estimate 17
  • 18.
    P5: Developing theSchedule  Ultimate goal is to create a realistic project schedule that provides a basis for monitoring project progress for the time dimension of the project 18 Input 1) Activity List & Attributes 2) Activity Resource Reqs 3) Resource Calendars 4) Schedule Diagrams 5) Duration Estimate 6) Scope Statement 7) Enterprise Factors 8) Org Process Assets Output 1) Project Schedule 2) Schedule baseline 3) Schedule data 4) Updates to Project Docs Tools/Techniques 1) Schedule Network analysis 2) Critical Path Method 3) Schedule Compression 4) What-if Scenarios 5) Resource Leveling 6) Critical Chain Method 7) Applying Leads/Lags 8) PM Software
  • 19.
  • 20.
    Gantt Charts  Ganttcharts provide a standard format for displaying project schedule information by listing project activities and their corresponding start and finish dates in a calendar format  Symbols include:  A black diamond: a milestones  Thick black bars: summary tasks  Lighter horizontal bars: durations of tasks  Arrows: dependencies between tasks 20
  • 21.
    Gantt Chart forSoftware Launch Project 21
  • 22.
    Milestones and GanttCharts  Many people like to focus on meeting milestones, especially for large projects  Normally create milestone by entering tasks with a zero duration, or you can mark any task as a milestone  Milestones should follow the SMART Criteria 1. Define milestones early and include in Gantt chart 2. Keep milestones small and frequent 3. The set of milestones must be all-encompassing 4. Each milestone must be binary (either complete or incomplete) 5. Carefully monitor the critical path 22
  • 23.
    Project Time ManagementTechniques  Critical Path Method  Critical Chain Scheduling  PERT 23
  • 24.
    Critical Path Method(CPM)  CPM is a network diagramming technique used to predict total project duration  A critical path for a project is the series of activities that determines the earliest time by which the project can be completed  Slack/float 24
  • 25.
  • 26.
    Draw the Network(Arrow) Activity Initial Node Final Node Estimated Duration A 1 2 2 B 2 3 2 C 2 4 3 D 2 5 4 E 3 6 2 F 4 6 3 G 5 7 6 H 6 8 2 I 6 7 5 J 7 8 1 K 8 9 2 1. How long will it take to complete each path (how many?) 2. Which path is the critical path?
  • 27.
    Using Critical PathAnalysis to Make Schedule Trade-offs  Free slack or free float  Total slack or total float  Forward pass  Backward pass 27
  • 28.
    Changes to thecritical path  Techniques for shortening schedules  Crashing Activities  Fast tracking Activities  Updating Critical Path  Continually update project schedule information to meet time goals for a project  Critical path can change as you enter actual start and finish dates  If you know the project completion date will slip, negotiate with the project sponsor 28
  • 29.
    PM Network: Onthe Right Track  Fast tracking almost always results in increased risk  Ask yourself questions  Probability of producing expected benefits  Resource Availability & complexity  Buy-in – Is Everyone on Board?  Can the PM manage it? 29
  • 30.
    Critical Chain Scheduling Critical chain scheduling  a method of scheduling that considers limited resources when creating a project schedule and includes buffers to protect the project completion date 30
  • 31.
    Buffers and CriticalChain  A buffer is additional time to complete a task  In traditional estimates, people often add a buffer to each task and use it if it’s needed or not  Critical chain scheduling removes buffers from individual tasks and instead creates  a project buffer or additional time added before the project’s due date  feeding buffers or additional time added before tasks on the critical path 31
  • 32.
    Program Evaluation andReview Technique (PERT)  PERT is a network analysis technique used to estimate project duration when there is a high degree of uncertainty about the individual activity duration estimates PERT weighted average = optimistic time + 4X most likely time + pessimistic time 6 32
  • 33.
    PERT Example What daysshould be included for the following activity: Activity A: Optimistic Estimate = 8 days Most Likely Estimate = 10 days Pessimistic Estimate = 24 days 33
  • 34.
    Final Notes onProject Schedule Development  Iterative Process  Review and revise the duration and resource estimates  You want to create something that can get approved  Approved schedule will then act as the baseline to track progress 34
  • 35.
    PM Network: TimeTamers  Heathrow Airport  Project control handbook  DOE - $3 billion over 70 projects  Master schedule with critical path  Belleli Energy Srl  Worst case scenarios and impact to critical path 35
  • 36.
    MC1: Schedule ControlSuggestions  Perform reality checks on schedules  Allow for contingencies  Don’t plan for everyone to work at 100% capacity all the time  Hold progress meetings with stakeholders and be clear and honest in communicating schedule issues 36
  • 37.
    Controlling the Schedule Goals are to know the status of the schedule, influence factors that cause schedule changes, determine that the schedule has changed, and manage changes when they occur  Reality Checks on Schedule  First review the draft schedule or estimated completion date in the project charter  Prepare a more detailed schedule with the team  Make sure the schedule is realistic and followed  Alert top management well in advance if there are schedule problems 37
  • 38.
    Using Software toAssist in Time Management  Software for facilitating communications helps people exchange schedule-related information  Decision support models help analyze trade- offs that can be made  Project management software can help in various time management areas 38
  • 39.
    Words of Cautionon Using Project Management Software  Many people misuse project management software because they don’t understand important concepts and have not had training  You must enter dependencies to have dates adjust automatically and to determine the critical path  You must enter actual schedule information to compare planned and actual progress 39
  • 40.
    Chapter Summary  Projecttime management is often cited as the main source of conflict on projects, and most IT projects exceed time estimates  Main processes include  Plan schedule management  Define activities  Sequence activities  Estimate activity resources  Estimate activity durations  Develop schedule  Control schedule 40
  • 41.
    CAPM Questions  Youknow from a network diagram that Activity B cannot start until Activity A is finished. Which of the following are true: a) Activities A and B have a start to finish dependency b) Activities A and B have a finish to start dependency c) Activity B has a mandatory dependency on Activity A d) Activities A and B are on a critical path 41
  • 42.
    CAPM Questions  Whatis the crashing technique used for? a) Network Diagramming b) Duration Compression c) Cost Reduction d) Activity Sequencing 42