SlideShare a Scribd company logo
1 of 119
Frequencies, Proportion, Graphs
February 8th, 2016
Frequency, Percentages, and Proportions
Frequency number of participants or cases.
Denoted by the symbol f.
N can also mean frequency.
f=50 or N=50 had a score of 80. Both mean that 50 people had
a score of 80.
Percentage, number per 100 who have a certain characteristic.
64% of registered voters are Democrats; each 100 registered
voters 64 are Democrats
To determine how many are Democrats
Multiply the total number of registered voters by .64; if we have
2,200 registered voters; .64 X 2200=1408 are democrats.
2
Percentage and Proportions
Percentages
32 of 96 children reported that a dog is their favorite animal ;
32/96=.33*100=33% of these students like dogs.
Interpretation: Based on this sample, out of 100 participants
from the same population, we can expect about 33 of them to
report that dogs are their favorite animal.
Proportions is part of numeral 1.
Proportion of children who like dogs is .33
Meaning that 33 hundredths of the children like dogs.
Percentages are easier to interpret.
Percentages Cont’d
Good to report the sample size with the frequency
Percentages can help us understand differences between groups
of individuals
College ACollege BNumber of Education
MajorsN=500N=800Early Childhood EducationN= 400
(80%)N=600
(75%)
Shapes of Distributions
Frequency distribution
Number of participants have each score
Remember that we are describing our data
X (Score)f2522442352110207194181171N=34
Frequency Polygon
Histogram
Shapes of Distributions Cont’d
Normal Distribution
Most Important shape (shape found in nature)
Heights of 10 year old boys in a large population
Bell-shaped curve
Used for inferential Statistics
Skewed Distributions
Skew: most frequent scores are clustered at one end of the
distribution
The symmetry of the distribution.
Positive skew (scores bunched at low values with the tail
pointing to high values).
Negative skew (scores bunched at high values with the tail
pointing to low values).
Consider how groups differ depending on their standard
deviation.
68% of the cases lie within one standard deviation unit of the
mean in a normal distribution.
95% of the cases lie within two standard deviation unit of the
mean in a normal distribution
99% of the cases lie within three standard deviation unit of the
mean in a normal distribution
Standard Deviation and the Normal Distribution
February 1, 2016
Descriptive Statistics
Number of Children in families
Order of finish in the Boston Marathon
Grading System (A, B, C, D, F)
Level of Blood Sugar
Time required to complete a maze
Political Party Affiliation
Amount of gasoline consumed
Majors in College
IQ scores
Number of Fatal Accidents
Level of Measurement Examples
2
Types of Statistics
We use descriptive statistics to summarize data
Think about measures of central tendency and variability
We use correlational statistics to describe the relationship
between two variables
Considered as a special case of descriptive statistics
We use inferential statistics to generalize from the sample to the
larger population
Measures of Central Tendency
Mean
Average Score
Median
Middle 50% of the distribution; point at which 50% of the
distribution lies above or below.
Mode
Most Frequent Score
Central tendency: The Mode
Mode: score that occurs the most frequently in the dataset.
Bimodal
Having two modes
Multimodal
Having several modes
Can take on several values
Ex. 10 12 12 14 16 18 19 20
Ex. 15 16 17 17 18 19 19 20
5
Central Tendency: The Median
Median
The middle score when scores are ordered.
Example
Number of friends of 11 Facebook users.
Ex. 22 40 53 57 93 98 103 108 116 121 252
Arrange the score in ascending order
Count the number of scores we have collected (n)
Add one to this value
Divide by 2
Find the score in that position
(n+1)/2= (11+1)/2= 12/2=6
6
Central Tendency: Median Cont’d
Ex. 22 40 53 57 93 98 103 108 116 121 252
Drop 252
(n+1)/2= (10+1)/2= 11/2=5.5
Median is halfway between the 5th and 6th score
Add the 5th and 6th score and divide by 2
93+98=191/2=95.5
Median is unaffected by extreme scores at either end of the
continuum
Useful for ordinal, interval, and ratio level data.
7
Central Tendency: The Mean
Mean
The sum of scores divided by the number of scores.
Number of friends of 11 Facebook users.
8
Central Tendency: The Mean Cont’d
Using the same example, if we drop the extreme score (252).
Mean drops to 81.1 friends.
Influenced by extreme scores.
9
Shapes of Distributions Cont’d
Normal Distribution
Most Important shape (shape found in nature)
Heights of 10 year old boys in a large population
Bell-shaped curve
Used for inferential Statistics
Skewed Distributions
Skew: most frequent scores are clustered at one end of the
distribution
The symmetry of the distribution.
Positive skew (scores bunched at low values with the tail
pointing to high values).
Negative skew (scores bunched at high values with the tail
pointing to low values).
In a skewed distribution, the mode will be located at the peak
on one side and the mean will be displaced toward the tail on
the other side.
The median is usually between the mode and the mean
Compare the three measures of central tendency by looking at
frequency distribution
Comparison of the Mean, Median, Mode
11
Mean, Median, and Mode
12
PositionNumber of
EmployeesSalaryPresident1$180,000Executive vice
President1$60,000Vice Presidents2$40,000Controller1$22,000
(mean)Senior salespeople3$20,000Junior
salespeople4$14,800Foreman1$12,000
(median)Machinists12$8,000 (mode)
Example
13
Click to edit Master text styles
Second level
Third level
Fourth level
Fifth level
14
Slide 15
A Simple Statistical Model
In Statistics we fit models to our data (i.e. we use a statistical
model to represent what is happening in the real world).
The mean is a hypothetical value (i.e. it doesn’t have to be a
value that actually exists in the data set).
As such, the mean is simple statistical model.
15
Slide 16
The Mean
The mean is the sum of all scores divided by the number of
scores.
The mean is also the value from which the (squared) scores
deviate least (it has the least error).
16
Slide 17
Measuring the ‘Fit’ of the Model
Measuring the degree to which a statistical model represents the
data collected is called the fit.
The mean is a model of what happens in the real world: the
typical score
It is not a perfect representation of the data
How can we assess how well the mean represents reality?
17
Differences among participants
Describe the amount of variability in a set of scores
Range, Variance, Standard Deviation
A lot of variability vs. a little variability.
Variability
18
Range: quantification of the spread, or dispersion of scores in
the data.
Ex. Facebook friends
22, 40, 53, 57, 93, 98, 103, 108, 116, 121, 252
Highest Score-Lowest Score
252-22=230
Dramatically effected by extreme scores
Used as a rough estimate of the variability of scores
Only based on extreme scores
Interquartile Range: calculate the range without the extreme
scores (associated with the median)
Range of the middle 50% of the participants
Cut off the top 25% of the top and bottom scores and calculate
the range of the middle 50% of the scores.
Range and Interquartile Range
Calculate quartiles
Three values that split the sorted data into four equal parts
Second quartile: median, splits the data into two equal parts
Mdn=98
Lower quartile: median of the lower half of the data
Upper quartile: median of the upper half of the data
Interquartile Range Cont’d
20
Interquartile Range Cont’d
21
Slide 22
A Simple Statistical Model
In Statistics we fit models to our data (i.e. we use a statistical
model to represent what is happening in the real world).
The mean is a hypothetical value (i.e. it doesn’t have to be a
value that actually exists in the data set).
As such, the mean is simple statistical model.
22
Slide 23
Measuring the ‘Fit’ of the Model
Measuring the degree to which a statistical model represents the
data collected is called the fit.
The mean is a model of what happens in the real world: the
typical score
It is not a perfect representation of the data
How can we assess how well the mean represents reality?
23
Slide 24
A Perfect Fit
Rater
Rating (out of 5)
24
Number of Friends 1.0 2.0 3.0 4.0 5.0 5.0 5.0 5.0
5.0 5.0
Slide 25
Calculating ‘Error’
A deviation is the difference between the mean and an actual
data point.
Deviations can be calculated by taking each score and
subtracting the mean from it:
25
Slide 26
Click to edit Master text styles
Second level
Third level
Fourth level
Fifth level
26
Slide 27
Use the Total Error?
We could just take the error between the mean and the data and
add them.
ScoreMean Deviation12.6-1.622.6-
0.632.60.432.60.442.61.4Total =0
27
Slide 28
Sum of Squared Errors
We could add the deviations to find out the total error.
Deviations cancel out because some are positive and others
negative.
Therefore, we square each deviation.
If we add these squared deviations we get the Sum of Squared
Errors (SS).
Good measure of the accuracy of a model
28
Slide 29
ScoreMean DeviationSquared Deviation12.6-1.62.5622.6-
0.60.3632.60.40.1632.60.40.1642.61.41.96Total5.20
Click to edit Master text styles
Second level
Third level
Fourth level
Fifth level
29
Slide 30
Variance
The sum of squares is a good measure of overall variability, but
is dependent on the number of scores.
We calculate the average variability by dividing by the number
of scores (n).
This value is called the variance (s2).
Average of the error between the mean and the observations
30
Slide 31
Standard Deviation
The variance has one problem: it is measured in units squared.
This isn’t a very meaningful metric so we take the square root
value.
This is the Standard Deviation (s).
31
Slide 32
Important Things to Remember
The Sum of Squares, Variance, and Standard Deviation
represent the same thing:
The ‘Fit’ of the mean to the data
The variability in the data
How well the mean represents the observed data
Error
32
Slide 33
Same Mean, Different SD
33
The SD and the Shape of a Distribution
34
Consider how groups differ depending on their standard
deviation.
68% of the cases lie within one standard deviation unit of the
mean in a normal distribution.
95% of the cases lie within two standard deviation unit of the
mean in a normal distribution
99% of the cases lie within three standard deviation unit of the
mean in a normal distribution
Standard Deviation and the Normal Distribution
n
x
n
i
i
å
=
=
1
X
1063
252
121
116
108
103
98
93
57
53
40
22
1
=
+
+
+
+
+
+
+
+
+
+
=
å
=
n
i
i
x
64
.
96
11
1063
X
1
=
=
=
å
=
n
x
n
i
i
n
x
n
i
i
X
å
=
=
1
)
(
Mean
x
x
i
-
=
Deviation
å
=
-
0
)
(
X
X
å
=
-
=
20
.
5
)
(
2
X
X
SS
(
)
02
.
1
5
20
.
5
1
2
=
=
å
=
=
-
n
x
x
n
i
i
s
Chapter 7: Correlation
February 22, 2016
What is Correlation?
It is a way of measuring the extent to which two variables are
related.
It measures the pattern of responses across variables.
Measuring Relationships
Covariance
The average sum of combined deviations
It tells us by how much scores on two variables differ from their
respective means.
3
4
Variance VS. Covariance
5
Calculate the Covariance!
6
Covariance
(-0.4)(-3) + (-1.4)(-2) + (-1.4)(-1) + (0.6)(2) +
(2.6)(4)
_________________________________________
N – 1
= 1.2 + 2.8 + 1.4 + 1.2 + 10.4
________________________
4
= 17/4
Covariance = 4.25
7
Problems with Covariance
It depends upon the scales of measurement used.
E.g., the covariance of two variables measured in miles might
be 4.25 square miles, but if the same scores are converted to
km, the covariance is 11 square kilometers.
How do we FIX it?!?
8
Standardize It!
The covariance must be converted into standard set of units.
The standardized covariance is the Correlation Coefficient
9
10
Standardize It!
Pearson’s Correlation Coefficient
11
Calculate the Pearson’s Correlation Coefficient!
12
Pearson’s r
4.25
____________
(1.67)(2.92)
= 4.25
_______
4.8764
Pearson’s r = 0.87
13
Correlation Coefficients
A coefficient of:
+1 = a perfect positive relationship
-1 = a perfect negative relationship
0 = no linear relationship
14
More About Correlation
It is a measure of effect size
±.1 = small effect (0 -.24)
±.3 = medium effect (.25-.49)
±.5 = large effect (.50 – 1.00)
15
A Word of Warning:
Correlation does not imply CAUSATION!
The third-variable problem:
In any correlation, causality between two variables cannot be
assumed because there may be other measured or unmeasured
variables affecting the results.
Direction of causality:
Correlation coefficients say nothing about which variable
causes the other to change.
16
“Breaking News!”
Time Healthland: Don't Look Now, But Your TV Is Trying To
Murder You!
New York Times: Apparently, Science Says You Love Your
IPhone
CNN: Danger! Danger! Dating Spreads Drinking Among
Teenagers
Using R2 for Interpretation
Coefficient of determination, r2
A measure of the amount of variability in one variable that is
shared by the other.
E.g., correlation between exam performance and exam anxiety.
R2 tells us the amount of variance explained by exam anxiety.
18
Nonparametric Correlation
Spearman’s Rho
Pearson’s correlation on ranked data
Kendall’s Tau
Better than Spearman’s for small samples
19
(
)
(
)
(
)
1
1
2
Variance
-
-
å
-
-
å
-
=
=
N
x
x
x
x
N
x
x
i
i
i
(
)
(
)
1
)
,
(
-
-
å
-
=
N
y
y
x
x
i
i
y
x
ov
C
(
)
(
)
(
)
y
x
i
i
y
x
xy
s
s
N
y
y
x
x
s
s
Cov
r
1
-
-
å
-
=
=
March 21st , 2016
*
Allows the researcher to make generalizations from sample data
to the population from which the sample was drawn.
*
Systematic Variation
Differences in performance created by a specific experimental
manipulation.
Unsystematic Variation
Differences in performance created by unknown factors.
Age, Gender, IQ, Time of day, Measurement error etc.
Randomization
Minimizes unsystematic variation.
*
Unbiased random sample contains errors. Eliminate bias
reducing sampling error. Larger samples yield smaller sampling
errors.Precision: same results will be obtained if another
random sample were drawn from the population.
Increase sample sizeSmaller and the anticipated difference
Larger sample size
*
Small samples can identify very large differences
Consider the variables in your study
Treatment studies (new medication to reduce a
virus)Populations with very limited variability
Small samples precise resultsMore variable the population,
the larger the sample size.
Achievement ScoresIn most cases, 10-15 participants per
variable/constructLarge samples do not correct for bias.
*
Difference between population parameter and a sample statistic
What is unaccounted forEven with random sampling, there will
be some errorCan estimate the expected error and include in
statistical analysisSampling error decreases with increases in
sample size
*
Take several samples from the populationSamples will differ
slightlyEach sample will have its own meanWe can calculate the
sample mean, the average of the sample meansSamples will vary
because they contain different members of the population:
sample variationSampling distribution: diagram that shows the
frequency distribution of sample means from the same
population
*
Means: Sampling Distribution of meansCentral Limit Theorem:
sampling distributions of means will resemble the normal
curveStandard deviation of the sampling distribution: Standard
error of the mean SEM
M = 9
M = 8
M = 10
M = 11
M = 12
M = 11
M = 9
M = 10
M = 10
*
Central Limit theorem
Large samples will take the shape of a normal distribution
regardless of the shape of the population from which it is drawn
Equal to the standard deviation of the sample (s) divided by the
square root of the sample size.
*
Standard deviation of the sample mean
Remember that standard deviation a representation of how close
the observations are to the meanA large standard error means
that there is a lot of variability between the means of different
samples
The sample might not be representative of the populationA
small standard error indicates that most sample means are
similar to the population mean
Sample is likely to be an accurate reflection of the population
*
Larger the sample, the smaller the standard error of the mean.
Larger samples have greater precisionLess variability in a
population, the smaller the standard error the mean.
Less variability more precision.
*
Z-Score
Standardizing a score with respect to the other scores in the
group.
Expresses a score in terms of how many standard deviations it is
away from the mean.
The distribution of z-scores has a mean of 0 and SD = 1.
*
We can assess the accuracy of the sample mean as an estimate
of the mean in the population by calculating boundaries within
which the true value of the mean fall.
95% and 99% are the percent range for most of the confidence
intervals calculated.
A confidence interval for the mean is a range of scores
constructed such that the population mean will fall within this
range in 95% of samples
If we collect 100 samples, calculated the mean and then
calculated the confidence interval for that mean, then for 95 of
these samples the confidence interval would contain the true
value of the population mean
*
Sample means will be different form the population means due
to sampling variation.We use Z scores to calculate confidence
intervals.
Properties of Z score
As such, 95% of z-scores lie between −1.96 and 1.96.
Calculate a 95% confidence interval
99% of z-scores lie between −2.58 and 2.58
Calculate a 99% confidence interval
99.9% of them lie between −3.29 and 3.29.
*
Lower boundary of confidence interval
- (1.96 X SE)
Upper boundary of confidence interval
+ + (1.96 X SE)
Value of the mean might be influenced by sampling errors.
m=75, s=16, n=64 Sem =2.00Actual mean is called a point
estimate
95% or 99% confidence interval
95% confidence interval: We have 95% confidence that the true
population mean is between 71-79
99% confidence interval:
*
Research Hypothesis H1
Statement of the relationship the researcher seeks to find as a
result of the study
Directional or Non-directional
Null Hypothesis H0
States that there is no relationship between the variables under
study.
Assesses the probability that the results of the study were due to
chance.
Ex. There is no relationship between mathematical intervention
and mathematic achievement.
*
States the expected relationship between variables.Must be
testableShould be consistent with the existing body of
knowledgeStatement should be concise.
*
State in operational terms, the relationships that should be
observed if the research hypothesis is trueState the null
hypothesis.Gather the dataDetermine if evidence is sufficient to
accept or reject the null hypothesis
*
Rejection of research hypothesis after empirical testing does not
mean that the study was failure.Unconfirmed hypothesis are
apart of scientific research and still add to the body of
knowledgeHypothesis are never proved or disproved
*
A researcher finds the following differences in Self-Esteem
scores between boys and girls.Girls m=70.00 Boys m=80.00Do
boys have higher self-esteem or are the results due to chance
factors?
We use inferential tests to answer the question. Null
Hypothesis:
The true difference between the means (in the population is
zero)
H0: u1-u2=0
*
Symbolized by a Greek lowercase level alpha (α).Rejection of a
true null hypothesis.
States that the results of the study were not due to chance.
Researcher incorrectly concludes that significant differences
WERE found or that a relationship between the variables exists.
Considered to be more serious than Type II error.
Inferential statistics allow the researcher to estimate population
parameters based on what is known about the sample, and
sampling error
IF YOU REPLICATE the DATA 100 TIMES……
On 5 occasions we would have a see an effect., probability of
error, we would have a test statistic large enough to tell us that
there is an effect in the population. If we lower the
probability~ make alpha more stringent we increase our risk of
making a type II errorIf we take 100 samples of data from a
population in which an effect exists, we would fail to detect that
effect in 20 of these samples.
Use tests of significance
Null hypothesis is TOOL for significance testing; because you
are testing whether your results are due to chance alone, or a
real relationships among variables ( so what we do is RULE
OUT that is happened by chance alone) – THE CHANCE
EXPLANATION IS THE NULL HYPOTHESIS
You always begin statistical tests with the assumption that the
null hypothesis is true – so you reject the null or fail to reject
the null
TYPE I – reject the null, but it IS true; you say you have a
significant finding when you don’t
SAY THE NULL IS FALSE, BUT IT IS TRUE;
GENERALLY THIS IS THE MORE SERIOUS
(say guilty, but innocent)
TYPE II – accept the null but it is NOT true; say there is no
difference when really there IS a difference
SAY THE NULL IS TRUE, BUT IT IS FALSE
(say innocent, but they’re guilty)
*
Symbolized by a Greek lowercase level beta (β).Investigator
retains a false null hypothesisResearcher incorrectly concludes
that significant differences were NOT found or that a
relationship between the variables does not exist.
*
Null Hypothesis
Type I error:
reject true null hypothesisType II error:
accept false null hypothesisInnocentGuiltyNot guilty
verdictJusticeType II Error
βGuilty verdictType I Error
αJustice
*
Investigators must weigh the consequences of a Type I or Type
II error before the conducting the experiment.Level of
significance: is the level at which the null hypothesis will be
rejected.
Probability that the investigator is willing to risk in rejecting a
null hypothesis.
Most common used levels are .05 and .01
*
Type I errors can lead to changes in the educational system that
are not necessary such as:
Best practices
Curriculum modifications
Teacher training programsType II errors can lead to the lack
necessary changes being made. Maintenance of the status quo.
*
Sample Mean
6
7
8
9
10
11
12
13
14
Frequency
0
1
2
3
4
Mean = 10
SD = 1.22
N
s
X
=
s
s
X
X
z
-
=
Output: Independent Samples t-test
Group Statistics
Picture of Spider
N
Mean
Std. Deviation
Std. Error Mean
Anxiety Level
Picture of Spider
12
3.75
1.913
.552
Live Spider
12
5.50
1.784
.515
Independent Samples Test
Levene's Test for Equality of Variances
t-test for Equality of Means
F
Sig.
t
df
Sig. (2-tailed)
Mean Difference
Std. Error Difference
95% Confidence Interval of the Difference
Lower
Upper
Anxiety Level
Equal variances assumed
.038
.847
-2.318
22
.030
-1.750
.755
-3.316
-.184
Equal variances not assumed
-2.318
21.893
.030
-1.750
.755
-3.316
-.184
Hypothesis Testing/ Differences between two Means
April 4th, 2016
1
Testing The Hypothesis
State in operational terms, the relationships that should be
observed if the research hypothesis is true
State the null hypothesis.
Gather the data
Determine if evidence is sufficient to accept or reject the null
hypothesis
2
Hypothesis Testing Cont’d
Rejection of research hypothesis after empirical testing does not
mean that the study was failure.
Unconfirmed hypothesis are apart of scientific research and still
add to the body of knowledge
Hypothesis are never proved or disproved
3
Null Hypothesis
A researcher finds the following differences in Self-Esteem
scores between boys and girls.
Girls m=70.00 Boys m=80.00
Do boys have higher self-esteem or are the results due to chance
factors?
We use inferential tests to answer the question.
Null Hypothesis:
The true difference between the means (in the population is
zero)
H0: u1-u2=0
Type I Error
Symbolized by a Greek lowercase level alpha (α).
Rejection of a true null hypothesis.
States that the results of the study were not due to chance.
Researcher incorrectly concludes that significant differences
WERE found or that a relationship between the variables exists.
Considered to be more serious than Type II error.
5
Type II Error
Symbolized by a Greek lowercase level beta (β).
Investigator retains a false null hypothesis
Researcher incorrectly concludes that significant differences
were NOT found or that a relationship between the variables
does not exist.
6
The Strategy of Inferential Statistics
Null Hypothesis
Type I error:
reject true null hypothesis
Type II error:
accept false null hypothesisInnocentGuiltyNot guilty
verdictJusticeType II Error
βGuilty verdictType I Error
αJustice
7
Level of Significance
Investigators must weigh the consequences of a Type I or Type
II error before the conducting the experiment.
Level of significance: is the level at which the null hypothesis
will be rejected.
Probability that the investigator is willing to risk in rejecting a
null hypothesis.
Most common used levels are .05 and .01
.05 level, willing to be wrong 5 times in 100 in rejecting the
null hypothesis
.01 level, willing to be wrong 1 time in 100 in rejecting the null
hypothesis (rejecting the null with more confidence compared to
.05).
.001 level, willing to be wrong 1 time in 100 in rejecting the
null hypothesis.
8
Consequence of Type I and Type II Errors in Education
Type I errors can lead to changes in the educational system that
are not necessary such as:
Best practices
Curriculum modifications
Teacher training programs
Type II errors can lead to the lack necessary changes being
made. Maintenance of the status quo.
9
Rationale to the t-testt=observed difference
between sample means−expected difference
between population means
(if null hypothesis is true)estimate of the standard error of the
difference between two sample means
t-test
Dependent t-test
Compares two means based on related data.
E.g., Data from the same people measured at different times.
Data from ‘matched’ samples.
Test re-test
Independent t-test
Compares two means based on independent data
E.g., data from different groups of people
Boys vs. Girls.
13
Rational for the t-test
Two samples of data are collected and the sample means
calculated. These means might differ by either a little or a lot.
If the samples come from the same population, then we expect
their means to be roughly equal. Although it is possible for their
means to differ by chance alone, we would expect large
differences between sample means to occur very infrequently.
There is no effect and sample means in our population fluctuate
a lot and we have, by chance, collected two samples that are
atypical of the population from which they came.
The two samples come from different populations but are
typical of their respective parent population. In this scenario,
the difference between samples represents a genuine difference
between the samples (and so the null hypothesis is incorrect).
.
14
Rational for t-test
As the observed difference between the sample means gets
larger, the more confident we become that the second
explanation is correct (i.e. that the null hypothesis should be
rejected). If the null hypothesis is rejected, then we gain
confidence that the two sample means differ because of the
different experimental manipulation imposed on each sample.
15
T-test Cont’d
p<.05
t test yields a low probability that the null hypothesis is true
Researchers will reject the null hypothesis
Larger Samples=less likely that the difference between two
means is due to sampling errors.
Less sampling error, less change that the null hypothesis is
correct
Larger observed difference between means = less likely that the
difference was created by sampling errors.
T-test Cont’d
Smaller the variance among subjects: less likely the difference
between two means is due to sampling error.
Smaller the variance: more likely the null hypothesis will be
rejected
No sampling error
More variation leads to observed differences attributed to
sampling error.
Statistical Tests
t test for independent samples
t test for dependent samples
18
Assumptions of the t-test
Both the independent t-test and the dependent t-test are
parametric tests based on the normal distribution. Therefore,
they assume:
The sampling distribution is normally distributed. In the
dependent t--test this means that the sampling distribution of
the differences between scores should be normal, not the scores
themselves.
Data are measured at least at the interval level.
The independent t-test, because it is used to test different
groups of people, also assumes:
Variances in these populations are roughly equal (homogeneity
of variance).
Scores in different treatment conditions are independent
(because they come from different people).
Effect Size: Cohen’s D
Magnitude of the difference between variables
Experimental Group-Control Group/SD of Control Group
Mean for group 1 is 9 tenths of a standard deviation above the
control group or group 2.
MeanSDGroup 111010Group 210011Effect Size110-
100=1010/11=.90
When Assumptions are Broken
Dependent t-test
Mann-Whitney Test
Wilcoxon rank-sum test
Independent t-test
Wilcoxon Signed-Rank Test
SPSS
Example:
1) Independent and Dependent Sample
Spider anxiety
2). Calculate the effect size
3). Practice Exercise
Output: Independent Samples t-test
Group Statistics
Picture of Spider
N
Mean
Std. Deviation
Std. Error Mean
Anxiety Level
Picture of Spider
12
3.75
1.913
.552
Live Spider
12
5.50
1.784
.515
Independent Samples Test
Levene's Test for Equality of Variances
t-test for Equality of Means
F
Sig.
t
df
Sig. (2-tailed)
Mean Difference
Std. Error Difference
95% Confidence Interval of the Difference
Lower
Upper
Anxiety Level
Equal variances assumed
.038
.847
-2.318
22
.030
-1.750
.755
-3.316
-.184
Equal variances not assumed
-2.318
21.893
.030
-1.750
.755
-3.316
-.184
Running Head: Collaborative Leadership & Teacher
Performance 4
Collaborative Leadership & Teacher Performance
Student Name:
Institution:
Professor:
Course Title:
Date of Submission:
Introduction
This article examines the effects of collaborative leader on
teacher performance with a purpose of critically analyzing and
critiquing the effects of having collaboration between the
school leaders and the teachers performance that has far much
implication also on the student results, school name and overall
effect on the community and society the institution is serving.
A collaborative leader refers to any kind of a head who
recognizes the need for wide consultation and direct
involvement of the concerned colleagues in all matters that
affects them in the work place. He is the person who recognizes
the views, opinions, input in terms of ideas from the people
he/she is leading (Pynes, 1997). He is a person who has the
people he is leading in his heart and their values in the
organization. He believes no man is an island and he is because
the other people are there. He or she accepts positive and
constructive criticism in order to better the organization he is
heading.
Collaboration in leadership entails direct involvement of those
you are leading in decision making, planning and getting their
views and ideas. It assists in easing the burden of thinking alone
and allowing brainstorming and coming up with a solution to a
problem collectively as a group. When an idea is born through
active collaboration then it means it serves the best interests of
most if not all members of the group and results of it are sweet
fruits. In our case, the collaborative leader can be the school
head or principal who works collaboratively with fellow
teachers to ensure the success of the school (Marks, 2013).
For people to co-work and co-exist collaboratively, they need
to share common virtues and attributes and for instance, all of
them need to have a common vision that acts as guide line and
keeps them together. They also need to have common goals and
objectives that they need to achieve at the end of the exercise.
A common unity of purpose is key for all within an
organization. A successful collaborative approach has a
measurement mechanism where the leader (principal) and the
stake holders (teachers) review to see if they have achieved
their targets within the set time. If not, the loopholes that needs
to be filled and ironed to ensure success in the next trial. This
also gives them time to reflect on the run of the organization
(Goddard & Tschamen, 2007).
To ensure collaborative leadership, the principal needs to
involve the teachers directly in planning of the lessons and
time, offering alternative time to ensure complete teaching,
consulting widely during decision making as it affects the
teachers, allowing dialogue between the staff and getting their
complains and grievances collectively, offering audience to
students and parents and engaging in verbal talks on what
affects them, proper and unanimous scheduling of time to
ensure teacher satisfaction, among others. All these have a
direct relationship between teacher performance and
consequently the students and school in general.
Methodology
In order to examine the effects of collaborative leadership in
teacher performance different authors have high relied on use of
questionnaires in examining the effects of collaborative
leadership on teacher performance by sampling both schools
that have collaborative leadership and those which do not have.
They have relied on oral/verbal interviews that were conducted
on teachers in both calibers of schools with all giving almost
same views. Below were findings of the research conducted on a
sample of 480 teachers. (Gallimore, 2014)
Findings
After a thorough research on the effects of collaborative leader
on teacher performance, below where some of the results that
were assembled from the respondents:
Effects of collaborative leader on teacher performance
It assists in improving poor performing schools through extra
teacher performance
A collaborative approach between the school principal and
teachers can help in improving the grades of a poor performing
schools and that is directly related to positive performance by
teachers. This is so true for instance, if the principal realizes
that the school has been performing poorly due to adoption of
one man’s rule where all decisions are made by the principal
alone and subjected to teachers regardless of their effects. This
may not auger well with teachers and they may not feel
moralized to teach (Goddard & Tschamen, 2007).
This can well be turned around if the principal holds a dialogue
with teachers, gets their views and opinion regarding the school
management. If they have a common goal and vision to achieve,
that will act as a fabric that will unite them and they will feel
strong to work together. Since they have a target to achieve,
they will be easy to take as the teachers will realize that they
are recognized and their presence felt.
Again all this direct involvement of the teachers shows that the
principal has trust in his staff and they will work even harder to
achieve and maintain standards. A poor performing school can
improve its grades if the teachers are delivering well (Sánchez
& Schmid, 2013).
Creates job satisfaction and exemplary teacher performance
Every employee dreams of working in an environment that gives
heart satisfaction and peace of mind and teachers are not
exceptional. A collaborative approach to teaching ensures that
teachers working within that institution feel recognized and that
they contributing to the success of the school. This creates a
satisfaction and even extra performance in order to raise
standards. A calm and conducive working environment may
entail involvement of the staff in planning and decision making,
through shopping of ideas and opinions from them before
arriving in any decision. This also shows that the leader
respects the staff and they will be able to work extra mile to
ensure they maintain they status, and also possibly get retention
within a good performing school.
Excellent decision making improving teacher performance
A collaborative leader always has an easy time in decision
making and most of it is unanimously accepted by all hence less
resistance and easy implementation. Direct involvement of the
staff through their input in planning and decision making
ensures viable results as there is brain storming and exchange of
opinions and ideas (Gilbert2014) A common decision is always
reached and support is always sure so as success as the staff
feels that they are part of the goal setters hence should work
hard to ensure they achieve their target and goals as well, since
teachers feels obliged to succeed , they put extra effort hence
improvement and success of the school.
Improved teacher performance leads to student achievement
An effective collaboration between the principal and the
teaching staff has a direct positive relationship to the
performance and achievement of the students. Moralized and
focused teachers will have a reason to teach even better and the
results of their hard work will be measured by achievement of
the students during exams. Teachers will extend that
collaborative relationship to even students and reciprocated
through excellent results. Involvement of the parents also will
assist in teacher performance through the support that the
parents will offer (Manyika, 2014). The success of a school is
viewed as a collective collaboration of the school head,
teaching staff, students, parents and all the involved stake
holders. Both moral and verbal support is vital to ensure success
of an institution.
Creation and maintenance of status quo
When a principal through a collaborative approach leads to
success of a school, teachers and other stake holders are always
proud and create a good name for the school. This also gives it
a different status to which may refer it within the society.
Teachers, students, parents and the collaborative leader need to
always be reading from the same page in order to ensure
continued success and maintenance of the status quo (Manyika,
2014).
Conclusion
From the above research carried out, by the scholars, it can be
universally agreed that there is a positive relationship between a
collaborative leadership approach and its effect on teacher
performance. This consequently has a positive effect on the
student achievement and the school in general and contributes
to well-being of the society. However any negative effect of the
collaborative leadership approach on teacher performance seem
not to have been identified by the surveys carried out and hence
another extensive research can be carried out to ascertain the
extend of the same.
References
Pynes, Joan. (1997). Human Resources Management for Public
and Non-profit Organizations. San Francisco, Jossey-Bass
James Manyika. (2014). Insights & Publications. Retrieved
March 13, 2016, from A productivity perspective on the future
of growth:
http://www.mckinsey.com/insights/economic_studies/a_producti
vity_perspective_on_the_future_of_growth
Goddard R.D & Tschamen-Moran M (2007). A theoretical and
empirical investigation of teacher collaboration for school
improvement and student achievement in schools
Gallimore, R. (2014). Coach John Wooden's Pyramid of
Success: A Comparison to the Sport Psychology Literature.
International Journal Of Sports Science And Coaching, 9(1),
103-106.
Gilbert, W. (2014). Coach John Wooden's Pyramid of Success:
A Comparison to the Sport Psychology Literature. International
Journal Of Sports Science And Coaching, 9(1), 107-108.
Sánchez, C., & Schmid, A. (2013). Base of the pyramid success:
a relational view. S Asian Jnl Of Global Bus Res, 2(1), 59-81.
Reproduced with permission of the copyright owner. Further
reproduction prohibited without permission.
Gender differences among African American students in the
impact of racial id...
Kevin O Cokley
Journal of College Student Development; Sep/Oct 2001; 42, 5;
ProQuest Education Journals
pg. 480
Reproduced with permission of the copyright owner. Further
reproduction prohibited without permission.
Reproduced with permission of the copyright owner. Further
reproduction prohibited without permission.
Reproduced with permission of the copyright owner. Further
reproduction prohibited without permission.
Reproduced with permission of the copyright owner. Further
reproduction prohibited without permission.
Reproduced with permission of the copyright owner. Further
reproduction prohibited without permission.
Reproduced with permission of the copyright owner. Further
reproduction prohibited without permission.
Reproduced with permission of the copyright owner. Further
reproduction prohibited without permission.
Understanding, Connection,
and Identification
Friendship Features of Bilingual
Spanish-English Speaking Undergraduates
Anne M. Sebanc
Maria D. Hernandez
Maria Alvarado
Whittier College, CA
Bilingual undergraduates may have closer friendships with other
bilinguals
than with monolinguals. This study investigated this hypothesis
and explored
the friendship features of 46 bilingual Spanish and English
speaking under-
graduates by combining quantitative analyses of surveys and
qualitative
analyses of interviews. Survey results indicated that participants
rated their
friendships with bilinguals to be more secure, closer, and to
provide more
help and companionship than their friendships with
monolinguals. During
interviews, participants described understanding, connection,
and identifica-
tion with their bilingual friends. These features were considered
reasons for
their friendships with other bilinguals and reasons for their
greater quality.
Bilingual friendships also helped bilingual undergraduates
navigate a chal-
lenging sociopolitical context and have pride in their
ethnolinguistic identity.
Keyword: friendship; emerging adulthood; college; bilingual;
Latinos
Intimacy or emotional closeness in friendships becomes
increasingly impor-tant to emerging adults. Research confirms
that emotional closeness in both
college men’s and women’s friendship was positively related to
identity
Journal of Adolescent
Research
Volume 24 Number 2
March 2009 194-217
© 2009 Sage Publications
10.1177/0743558408329953
http://jar.sagepub.com
hosted at
http://online.sagepub.com
194
Authors’ Note: The authors appreciate all the participants who
told their stories of friendship.
We thank the reviewers, Sebastianna Maugeri, Elizabeth
Mendoza, Yesenia Ocampo, Linzi
Juliano, Jessica Barajas, Jodie Ehrlich, Kristin Friedersdorf,
Harpreet Kaur, Claudia Ramirez
Wiedeman, Jose Orozco, Rafael Chabran, and Andrew Wallis
for their assistance with this pro-
ject. Muchas gracias por todo. Portions of this article were
presented at the 2004 Society for
Research on Adolescence Meeting in Baltimore, Maryland and
the 2005 Society for Research
on Child Development in Atlanta, Georgia. The first author was
supported by the National
Science Foundation (BCS-0417286) while preparing this
manuscript. Please address corre-
spondence to Anne Sebanc, Department of Education and Child
Development, Whittier
College, 13406 Philadelphia Street, Whittier, CA 90601; e-mail:
[email protected]
at HOWARD UNIV UNDERGRAD LIBRARY on September
30, 2015jar.sagepub.comDownloaded from
http://jar.sagepub.com/
exploration and achievement (Johnson et al., 2007). In other
words, close
friendships may provide support to emerging adults’ identity
development or
those who are exploring and achieving aspects of their identity
may seek close
friends. Having support from friends in college ameliorates
stress from con-
flicts with roommates (Lepore, 1992) and contributes to
academic and psy-
chological adjustment (Hertel, 2002). One study of Latino
college students
showed that support from friends more than family contributed
to psychologi-
cal well-being (Rodriguez, Bingham Mira, Meyers, Morris, &
Cordoza, 2003).
Considerable research has shown that starting in adolescence
and continuing
throughout adulthood, individuals expect support and intimacy
from their
friends, and friendships play a particularly important role
during developmen-
tal transitions (Hartup & Stevens, 1997).
Whether friends offer support and intimacy varies across
friendships and
individuals’ perceptions of these qualitative features has been
shown to predict
psychological adjustment. Research has confirmed that positive
features
(such as companionship, intimacy, and nurturance) in college
students’
friendships are positively associated with self-esteem while
negative features
(conflict and antagonism) predict psychological problems
(Bagwell, Bender,
Andreassi, Montarello, & Muller, 2005). Many studies have
shown that
friendship quality can be reduced to two features: positive and
negative
(Berndt, 1996); although others argue for looking at individual
qualitative
features, such as validation, conflict resolution, conflict, help,
companionship,
and intimate exchange (Parker & Asher, 1993). In fact, Parker
and Asher
showed some friendship features relate more to popularity and
loneliness
than others. The current study investigates individual features
of friendships
in order to provide a richer description of friendships of
bilingual Latino
college students.
Research on friendship features has been limited by not
focusing enough
on emerging adults. We know much more about the friendship
features of
children and adolescents than adults (Hartup & Stevens, 1997).
The few
studies that have investigated qualitative features of emerging
adults’ friend-
ships are cited in this introduction. Emerging adulthood
describes the period
from late teens to late twenties when most individuals in current
industrialized
societies are still exploring aspects of their identity rather than
achieving a
stable adult identity (Arnett, 2004). Arnett (2007) has found
this period to be
less structured than adolescence or adulthood and more
heterogeneous in
terms of individual’s experiences of it. Friends, therefore, may
be particularly
important as emerging adults may need information from peers
of a similar
age who experience similar challenges rather than from family
or authority
figures who experienced a more abrupt transition to adulthood.
Sebanc et al. / Friendship Features of Bilingual Undergraduates
195
at HOWARD UNIV UNDERGRAD LIBRARY on September
30, 2015jar.sagepub.comDownloaded from
http://jar.sagepub.com/
Another limitation of friendship research in the United States is
that
researchers study White middle-class people more than people
of color.
Although several cross-cultural studies of friendships show that
friendships
vary with cultural traditions and beliefs (see Krappman, 1996
for a review),
only a few researchers have studied the friendships of ethnic
minorities in
the United States. Studies of friendship quality of ethnic
minorities have
generally focused on children and adolescents and shown that
same-race
friendships have greater intimacy than cross-race friendships
(Aboud,
Mendelson, & Purdy, 2003) and that friendship quality
increased over the
high school years for all ethnicities but Latino adolescents
reported the
highest friendship quality (Way & Greene, 2006). When
emerging adults
have been studied, they have focused on in-group/out-group
friendship
choices rather than features of their relationship (e.g., Levin,
VanLaar, &
Foote, 2006). Ethnicity should be part of the friendship
literature because
emerging adults of color warrant research in their own right but
also
because some of our assumptions about friendships have been
challenged
when people of color have been investigated. For example,
DuBois and
Hirsch (1990) showed that Black adolescents had fewer friends
at school
but more extensive neighborhood friendship networks than
Whites. In addi-
tion, the gender difference commonly found in reports of
positive friend-
ship features (girls tend to report greater intimacy and support
from friends
than boys), were not found in Black adolescents. This study
points to the
fact that broad conclusions about friendships from only White
samples can
lead to biased judgments.
Undergraduates of color may face unique challenges compared
with
White undergraduates and, therefore, require different kinds of
support from
their friends. Students of color report a variety of forms of
differential treat-
ment both in and out of the classroom during their college years
(Suarez-
Balcazar, Orellana-Damacela, Portillo, Rowan, & Andrews-
Guillen, 2003).
Research has shown that students of color have unique needs at
college
(Hertel, 2002) and that students with greater ethnic identity are
more likely
to negatively view the college environment and doubt their
persistence in
college (Castillo et al., 2006). Students of color are likely to be
exploring
aspects of their ethnic identity during emerging adulthood
(Phinney, 2006).
Finding support for this aspect of their identity and this stage in
life may be
difficult for students of color. The transition to college has been
shown to be
a period of instability in friendship because of losing old
friends and making
new ones (Bohnert, Aikins, & Edidin, 2007). Friendships with
other students
of color provide support and social integration in college that
they do not
receive from other sources (Martinez Aleman, 2000). We
similarly expected
196 Journal of Adolescent Research
at HOWARD UNIV UNDERGRAD LIBRARY on September
30, 2015jar.sagepub.comDownloaded from
http://jar.sagepub.com/
that support from similar friends would be important to the
bilingual Latino
undergraduates in this study and that some of the support would
be different
than typical friendship features more commonly studied.
The purpose of this study was to investigate the friendship
features of
bilingual English-Spanish speaking undergraduates. Because of
the limited
research on friendship features of emerging adults and college
students of
color, this research was primarily exploratory and descriptive.
Our only
working hypothesis was that friendships between bilinguals
would offer
more help, companionship, security, and closeness than
bilinguals’ friend-
ships with monolinguals. This hypothesis was based on previous
research
that adolescents have more intimacy with same-race friends than
with
cross-race friends (Aboud et al., 2003). Quantitative data was
collected to
test this hypothesis. A second goal was to further describe the
features of
friendships between bilingual Latino college students. To this
end, semi-
structured interviews were conducted and qualitative analyses
were used to
identify features of friendships that were important to
participants who self-
identified as bilingual in English and Spanish. Bilinguality is a
multidi-
mensional construct that is hard to define (Hamers & Blanc,
2000) and we
allowed all students to participate who viewed themselves as
fluent in
speaking English and Spanish. Our combination of quantitative
and quali-
tative methods allowed us to situate the findings in past
research of friend-
ship features while also hearing the voices of bilingual Latino
students
themselves as they described their friendships.
Method
Participants
A total of 46 bilingual (English and Spanish speaking)
undergraduates
(36 female, 10 male) participated. The average age was 20.6
years old and
the youngest student to participate was 18 years and the oldest
27 years.
Two nontraditionally aged students (36 and 51 years old) also
were inter-
viewed but were not included in this sample or the data analyses
because
they did not represent emerging adults or average college
students.
The majority of the participants were Latino (71.7%) or
multiracial that
includes Latino (10.9%) as self-identified in the background
survey. There
were also two African Americans (4.3%), two Whites (4.3%),
one Asian
American (2.2%), and two students who indicated other
ethnicity (4.3%). Of
the participants 42 (91.3%) of them were born in the United
States and four
Sebanc et al. / Friendship Features of Bilingual Undergraduates
197
at HOWARD UNIV UNDERGRAD LIBRARY on September
30, 2015jar.sagepub.comDownloaded from
http://jar.sagepub.com/
participants were born in another country (8.7%).The majority
of participants
(58.7%) indicated that their parents had immigrated to the
United States, as
opposed to themselves (6.5%), their grandparents (10.9%), and
their great
grandparents (19.6%). Two of the students were international
students who did
not plan on becoming U.S. citizens and therefore did not answer
the immi-
gration status question. Mexico was the most common
birthplace of parents
(47.8% of mothers, 39.1% of fathers), followed by the United
States (39.2%
of mothers, 32.6% of fathers), and El Salvador (4.3% of mothers
and fathers).
Other Hispanic countries (e.g., Cuba or Guatemala) were only
represented by
one participant’s parent(s) each. Surprisingly, several non-
Hispanic countries
were birthplaces of participant’s parents (Romania, South
Africa, and
Thailand). This sometimes was due to mixed nationality and
other times due
to non-Latino participants, because of their fluent English and
Spanish speak-
ing. Parents’ and participants’ country of origin will be noted in
the results sec-
tion when it is not the United States or Mexico.
All undergraduates attended a small residential liberal arts
college in
Southern California that is a Hispanic-serving institution.
Latinos repre-
sented 26.3% of the approximately 1,200 students enrolled
during the two
semesters when interviews were conducted. Students were
primarily
recruited in child development and Spanish classes by
undergraduate
research assistants making an announcement and circulating a
sign-up sheet.
Bilingual undergraduate research assistants sometimes made
announce-
ments in their own nonrelated classes if their professors
allowed. Several
signs about the study, with a phone number and e-mail were
posted around
campus. Students were also told in the class or by the sign that
they would
receive a wooden token for a free soda at the restaurant on
campus as an
incentive for participating. The majority of participants came
from direct in-
class recruitment or word of mouth (a friend participated and
recommended)
and not through flyers. The assistants asked if they spoke
Spanish and con-
sidered themselves bilingual in Spanish and English. If they
answered yes,
they placed their name, phone number, and e-mail on the sign-
up sheet. If
students asked what was considered bilingual, we told them that
they con-
sidered themselves fluent in English and Spanish.
Procedure
Undergraduate researchers contacted bilingual participants and
sched-
uled an appointment at a time when the participants had an hour
to an hour
and a half free. The interviews were conducted around campus
at the par-
ticipants’ convenience and in places of relative privacy.
Participants were
198 Journal of Adolescent Research
at HOWARD UNIV UNDERGRAD LIBRARY on September
30, 2015jar.sagepub.comDownloaded from
http://jar.sagepub.com/
given a background survey first that asked about their country
of origin,
family background, language skills in English and Spanish, and
the number
of bilingual and monolingual friends. Undergraduate researchers
then
began the semistructured interview about their friendships that
was audio-
taped. After the interview, participants completed the
Friendship Qualities
Scale (FQS; Bukowski, Hoza, & Boivin, 1994) on their closest
bilingual
and monolingual friends.
Measures
Background survey. The background survey asked 22 questions
about
participants’ ethnicity, country of origin, family’s country of
origin, immi-
gration status, and language fluency. After indicating their age
and gender,
participants identified their ethnicity by writing in their own
description on
a blank line. This information was used to describe the
participants in the
previous section by categorizing answers according to U.S.
Census cate-
gories for Hispanic (Latino), African American, Asian
American, White, or
mixed race. Participants circled whether they were born
somewhere else, or
their parents, grandparents, or great-grandparents were born
somewhere
else and they were born in the United States. Answers to this
question were
used to indicate immigration status by rating the first as 1 (first
generation
American) and parents as 2, grandparents 3, and great
grandparents 4. The
mean for immigration status was 2.45 with a standard deviation
of 0.90.
They also answered “How many of your friends are bilingual?”
and
“How many of your friends are monolingual in English?” using
a 5-point
scale: none (0), a few (1), some (2), most (3), and all (4).
Number of bilin-
gual friends (M = 2.4, SD = 0.86) and number of monolingual
friends (M =
2.1, SD = 0.89) were created from those answers. Finally,
participants were
asked to indicate their level of English and Spanish fluency on
five tasks
(speaking, reading, writing, conversation, and formal speech) on
a 4 point
scale (1 = not at all, 2 = with considerable effort, 3 = somewhat,
and 4 =
easily; see Table 1 for descriptive statistics). Because these
measures were
largely correlated with each other (.65 to .97 within each
language), they
were submitted to a principal components analysis with a
varimax rotation
and produced two factors: English fluency and Spanish fluency.
Eigenvalues were greater than 2.5.
Semistructured interview. The interview consisted of a series of
35 ques-
tions in English (see Appendix A). The questions on the
interview were
developed after a focus group with six Latina students was
conducted by
Sebanc et al. / Friendship Features of Bilingual Undergraduates
199
at HOWARD UNIV UNDERGRAD LIBRARY on September
30, 2015jar.sagepub.comDownloaded from
http://jar.sagepub.com/
200 Journal of Adolescent Research
the authors. Two of the pilot participants also participated in
the current
study. After meeting with pilot students, all questions of
interest were given
to three Latino/a faculty at the college and asked for feedback
on the ques-
tions. The final interview asked about social interactions (and
participation
in Spanish language activities), friendships in general,
differences between
bilingual and monolingual friendships, and about their closest
bilingual
friend in particular (see Appendix A). Although the interview
was fairly
structured, research assistants asked follow-up questions and
engaged in
some conversation with the participants.
The audiotapes of the interviews were transcribed by
undergraduate
assistants. The second author, an undergraduate researcher at
the time, read
and corrected all transcripts while listening to the interviews
and completed
the transcription of one where the participant answered several
questions in
Spanish. The Spanish in that transcript was then translated back
into English
by a modern language professor at Whittier College. The first
author then
read all transcripts, taking notes for common themes,
particularly about
friendship features, using a phenomenological approach. Several
themes
came up over and over again and were listed in a notebook.
Anytime an
interviewee discussed a more traditional friendship feature was
also tracked.
The themes seemed to cluster into the reasons for bilingual
friendships or
why they offered more support than their friendships with
monolinguals.
After the first and second author discussed the themes, we
labeled them as
follows: understanding/entendimiento, connection/conexión,
and identifica-
tion/identificacion.
The first author then read all transcripts again to find examples
of these
three additional features of bilingual friendships. Friendship
features were
mainly discussed by participants in answer to the following four
questions:
Table 1
Means (Standard Deviations) for English and
Spanish Fluency Questions
Mean for English (SD) Mean for Spanish (SD)
Speak fluently 3.9 (0.63) 3.4 (0.81)
Read college textbooks 3.8 (0.63) 2.8 (1.03)
Write college papers 3.8 (0.70) 2.4 (1.10)
Complete conversation 3.8 (0.63) 3.3 (0.85)
Formal speech to high 3.8 (0.65) 2.8 (1.1)
school students
at HOWARD UNIV UNDERGRAD LIBRARY on September
30, 2015jar.sagepub.comDownloaded from
http://jar.sagepub.com/
(10) Does the quality of your friendship with bilinguals differ
from your
friendships with monolinguals? How?, (16) Does it help you to
have bilin-
gual friends? How?, (19) After discussing your bilingual
friendships, why
do you think you have bilingual friends?, and (30) Does being
bilingual
affect the intimacy of your (closest bilingual) friendship? In
what way? The
entire interview, however, was read for relevant data and
friendship features
were noted at any point during the interview. While reading the
interviews
a second time, another theme emerged that was only
tangentially related to
friendship features. Several students discussed the
sociopolitical conditions
that affected their friendships (in most cases made them seek
friendships
with other bilinguals). Examples of answers that related to
discrimination
or particular social pressures of bilingual Latinos were noted
and will be
discussed in the last section of the results, Sociopolitical
Context.
Participants were given a pseudonym in the results keeping the
same name
throughout if they are quoted more than once.
Friendship Quality Scale (FQS). Participants answered 39
questions
from the FQS (Bukowski et al., 1994) about their closest current
bilingual
and monolingual friendships. At the top they were asked to
chose their clos-
est current bilingual and monolingual friendships and place
their names at
the top. Each item was only repeated once next to two scales
(numbers 1 to
5 under the names of their closest friends). The FQS measures
five aspects
of friendship quality: closeness, security, help, companionship,
and con-
flict. Means were created for each of these variables for the
closest bilin-
gual friend and monolingual friend.
Missing Data
Two students’ interviews could not be transcribed because the
tapes were
defective. Their results are included in the quantitative analyses
of the friend-
ship quality questionnaire. One student did not complete the
background survey
or friendship quality questionnaire because of time constraints.
His information
is included in the qualitative analyses of the interviews only.
Results
Quantitative analyses are presented first in the discussion of
friendship
features and their correlates. Qualitative analyses follow in
discussion of
three additional friendship features or reasons why bilingual
friendships
Sebanc et al. / Friendship Features of Bilingual Undergraduates
201
at HOWARD UNIV UNDERGRAD LIBRARY on September
30, 2015jar.sagepub.comDownloaded from
http://jar.sagepub.com/
202 Journal of Adolescent Research
were important to those interviewed. One further qualitative
analysis provided
information about the particular sociopolitical context of these
friendships.
Quantitative Analyses: Friendship
Features and Their Correlates
Paired sample t tests were conducted to determine whether there
was a
difference between participants’ closest bilingual and
monolingual friends
on the five features in the FQS. Bilingual students reported
greater com-
panionship, security, help, and closeness with their closest
bilingual friend
compared with their closest monolingual friend (see Table 2).
There was no
significant difference between friends based on conflict.
Correlations among friendship features with monolingual and
bilingual
friends were largely significant, indicating that the way
individuals scored
friendship features of their bilingual friend was related to the
way they
reported friendship features of their monolingual friend.
Conflict, close-
ness, help, and security with bilingual were all significantly
correlated with
the same friendship feature with monolinguals (see Table 2).
These two sets
of results show that participants may rate their closest bilingual
friend
higher than their closest monolingual friend but the scale the
participants
use for each friendship feature is similar (compared with other
partici-
pants). In other words, rank order of participants on each
friendship feature
Table 2
Comparison Between Closest Bilingual and
Monolingual Friends: Means (Standard Deviations), Paired
t Tests, and Correlations for Friendship Qualities Scale
Closest Closest Correlation
Bilingual Monolingual Between
Friend Friend Paired Bilingual and
Features Mean (SD) Mean (SD) t Test Monolingual
Closeness 4.48 (0.60) 4.08 (0.80) 3.63*** .47***
Companionship 4.11 (0.87) 3.46 (0.98) 3.68*** .17
Security 4.52 (0.58) 4.23 (0.71) 2.61* .36*
Help 4.50 (0.60) 4.24 (0.73) 2.67* .50***
Conflict 2.00 (1.01) 1.95 (0.93) 0.47 .64***
Note: n = 45.
*p < .05. **p < .01. ***p < .001.
at HOWARD UNIV UNDERGRAD LIBRARY on September
30, 2015jar.sagepub.comDownloaded from
http://jar.sagepub.com/
Sebanc et al. / Friendship Features of Bilingual Undergraduates
203
is similar for both friendships. The correlation for conflict (r =
.64), however,
may be exaggerated as conflict was rated low by practically all
participants,
therefore there was a limited range of answers.
Additional correlations were conducted to determine whether
partici-
pants’ background characteristics (English fluency, Spanish
fluency,
number of bilingual friends, number of monolingual English-
speaking
friends, and immigration status) were related to the friendship
features
(with bilingual or monolingual friends). First, background
characteristics
were correlated with each other. Spanish fluency was negatively
related to
number of monolingual English friends (r(46) = −.35; p < .05)
and immi-
gration status (r(46) = −.54; p < .001). Participants who were
first or sec-
ond generation U.S. citizens rated their Spanish fluency as
higher but the
number of English-only speaking friends lower than those who
were third
or fourth generation. No other background characteristics were
signifi-
cantly related to each other.
Background characteristics were correlated with the friendship
features
(see Table 3). Spanish fluency was related negatively to
bilingual conflict
Table 3
Correlations Between Background Characteristics
and Friendship Features
Number of Number of
Spanish English Immigration Bilingual Monolingual
Fluency Fluency Statusa Friends Friends
Bilingual friendship
features
Closeness −.10 −.09 −.02 .30* .02
Companionship −.04 .06 −.06 .48*** −.19
Security −.08 −.09 −.03 .35* −.05
Help −.16 −.15 −.08 .44** −.08
Conflict −.39** .05 .20 −.04 .14
Monolingual
friendship features
Closeness −.14 −.15 .26+ −.22 .40**
Companionship −.18 −.04 .43** −.20 .41**
Security −.10 −.14 .15 −.31* .45**
Help −.09 −.17 .05 −.19 .30*
Conflict −.29+ .07 .30* −.10 .23
a. n = 44 except for immigration status where n = 43.
+p < .10. *p < .05. **p < .01. ***p < .001.
at HOWARD UNIV UNDERGRAD LIBRARY on September
30, 2015jar.sagepub.comDownloaded from
http://jar.sagepub.com/
with friends and there was a trend that it was related to
monolingual con-
flict as well. English fluency was not significantly related to
any friendship
feature. Immigration status was related positively to
companionship and
conflict in monolingual friendships. This result indicates that
the longer
their family lived in America, the greater companionship and
conflict par-
ticipants had with monolingual friends. Number of bilingual
friends was
related positively to companionship, help, security, and
closeness with
bilingual friends and negatively to security with monolingual
friends.
Similarly, number of monolingual friends was related positively
to com-
panionship, help, security, and closeness with monolingual
friends but not
to bilingual friendship quality.
Qualitative Analyses: Three Additional
Features of Bilingual Friendship
The majority of bilingual Spanish-English speakers interviewed
reported
positive features of their friendships with other bilinguals and
greater impor-
tance of having bilingual Latino friends. The participants
discussed features in
their friendships that were not described in traditional
friendship quality
scales. These three features we called understanding,
connection, and identi-
fication. These features had more to do with what their
similarities meant for
their relationship or why they sought friendships with other
bilinguals. Each
feature will be discussed separately in the results although they
are obviously
interconnected. We also discuss more traditional features that
were brought up
by the participants that support the results of the quantitative
data throughout
these sections.
Understanding/Entendimiento. “How would that [being
bilingual] help
the friendship? Just because that person can relate and
understand what I
am saying.” (Melissa)
Not surprisingly, many students discussed their bilingual
friends under-
standing the languages they spoke, both English and Spanish, as
a great
advantage to those relationships. This provision of friendship,
we called
“understanding” in order to include two ideas commonly
considered a ben-
efit of bilingual relationships: (a) being able to use both
languages with
each other and (b) not having to translate thoughts and feelings.
The second
aspect of understanding went beyond the literal knowledge of
two lan-
guages and also applied to their friends knowing where they
came from and
their background. Bilingual friends did not require explanations
and trans-
lations as monolingual friends did. Understanding by their
bilingual friends
204 Journal of Adolescent Research
at HOWARD UNIV UNDERGRAD LIBRARY on September
30, 2015jar.sagepub.comDownloaded from
http://jar.sagepub.com/
contributed to the closeness of these friendships, especially
through intimacy
and sharing.
A large benefit of having a bilingual friend was not having to
translate
for the friend. Many expressed that the right word was often
found in
Spanish and could not be translated to English. Jose was asked
when he
spoke Spanish with his friends, “When there’s, like, something
you can’t
really say in English, like, it doesn’t make sense, but then in
Spanish, it
makes sense.” In response to the same question, Maria
explained,
’Cause in Spanish there is like a lot of dichos, like sayings, that
I don’t, I have
never heard a translation of that in English. See and if
sometimes, if I want
to get my point across and, like, you think of something you
heard in your
upbringing, that would be a time [we speak Spanish] . . .
Because you can’t
translate everything word for word, because it loses it’s
meaning.
Being able to use their primary language with friends assured
that they
could impart exactly what they meant to their friends.
Translation was often
viewed as something that got in the way of closeness with
friends who did
not speak Spanish.
Speaking Spanish led to more intimacy with their bilingual
friends
because it involved discussing more emotions than speaking
English. Javier
said, “My own personal history is revealed when I do speak in
Spanish. You
know, when I speak about being younger, uh, I just happen to
speak it in
Spanish.” Spanish is often their primary language and therefore
is both the
first language they spoke as well as the main language spoken at
home with
their families. Certain topics, therefore, may be reserved for
only one lan-
guage, Spanish. One Cuban student, Vanessa, put it this way,
It seems easier to communicate a lot of feelings. And, I don’t
know, if that
maybe the vocab. is larger or there’s just more words in
Spanish. It seems that
words in Spanish are a lot more expressive so I guess I could
express more
to my friends that speak Spanish
Greater intimacy with bilingual friends was often reported
because
students could express more feelings and memories in Spanish.
Interestingly, most students discussed how important it was that
their
friends speak Spanish and not that they also speak English.
Almost all par-
ticipants said they used English more often than Spanish with
their friends.
Even though they spoke Spanish less frequently, the ability to
code switch
and say exactly what they wanted to made these friendships
closer and
more intimate than their friendships with monolinguals. Not all
participants
Sebanc et al. / Friendship Features of Bilingual Undergraduates
205
at HOWARD UNIV UNDERGRAD LIBRARY on September
30, 2015jar.sagepub.comDownloaded from
http://jar.sagepub.com/
206 Journal of Adolescent Research
discussed how sharing Spanish led to more intimacy like the
examples
above. Nonetheless, they described topics they discussed with
their friends
that may increase closeness. For instance, Karen, who is
actually Asian and
speaks Spanish because a Latino family raised her, said,
I can speak to them in the language that we share. We can do
like those inside
jokes like when only that person and I speak Spanish, no one
else. We can
talk about those other people in Spanish [giggles]
Like this student, most students reported both joking and
gossiping in
Spanish with bilingual friends. Both these activities may
increase intimacy
of these friendships.
Connection/Conexión. “It’s just having a connection with
somebody if
they speak . . . Spanish, they have a tradition behind them. It’s
like their
parents are strong. They are raised kind of in the same way you
were, with
a lot of similarities.” (Juan)
The sense of similarity and connection within bilingual
friendships res-
onated through most participants’ interviews. The two types of
connection
that seemed most important to participants, as the above quote
demon-
strates, were family and culture. This section will focus on
connection to
family in its many meanings: bilingual friends became like
family, they
participated in family activities, their families liked each other,
and they
had a greater sense of similarity because their families were
alike. We will
also discuss how this sense of connection leads to other
friendship features
such as help and companionship. Culture will be discussed more
in the
next section on identification but we will touch on it here as it
is tied to
family and the activities that they share.
Connection was often understood in familial or relatedness
terms. Some
students used fictive kin terms for their bilingual friends. A few
students
mentioned that their bilingual friends were like siblings or
cousins. This was
in addition to having more connection to each other’s family
because of their
ability to speak Spanish with them. Olivia showed how
relatedness would
not apply to her monolingual friends. “Well, monolinguals are
dear to me
too. Like, I care for them. But, they’re not, like, they wouldn’t
be like my
sister.” Other students used the concept “relating better” to
explain why they
had bilingual friends. “[My friends being bilingual] makes me
feel comfortable
with them, being more open. That they are part of my culture
and an aspect,
that I can, there’s something I can relate to them, like that
special tie,”
explained Gina. Many other participants also discussed how
relating better
to their bilingual friends led to more comfort in those
relationships.
at HOWARD UNIV UNDERGRAD LIBRARY on September
30, 2015jar.sagepub.comDownloaded from
http://jar.sagepub.com/
Sebanc et al. / Friendship Features of Bilingual Undergraduates
207
Another aspect of connection was that having bilingual friends
allowed
students to connect their peer network and their family. Vanessa
reported “I
could do more family related things with my bilingual friends
’cause they
come from similar cultures so they could understand that we are
more fam-
ily centered so we could visit with each other’s families more.”
Family
activities were still seen as important to these bilingual Latino
undergradu-
ates. Olivia put it this way.
I open a lot more to bilingual people because they could talk to
my mom. So,
like, my mom is really special to me, so if you can talk to my
mom, of course,
you’re gonna be close to me.
The importance of family to these Latino students was clear in
most
interviews. These students wanted to involve their parents in
their activities
and felt language barriers with monolingual friends and the
college context.
Their bilingual friends also became better companions for them
because
they participated in more activities together.
Feelings of connection also seemed to lead to more typically
studied
positive friendship features such as stability, help, and support.
Cindy,
whose parents are from El Salvador, said,
I’ve noticed that my bilingual friends that I had, I’ve had for
years and years
and years. And my monolingual friends, it usually doesn’t last
very long. I
don’t know why. I never really thought about it until today. Um,
I just hap-
pen to have more friends that are bilingual just ‘cause of that
similarity
between us, I guess.
The fact that these relationships last longer may attest to their
positive
features. Several students described how bilingual friends help
them. Susan
described the support she receives from bilingual friends, “they
know how
to relate to me so it just helps. It gives you peace of mind to
know there’s
people like you.” Help and support were commonly mentioned
as some-
thing that bilingual students received more from their bilingual
friends than
monolingual friends. Very few discussed direct aid except with
Spanish
classes or sometimes college classes in general. Most students
discussed
indirect aid through supportive feelings or their friends “being
there” for
them when they were needed.
Identification/Identificación. “I got to have that trust and that
understand-
ing. Like, you know what, you care about other people’s
cultural linguistic
identity. And so to me, that all comes back to identity and you
know who we
really identify with.” (Javier)
at HOWARD UNIV UNDERGRAD LIBRARY on September
30, 2015jar.sagepub.comDownloaded from
http://jar.sagepub.com/
Although only a few students directly mentioned identification
or iden-
tity in relation to their friendships, many discussed aspects of
their identity
and how other bilinguals affirmed them. In this section, we
focus mostly on
bilingual students’ cultural and linguistic identity. These themes
emerged in
both understanding and connection but we focus on them here.
This section
discusses how bilingual friendships were important to them as
an individ-
ual, especially in relation to their identity development and
cultural pride,
rather than to their relationship.
Bilingual friends attended important cultural activities with our
partici-
pants. Rocio said that her bilingual friends could go,
To los bailes, you know dancing to the kind of music that you
listen to, or just
going to any festivals, like maybe they have festivals at church
or maybe like
events that we go to. Posadas [Traditional Christmas events] or,
like, stuff
like that.
Many students reported that there were cultural events or even
types of
night clubs that they would take their bilingual friends and not
their mono-
lingual friends. Bilingual friends, therefore, provided more
companionship
because they went with them to these events. Furthermore, these
events
were important because they gave our participants a sense of
pride in their
ethnolinguistic identity.
Others discussed that it was their friends that brought out their
cultural
pride and speaking of Spanish. Many students mentioned that
bilingual
friends protected them from losing Spanish. Susan, in
particular, was led by
her closest bilingual friend to speak Spanish. “If anything, she
is the one
that pushes me to speak more Spanish. Yeah, she calls me a
‘gringa’ and
says I need to learn more Spanish.” She goes on to discuss how
this friend
has led her to partake in more traditional cultural activities.
She’s more comfortable in, like, like, going to places where
they play, like,
Ranchero music where I wouldn’t feel that comfortable. Like,
she, she’ll take
me there, . . . I say ‘Oh, you’re more Mexican than me’ . . .
well, no, I’m not
saying that I’m not Mexican [laughing] but, like, she’s kind of
more in tune
with her culture than I am.
By speaking Spanish and attending more traditional Mexican
activities,
this friend seemed to be invigorating her friend’s cultural
identity. This
shows the mutual socialization of friends; friends are directly
affecting each
other’s ethnolinguistic identity.
208 Journal of Adolescent Research
at HOWARD UNIV UNDERGRAD LIBRARY on September
30, 2015jar.sagepub.comDownloaded from
http://jar.sagepub.com/
Sociopolitical Context
The broader context, including social, political, and cultural,
was men-
tioned by participants as something that made their friendships
important,
motivated them to seek bilingual friends, and threatened their
ethnic pride.
The college environment to some was less Latino-friendly than
their old
hometown while for others there was more access to bilingual
peers.
Several discussed political and social pressures to speak
Spanish with other
Latinos but not have a Mexican accent around Whites. There
was a sense of
being pulled between two identities: Mexican (or other Latino
country) and
American. A few explicitly discussed how the majority culture
in the
United States did not support their ethnolinguistic identity.
Again, bilingual
friends were seen as helpful with these challenges.
Participants varied in whether they viewed the college as
friendly to
Spanish speakers. Rachel shared that having bilingual friends,
“helps me
practice my Spanish because, I mean here in Whittier you rarely
speak
Spanish. Yeah. I find myself making up words that don’t exist
in Spanish
and my mom gets mad at me for doing that.” College in the
United States
is dominated by English and, perhaps, students adopt an
increased use of
English in this context.
Others had the opposite experience in that where they came
from had
fewer Spanish speakers than Whittier College which is a
Hispanic serving
institution. Monica, whose Dad is from Puerto Rico and who
grew up in
Colorado, said this about being friends with more bilinguals in
college,
It helps me like, look at parts of my culture that I didn’t look at
before. In
Colorado, it’s just, people call me coconut sometimes because,
like, I am
brown outside and White in the inside. ‘Cause over there
everybody is just,
like, um, no-nobody speaks Spanish.
The diversity of our participants showed that not everyone
perceived the
same sociopolitical context on campus.
The larger sociopolitical context of the United States was
brought up by
a few students directly. Several participants discussed being
looked down on
by the majority Whites and more-acculturated Latinos for
speaking Spanish.
Olivia commented on having a Mexican accent, “Like yeah, a
Spaniard
accent, you’re considered elite but if you have a Mexcian
accent, you’re like
uneducated . . . so I think there’s that stigma that we kind of
have to go
above.” Being called coconut or gringa by Latinas as previously
mentioned
can be seen as the opposite side of the conflict. Many expressed
fear of losing
Spanish and the threat to their language may be real especially
in California
Sebanc et al. / Friendship Features of Bilingual Undergraduates
209
at HOWARD UNIV UNDERGRAD LIBRARY on September
30, 2015jar.sagepub.comDownloaded from
http://jar.sagepub.com/
considering bilingual education was removed from schools.
Clearly, there
are pressures from acculturated Americans to speak English
without a
Mexican accent and pressures from fellow Latinos to retain
their cultural
and linguistic heritage. The Latino college students in our
sample seem to be
wedged in this gap and some of them felt the pressure.
Others discussed discrimination that bilingual Latinos face in
America
explicitly. Javier, a particularly politically active student,
discussed why he
relates better to bilinguals, “By knowing more bilingual people
I under-
stand what discrimination they have gone through or what kind
of ordeals
they have gone through that are maybe different than mine but
at the same
time very similar.” When talking about joking in English, he
said,
We try to seek humor to you know comfort our wounds with
like living in a
racist institution . . . So I mean if our joke is in English, but at
the same time
it is used as a way of critiquing and very much critiquing like
you know the
English dominancy but also we also joke in Spanish and you
know like, we
just, we think jokes are good in any language.
This student clearly articulates perceptions of racism in his
sociopoliti-
cal context. He also uses humor with friends to cope or turn his
status into
strength. In other students’ interviews, there were many hints
that students
felt a clash between being Latino or speaking Spanish and being
American.
Their bilingual friends probably felt this clash too or at least
were in the
same situation.
Discussion
The quantitative findings clearly show that bilingual students
view their
friendships with bilingual friends as more positive than with
monolingual
friends. The quantitative findings were confirmed and extended
by the qual-
itative findings. During interviews, bilingual students discussed
positive fea-
tures of bilingual friendships but these included features of
friendships not
commonly studied by friendship researchers. Understanding,
connection,
and identification were often mentioned as reasons for
friendships with other
bilinguals and why those friendships offer more support than
friendships
with monolinguals. These findings can encourage friendship
researchers to
consider other features of friendships than those most
commonly studied.
Closeness, security, help, and companionship were all reported
as
greater in friendships with another bilingual than with a
monolingual. This
210 Journal of Adolescent Research
at HOWARD UNIV UNDERGRAD LIBRARY on September
30, 2015jar.sagepub.comDownloaded from
http://jar.sagepub.com/
was true in spite of the fact that their friendship perceptions
were highly
related to each other. In other words, if a participant viewed
their closest
bilingual friend high on security than she viewed her closest
monolingual
friend similarly. Conflict did not differ between bilingual
friendships and
monolingual friendship but was related to less Spanish fluency.
Participants
who believed they were highly fluent in Spanish were also more
likely to
have an earlier immigration status (first or second) and had a
lower number
of monolingual English speaking friends. These participants
may represent
less acculturated students who do not identify with the conflict
questions in
the FQS or do not fight with friends. The number of bilingual
and mono-
lingual friends was strongly related to positive features. The
more friend-
ships participants had with bilinguals, the greater they rated
their closeness,
help, security, and companionship with bilinguals; the same was
true with
number of friendships with monolinguals and monolingual
friendship qual-
ity. Perceptions about the number of friendships with a similar
or different
peer may reflect quality and satisfaction with those friendships
and not sim-
ply number of friends they have.
During the interview, participants clearly voiced the importance
of find-
ing similar friends, in this case, linguistically (and usually
ethnically) simi-
lar. Sharing Spanish with friends was particularly important to
our bilingual
participants. First, sharing their primary language aided in their
friends’
understanding of them both linguistically and emotionally.
Second, sharing
Spanish and a similar cultural background also helped students
connect their
friends with their family. Desiring connection between friends
and family is
a component of friendships that researchers probably miss when
studying
White middle class participants with a more individualized
sense of identity.
Other research has shown that connection to family can be as
important as
individuation for some college students, especially women
(Kenny &
Donaldson, 1991). Latino students similarly may want to
maintain close
family ties while also increasing their autonomy in ways that
promote their
culture’s more familial or collectivist values (Phinney, 2006).
The emphasis
on connection for our participants may be because of their
Latino culture or
the preponderance of female participants in our sample.
Identifying with their friends was one of the main reasons
participants
reported having or preferring bilingual friends. When they
discussed iden-
tifying with their friends, it was often in terms of the way their
cultural or
linguistic identity was affected by their friends. Students
discussed mutual
socialization as part of their friendship experiences. Some
friends encouraged
participants to attend more traditional Latino cultural events
and others
encouraged them to shop at mainstream American stores. Most
encouraged
Sebanc et al. / Friendship Features of Bilingual Undergraduates
211
at HOWARD UNIV UNDERGRAD LIBRARY on September
30, 2015jar.sagepub.comDownloaded from
http://jar.sagepub.com/
212 Journal of Adolescent Research
them to retain their Spanish speaking abilities. Similarity
between friends,
therefore, was likely to increase over time and not just be a part
of friend-
ship selection. Friendships between those who have similar
cultural back-
grounds may be particularly important during emerging
adulthood. This
developmental stage has been theorized to be dominated by
identity explo-
ration, instability, self-focus, feeling in-between, and
possibilities (Arnett,
2007). We see that most, though not all, bilingual college
students
attempted to incorporate ethnolinguistic pride into their identity
and that
their friendships with other bilinguals helped them with that
goal.
In some ways, friendships can be seen as a context for cultural
trans-
mission and not just a product of the cultural context. The
friends in this
study mentioned identifying with their friends as well as being
influenced
by them. Friendships are an interesting context to study cultural
transmis-
sion because they are outside other societal institutions, such as
family and
work, and yet an institution themselves governed by cultural
values
(Krappman, 1996). Some of our participants sought to maintain
the lan-
guage their families speak because they viewed the
sociopolitical context as
hostile and that their identity was at risk in the United States or
in college.
By establishing friendships with similar peers, bilingual Latino
students
may be creating a space that fills the gap between their family’s
culture and
mainstream White culture. This may partly explain why those
with more
bilingual friends had greater friendship quality with their
closest bilingual
friend. The effects are likely to be bidirectional: choosing more
bilingual
friends may reinforce the importance of their bilinguality for
friendship and
vice versa. Friendships among people of color may in part
socialize each
other to have ethnic pride or prepare them for bias and
discrimination in
ways that have been found with Latino and African American
parents
(Hughes, 2003). Although there is some research about the
influence of
children’s friends on racial attitudes (e.g., Aboud & Doyle,
1996), the ways
friends directly teach each other about discrimination and ethnic
pride merits
further study.
Looking at a particular group of bilingual college students
allows us to
see both the diversity and similarity of friendship experiences.
The three
themes of understanding, connection, and identification
represent the
majority of participants’ answers; however, not all discussed
these three
themes. A small minority of participants said their friendships
with mono-
lingual and bilingual friends were of equal quality or that
linguistic identity
was not important to their friendships. These students may be
more accul-
turated than the rest of the bilingual students in our study.
Diversity was
at HOWARD UNIV UNDERGRAD LIBRARY on September
30, 2015jar.sagepub.comDownloaded from
http://jar.sagepub.com/
Sebanc et al. / Friendship Features of Bilingual Undergraduates
213
also seen in who brought up the sociopolitical context directly.
Some par-
ticipants discussed the sociopolitical context explicitly and
those who did
expressed feelings of frustration, discrimination, and bicultural
stress.
Perhaps these students experienced more discrimination or had
more
awareness of potential threats to their ethnolinguistic identity.
Straddling
same-ethnic peer groups and school environments at the same
time has
been shown to be a successful coping mechanism for Latino
students
(Carter, 2006). The participants who did not discuss bicultural
stress or dis-
crimination may be successfully straddling mainstream White
American
and their family’s cultures or may not be exploring their ethnic
identity dur-
ing emerging adulthood.
Our conclusions are tempered by the fact that our interview was
designed to ask students about the features of their friendships.
We did not
ask direct questions about their feelings of discrimination on
campus or in
society. The fact that these issues sometimes came up may mean
that they
were an important aspect of these friendships and the
sociopolitical context
was affecting these relationships. In addition, the interview
seemed to lead
students to discuss the positive features rather than the negative
features of
their friendships. Although one question about negative aspects
of having
bilingual friendships was asked, few ever discussed specific
ways that it
was negative. Another limitation of the present study is that we
used a con-
venience sample of college students who volunteered for a small
incentive.
These students may not represent all bilingual college students
and cer-
tainly do not represent all emerging adults because many do not
attend col-
lege. Phinney (2006) posits that ethnic minorities who do not
attend college
may not explore their ethnic identity or may be less likely to
experience the
stage of emerging adulthood. Our sample size was also small by
quantita-
tive standards and therefore, we may not have an accurate
representation of
Latino college students.
The way we selected participants was also potentially biased
because we
recruited participants who identified themselves as bilingual.
Participants
rated themselves as largely fluent in speaking English and
Spanish but only
somewhat fluent in college level writing, reading, and formal
presentations
in Spanish. On average, our bilingual participants showed
“dominant bilin-
guality” or greater competence in one language over another
(Hamers &
Blanc, 2000). Our descriptive statistics clearly show a range in
fluency,
especially in Spanish skills, and therefore, we cannot be sure to
what degree
our participants represent typical bilingual undergraduates.
Also, because we
recruited for bilingual status, participants did not have to
identify themselves
at HOWARD UNIV UNDERGRAD LIBRARY on September
30, 2015jar.sagepub.comDownloaded from
http://jar.sagepub.com/
as Latino. We saw greater diversity of the sample and their
friends than we
were expecting. Several participants were not Latino but only
one of those
was quoted in the qualitative results section and she was raised
by a Latino
family. More than 80% identified themselves as Latino or partly
Latino.
Given our sample, it was impossible to tease apart linguistic and
ethnic
identity and their influence on friendships. When comparing
their friends,
some students selected Spanish speakers as monolinguals and
Latino
English speakers as monolinguals. Because of this complication,
we were
unable to offer conclusions about whether similarity of
ethnicity, language,
or culture was more important to our participants. Research on a
larger
sample that could explore some of these differences would help
determine
the important characteristics in having a bilingual friend.
Despite these limitations, both the quantitative and qualitative
data
pointed to greater quality and comfort in friendships with other
bilinguals
than with monolinguals. Researchers may want to further study
under-
standing, connection, and identification in friendship processes
of emerg-
ing adults of color or to compare same-ethnic and cross-ethnic
friendships.
In addition to providing greater understanding, connection, and
identifica-
tion, most participants valued their friendships with other
bilinguals and
gained a sense of ethnic and linguistic pride from them.
Friendships
empower students of color in ways researchers are only
beginning to under-
stand. Because other research on undergraduates of color has
suggested that
having only same-race friendships is problematic for academic
achieve-
ment (Levin et al., 2006), more research is needed to address
how same-
ethnicity friends can provide greater security and more help and
yet may
create ethnic segregation on college campuses.
Appendix A
Semistructured Interview Questions
Social Interaction Questions
1. Which activities are you involved in:
a. At school:
b. In your community:
2. Where do you go shopping for groceries?
3. If you were going out on a Friday night with your friends,
where would you guys go?
4. Do you attend mass service in Spanish or English?
5. Which Spanish language TV programs do you watch?
6. Which English language TV programs do you watch?
7. Which Spanish music stations do you listen?
8. Which Spanish language newspapers or magazines do you
read?
214 Journal of Adolescent Research
(continued)
at HOWARD UNIV UNDERGRAD LIBRARY on September
30, 2015jar.sagepub.comDownloaded from
http://jar.sagepub.com/
Sebanc et al. / Friendship Features of Bilingual Undergraduates
215
Appendix A (continued)
Questions Comparing Bilingual And Monolingual Friendships
9. What are some of the things you can do with bilingual friends
that you can’t do with
monolingual friends?
10. Does the quality of your friendship with bilinguals differ
from your friendships with
monolinguals? How?
Questions About Bilingual Friendships
11. When do you use Spanish with your bilingual friends?
12. When do you use English with your bilingual friends?
13. How often do you switch languages in your bilingual
friendships?
14. Does language switching affect your friendship in any way?
If so, how?
15. Did you ever feel like it was hard to make friends with
people who were not bilin-
gual? Why?
Frequencies, Proportion, GraphsFebruary 8th, 2016Frequen.docx

More Related Content

Similar to Frequencies, Proportion, GraphsFebruary 8th, 2016Frequen.docx

UNIT III -Measures of Central Tendency 2.ppt
UNIT III -Measures of Central Tendency 2.pptUNIT III -Measures of Central Tendency 2.ppt
UNIT III -Measures of Central Tendency 2.pptDan Lhery Gregorious
 
Basic Statistical Descriptions of Data.pptx
Basic Statistical Descriptions of Data.pptxBasic Statistical Descriptions of Data.pptx
Basic Statistical Descriptions of Data.pptxAnusuya123
 
Unit 5 8614.pptx A_Movie_Review_Pursuit_Of_Happiness
Unit 5 8614.pptx A_Movie_Review_Pursuit_Of_HappinessUnit 5 8614.pptx A_Movie_Review_Pursuit_Of_Happiness
Unit 5 8614.pptx A_Movie_Review_Pursuit_Of_Happinessourbusiness0014
 
UNIT III -Measures of Central Tendency 2.ppt
UNIT III -Measures of Central Tendency 2.pptUNIT III -Measures of Central Tendency 2.ppt
UNIT III -Measures of Central Tendency 2.pptEdwinDagunot4
 
Statistics in research
Statistics in researchStatistics in research
Statistics in researchBalaji P
 
Statistical Methods: Measures of Central Tendency.pptx
Statistical Methods: Measures of Central Tendency.pptxStatistical Methods: Measures of Central Tendency.pptx
Statistical Methods: Measures of Central Tendency.pptxDr. Ramkrishna Singh Solanki
 
Data Description-Numerical Measure-Chap003 2 2.ppt
Data Description-Numerical Measure-Chap003 2 2.pptData Description-Numerical Measure-Chap003 2 2.ppt
Data Description-Numerical Measure-Chap003 2 2.pptArkoKesha
 
Topic 8a Basic Statistics
Topic 8a Basic StatisticsTopic 8a Basic Statistics
Topic 8a Basic StatisticsYee Bee Choo
 
Descriptive statistics
Descriptive statisticsDescriptive statistics
Descriptive statisticsAiden Yeh
 
Statistice Chapter 02[1]
Statistice  Chapter 02[1]Statistice  Chapter 02[1]
Statistice Chapter 02[1]plisasm
 
Mat 255 chapter 3 notes
Mat 255 chapter 3 notesMat 255 chapter 3 notes
Mat 255 chapter 3 notesadrushle
 
Measures of central tendency
Measures of central tendencyMeasures of central tendency
Measures of central tendencykreshajay
 
Bio statistics
Bio statisticsBio statistics
Bio statisticsNc Das
 
Statistics And Correlation
Statistics And CorrelationStatistics And Correlation
Statistics And Correlationpankaj prabhakar
 
Day 4 normal curve and standard scores
Day 4 normal curve and standard scoresDay 4 normal curve and standard scores
Day 4 normal curve and standard scoresElih Sutisna Yanto
 
Desccriptive statistics
Desccriptive statisticsDesccriptive statistics
Desccriptive statisticsImtiaz129
 
Topic 2 Measures of Central Tendency.pptx
Topic 2   Measures of Central Tendency.pptxTopic 2   Measures of Central Tendency.pptx
Topic 2 Measures of Central Tendency.pptxCallplanetsDeveloper
 

Similar to Frequencies, Proportion, GraphsFebruary 8th, 2016Frequen.docx (20)

UNIT III -Measures of Central Tendency 2.ppt
UNIT III -Measures of Central Tendency 2.pptUNIT III -Measures of Central Tendency 2.ppt
UNIT III -Measures of Central Tendency 2.ppt
 
Basic Statistical Descriptions of Data.pptx
Basic Statistical Descriptions of Data.pptxBasic Statistical Descriptions of Data.pptx
Basic Statistical Descriptions of Data.pptx
 
Unit 5 8614.pptx A_Movie_Review_Pursuit_Of_Happiness
Unit 5 8614.pptx A_Movie_Review_Pursuit_Of_HappinessUnit 5 8614.pptx A_Movie_Review_Pursuit_Of_Happiness
Unit 5 8614.pptx A_Movie_Review_Pursuit_Of_Happiness
 
UNIT III -Measures of Central Tendency 2.ppt
UNIT III -Measures of Central Tendency 2.pptUNIT III -Measures of Central Tendency 2.ppt
UNIT III -Measures of Central Tendency 2.ppt
 
Statistics in research
Statistics in researchStatistics in research
Statistics in research
 
Statistical Methods: Measures of Central Tendency.pptx
Statistical Methods: Measures of Central Tendency.pptxStatistical Methods: Measures of Central Tendency.pptx
Statistical Methods: Measures of Central Tendency.pptx
 
Chapter 11 Psrm
Chapter 11 PsrmChapter 11 Psrm
Chapter 11 Psrm
 
Data Description-Numerical Measure-Chap003 2 2.ppt
Data Description-Numerical Measure-Chap003 2 2.pptData Description-Numerical Measure-Chap003 2 2.ppt
Data Description-Numerical Measure-Chap003 2 2.ppt
 
Topic 8a Basic Statistics
Topic 8a Basic StatisticsTopic 8a Basic Statistics
Topic 8a Basic Statistics
 
Descriptive statistics
Descriptive statisticsDescriptive statistics
Descriptive statistics
 
Statistice Chapter 02[1]
Statistice  Chapter 02[1]Statistice  Chapter 02[1]
Statistice Chapter 02[1]
 
Statistics
StatisticsStatistics
Statistics
 
Mat 255 chapter 3 notes
Mat 255 chapter 3 notesMat 255 chapter 3 notes
Mat 255 chapter 3 notes
 
Measures of central tendency
Measures of central tendencyMeasures of central tendency
Measures of central tendency
 
Bio statistics
Bio statisticsBio statistics
Bio statistics
 
Statistics And Correlation
Statistics And CorrelationStatistics And Correlation
Statistics And Correlation
 
Day 4 normal curve and standard scores
Day 4 normal curve and standard scoresDay 4 normal curve and standard scores
Day 4 normal curve and standard scores
 
Desccriptive statistics
Desccriptive statisticsDesccriptive statistics
Desccriptive statistics
 
Topic 2 Measures of Central Tendency.pptx
Topic 2   Measures of Central Tendency.pptxTopic 2   Measures of Central Tendency.pptx
Topic 2 Measures of Central Tendency.pptx
 
Quants
QuantsQuants
Quants
 

More from hanneloremccaffery

 Explain how firms can benefit from forecastingexchange rates .docx
 Explain how firms can benefit from forecastingexchange rates .docx Explain how firms can benefit from forecastingexchange rates .docx
 Explain how firms can benefit from forecastingexchange rates .docxhanneloremccaffery
 
•POL201 •Discussions •Week 5 - DiscussionVoter and Voter Tu.docx
•POL201 •Discussions •Week 5 - DiscussionVoter and Voter Tu.docx•POL201 •Discussions •Week 5 - DiscussionVoter and Voter Tu.docx
•POL201 •Discussions •Week 5 - DiscussionVoter and Voter Tu.docxhanneloremccaffery
 
•No less than 4 pages causal argument researched essay •In.docx
•No less than 4 pages causal argument researched essay •In.docx•No less than 4 pages causal argument researched essay •In.docx
•No less than 4 pages causal argument researched essay •In.docxhanneloremccaffery
 
•Focus on two or three things in the Mesopotamian andor Ovids ac.docx
•Focus on two or three things in the Mesopotamian andor Ovids ac.docx•Focus on two or three things in the Mesopotamian andor Ovids ac.docx
•Focus on two or three things in the Mesopotamian andor Ovids ac.docxhanneloremccaffery
 
•Langbein, L. (2012). Public program evaluation A statistical guide.docx
•Langbein, L. (2012). Public program evaluation A statistical guide.docx•Langbein, L. (2012). Public program evaluation A statistical guide.docx
•Langbein, L. (2012). Public program evaluation A statistical guide.docxhanneloremccaffery
 
•Chapter 10 Do you think it is possible for an outsider to accura.docx
•Chapter 10 Do you think it is possible for an outsider to accura.docx•Chapter 10 Do you think it is possible for an outsider to accura.docx
•Chapter 10 Do you think it is possible for an outsider to accura.docxhanneloremccaffery
 
·         Bakit Di gaanong kaganda ang pagturo sa UST sa panahon.docx
·         Bakit Di gaanong kaganda ang pagturo sa UST sa panahon.docx·         Bakit Di gaanong kaganda ang pagturo sa UST sa panahon.docx
·         Bakit Di gaanong kaganda ang pagturo sa UST sa panahon.docxhanneloremccaffery
 
·YOUR INDIVIDUAL PAPER IS ARGUMENTATIVE OR POSITIONAL(Heal.docx
·YOUR INDIVIDUAL PAPER IS ARGUMENTATIVE OR POSITIONAL(Heal.docx·YOUR INDIVIDUAL PAPER IS ARGUMENTATIVE OR POSITIONAL(Heal.docx
·YOUR INDIVIDUAL PAPER IS ARGUMENTATIVE OR POSITIONAL(Heal.docxhanneloremccaffery
 
·Write a 750- to 1,Write a 750- to 1,200-word paper that.docx
·Write a 750- to 1,Write a 750- to 1,200-word paper that.docx·Write a 750- to 1,Write a 750- to 1,200-word paper that.docx
·Write a 750- to 1,Write a 750- to 1,200-word paper that.docxhanneloremccaffery
 
[Type here]Ok. This school makes me confused. The summary of t.docx
[Type here]Ok. This school makes me confused. The summary of t.docx[Type here]Ok. This school makes me confused. The summary of t.docx
[Type here]Ok. This school makes me confused. The summary of t.docxhanneloremccaffery
 
© 2020 Cengage Learning®. May not be scanned, copied or duplic.docx
© 2020 Cengage Learning®. May not be scanned, copied or duplic.docx© 2020 Cengage Learning®. May not be scanned, copied or duplic.docx
© 2020 Cengage Learning®. May not be scanned, copied or duplic.docxhanneloremccaffery
 
© 2016 Laureate Education, Inc. Page 1 of 3 RWRCOEL Prof.docx
© 2016 Laureate Education, Inc.   Page 1 of 3 RWRCOEL Prof.docx© 2016 Laureate Education, Inc.   Page 1 of 3 RWRCOEL Prof.docx
© 2016 Laureate Education, Inc. Page 1 of 3 RWRCOEL Prof.docxhanneloremccaffery
 
© 2022 Post University, ALL RIGHTS RESERVED Due Date.docx
© 2022 Post University, ALL RIGHTS RESERVED  Due Date.docx© 2022 Post University, ALL RIGHTS RESERVED  Due Date.docx
© 2022 Post University, ALL RIGHTS RESERVED Due Date.docxhanneloremccaffery
 
{DiscriminationGENERAL DISCRIMINATI.docx
{DiscriminationGENERAL DISCRIMINATI.docx{DiscriminationGENERAL DISCRIMINATI.docx
{DiscriminationGENERAL DISCRIMINATI.docxhanneloremccaffery
 
~UEER THEORY AND THE JEWISH QUESTI01 Daniel Boyarin, Da.docx
~UEER THEORY AND THE JEWISH QUESTI01 Daniel Boyarin, Da.docx~UEER THEORY AND THE JEWISH QUESTI01 Daniel Boyarin, Da.docx
~UEER THEORY AND THE JEWISH QUESTI01 Daniel Boyarin, Da.docxhanneloremccaffery
 
© 2017 Cengage Learning. All Rights Reserved.Chapter Twelve.docx
©  2017 Cengage Learning. All Rights Reserved.Chapter Twelve.docx©  2017 Cengage Learning. All Rights Reserved.Chapter Twelve.docx
© 2017 Cengage Learning. All Rights Reserved.Chapter Twelve.docxhanneloremccaffery
 
`HISTORY 252AEarly Modern Europe from 1500 to 1815Dr. Burton .docx
`HISTORY 252AEarly Modern Europe from 1500 to 1815Dr. Burton .docx`HISTORY 252AEarly Modern Europe from 1500 to 1815Dr. Burton .docx
`HISTORY 252AEarly Modern Europe from 1500 to 1815Dr. Burton .docxhanneloremccaffery
 
^ Acadumy of Management Journal2001. Vol. 44. No. 2. 219-237.docx
^ Acadumy of Management Journal2001. Vol. 44. No. 2. 219-237.docx^ Acadumy of Management Journal2001. Vol. 44. No. 2. 219-237.docx
^ Acadumy of Management Journal2001. Vol. 44. No. 2. 219-237.docxhanneloremccaffery
 
__MACOSXSujan Poster._CNA320 Poster Presentation rubric.pdf.docx
__MACOSXSujan Poster._CNA320 Poster Presentation rubric.pdf.docx__MACOSXSujan Poster._CNA320 Poster Presentation rubric.pdf.docx
__MACOSXSujan Poster._CNA320 Poster Presentation rubric.pdf.docxhanneloremccaffery
 

More from hanneloremccaffery (20)

 Explain how firms can benefit from forecastingexchange rates .docx
 Explain how firms can benefit from forecastingexchange rates .docx Explain how firms can benefit from forecastingexchange rates .docx
 Explain how firms can benefit from forecastingexchange rates .docx
 
•POL201 •Discussions •Week 5 - DiscussionVoter and Voter Tu.docx
•POL201 •Discussions •Week 5 - DiscussionVoter and Voter Tu.docx•POL201 •Discussions •Week 5 - DiscussionVoter and Voter Tu.docx
•POL201 •Discussions •Week 5 - DiscussionVoter and Voter Tu.docx
 
•No less than 4 pages causal argument researched essay •In.docx
•No less than 4 pages causal argument researched essay •In.docx•No less than 4 pages causal argument researched essay •In.docx
•No less than 4 pages causal argument researched essay •In.docx
 
•Focus on two or three things in the Mesopotamian andor Ovids ac.docx
•Focus on two or three things in the Mesopotamian andor Ovids ac.docx•Focus on two or three things in the Mesopotamian andor Ovids ac.docx
•Focus on two or three things in the Mesopotamian andor Ovids ac.docx
 
•Langbein, L. (2012). Public program evaluation A statistical guide.docx
•Langbein, L. (2012). Public program evaluation A statistical guide.docx•Langbein, L. (2012). Public program evaluation A statistical guide.docx
•Langbein, L. (2012). Public program evaluation A statistical guide.docx
 
•Chapter 10 Do you think it is possible for an outsider to accura.docx
•Chapter 10 Do you think it is possible for an outsider to accura.docx•Chapter 10 Do you think it is possible for an outsider to accura.docx
•Chapter 10 Do you think it is possible for an outsider to accura.docx
 
·         Bakit Di gaanong kaganda ang pagturo sa UST sa panahon.docx
·         Bakit Di gaanong kaganda ang pagturo sa UST sa panahon.docx·         Bakit Di gaanong kaganda ang pagturo sa UST sa panahon.docx
·         Bakit Di gaanong kaganda ang pagturo sa UST sa panahon.docx
 
·YOUR INDIVIDUAL PAPER IS ARGUMENTATIVE OR POSITIONAL(Heal.docx
·YOUR INDIVIDUAL PAPER IS ARGUMENTATIVE OR POSITIONAL(Heal.docx·YOUR INDIVIDUAL PAPER IS ARGUMENTATIVE OR POSITIONAL(Heal.docx
·YOUR INDIVIDUAL PAPER IS ARGUMENTATIVE OR POSITIONAL(Heal.docx
 
·Write a 750- to 1,Write a 750- to 1,200-word paper that.docx
·Write a 750- to 1,Write a 750- to 1,200-word paper that.docx·Write a 750- to 1,Write a 750- to 1,200-word paper that.docx
·Write a 750- to 1,Write a 750- to 1,200-word paper that.docx
 
[Type here]Ok. This school makes me confused. The summary of t.docx
[Type here]Ok. This school makes me confused. The summary of t.docx[Type here]Ok. This school makes me confused. The summary of t.docx
[Type here]Ok. This school makes me confused. The summary of t.docx
 
© 2020 Cengage Learning®. May not be scanned, copied or duplic.docx
© 2020 Cengage Learning®. May not be scanned, copied or duplic.docx© 2020 Cengage Learning®. May not be scanned, copied or duplic.docx
© 2020 Cengage Learning®. May not be scanned, copied or duplic.docx
 
© 2016 Laureate Education, Inc. Page 1 of 3 RWRCOEL Prof.docx
© 2016 Laureate Education, Inc.   Page 1 of 3 RWRCOEL Prof.docx© 2016 Laureate Education, Inc.   Page 1 of 3 RWRCOEL Prof.docx
© 2016 Laureate Education, Inc. Page 1 of 3 RWRCOEL Prof.docx
 
© 2022 Post University, ALL RIGHTS RESERVED Due Date.docx
© 2022 Post University, ALL RIGHTS RESERVED  Due Date.docx© 2022 Post University, ALL RIGHTS RESERVED  Due Date.docx
© 2022 Post University, ALL RIGHTS RESERVED Due Date.docx
 
{DiscriminationGENERAL DISCRIMINATI.docx
{DiscriminationGENERAL DISCRIMINATI.docx{DiscriminationGENERAL DISCRIMINATI.docx
{DiscriminationGENERAL DISCRIMINATI.docx
 
~UEER THEORY AND THE JEWISH QUESTI01 Daniel Boyarin, Da.docx
~UEER THEORY AND THE JEWISH QUESTI01 Daniel Boyarin, Da.docx~UEER THEORY AND THE JEWISH QUESTI01 Daniel Boyarin, Da.docx
~UEER THEORY AND THE JEWISH QUESTI01 Daniel Boyarin, Da.docx
 
© 2017 Cengage Learning. All Rights Reserved.Chapter Twelve.docx
©  2017 Cengage Learning. All Rights Reserved.Chapter Twelve.docx©  2017 Cengage Learning. All Rights Reserved.Chapter Twelve.docx
© 2017 Cengage Learning. All Rights Reserved.Chapter Twelve.docx
 
`HISTORY 252AEarly Modern Europe from 1500 to 1815Dr. Burton .docx
`HISTORY 252AEarly Modern Europe from 1500 to 1815Dr. Burton .docx`HISTORY 252AEarly Modern Europe from 1500 to 1815Dr. Burton .docx
`HISTORY 252AEarly Modern Europe from 1500 to 1815Dr. Burton .docx
 
^ Acadumy of Management Journal2001. Vol. 44. No. 2. 219-237.docx
^ Acadumy of Management Journal2001. Vol. 44. No. 2. 219-237.docx^ Acadumy of Management Journal2001. Vol. 44. No. 2. 219-237.docx
^ Acadumy of Management Journal2001. Vol. 44. No. 2. 219-237.docx
 
`Inclusiveness. The main.docx
`Inclusiveness. The main.docx`Inclusiveness. The main.docx
`Inclusiveness. The main.docx
 
__MACOSXSujan Poster._CNA320 Poster Presentation rubric.pdf.docx
__MACOSXSujan Poster._CNA320 Poster Presentation rubric.pdf.docx__MACOSXSujan Poster._CNA320 Poster Presentation rubric.pdf.docx
__MACOSXSujan Poster._CNA320 Poster Presentation rubric.pdf.docx
 

Recently uploaded

Solving Puzzles Benefits Everyone (English).pptx
Solving Puzzles Benefits Everyone (English).pptxSolving Puzzles Benefits Everyone (English).pptx
Solving Puzzles Benefits Everyone (English).pptxOH TEIK BIN
 
Mastering the Unannounced Regulatory Inspection
Mastering the Unannounced Regulatory InspectionMastering the Unannounced Regulatory Inspection
Mastering the Unannounced Regulatory InspectionSafetyChain Software
 
APM Welcome, APM North West Network Conference, Synergies Across Sectors
APM Welcome, APM North West Network Conference, Synergies Across SectorsAPM Welcome, APM North West Network Conference, Synergies Across Sectors
APM Welcome, APM North West Network Conference, Synergies Across SectorsAssociation for Project Management
 
SOCIAL AND HISTORICAL CONTEXT - LFTVD.pptx
SOCIAL AND HISTORICAL CONTEXT - LFTVD.pptxSOCIAL AND HISTORICAL CONTEXT - LFTVD.pptx
SOCIAL AND HISTORICAL CONTEXT - LFTVD.pptxiammrhaywood
 
Incoming and Outgoing Shipments in 1 STEP Using Odoo 17
Incoming and Outgoing Shipments in 1 STEP Using Odoo 17Incoming and Outgoing Shipments in 1 STEP Using Odoo 17
Incoming and Outgoing Shipments in 1 STEP Using Odoo 17Celine George
 
Industrial Policy - 1948, 1956, 1973, 1977, 1980, 1991
Industrial Policy - 1948, 1956, 1973, 1977, 1980, 1991Industrial Policy - 1948, 1956, 1973, 1977, 1980, 1991
Industrial Policy - 1948, 1956, 1973, 1977, 1980, 1991RKavithamani
 
mini mental status format.docx
mini    mental       status     format.docxmini    mental       status     format.docx
mini mental status format.docxPoojaSen20
 
Science 7 - LAND and SEA BREEZE and its Characteristics
Science 7 - LAND and SEA BREEZE and its CharacteristicsScience 7 - LAND and SEA BREEZE and its Characteristics
Science 7 - LAND and SEA BREEZE and its CharacteristicsKarinaGenton
 
The Most Excellent Way | 1 Corinthians 13
The Most Excellent Way | 1 Corinthians 13The Most Excellent Way | 1 Corinthians 13
The Most Excellent Way | 1 Corinthians 13Steve Thomason
 
Introduction to ArtificiaI Intelligence in Higher Education
Introduction to ArtificiaI Intelligence in Higher EducationIntroduction to ArtificiaI Intelligence in Higher Education
Introduction to ArtificiaI Intelligence in Higher Educationpboyjonauth
 
Alper Gobel In Media Res Media Component
Alper Gobel In Media Res Media ComponentAlper Gobel In Media Res Media Component
Alper Gobel In Media Res Media ComponentInMediaRes1
 
Introduction to AI in Higher Education_draft.pptx
Introduction to AI in Higher Education_draft.pptxIntroduction to AI in Higher Education_draft.pptx
Introduction to AI in Higher Education_draft.pptxpboyjonauth
 
Call Girls in Dwarka Mor Delhi Contact Us 9654467111
Call Girls in Dwarka Mor Delhi Contact Us 9654467111Call Girls in Dwarka Mor Delhi Contact Us 9654467111
Call Girls in Dwarka Mor Delhi Contact Us 9654467111Sapana Sha
 
Kisan Call Centre - To harness potential of ICT in Agriculture by answer farm...
Kisan Call Centre - To harness potential of ICT in Agriculture by answer farm...Kisan Call Centre - To harness potential of ICT in Agriculture by answer farm...
Kisan Call Centre - To harness potential of ICT in Agriculture by answer farm...Krashi Coaching
 
Micromeritics - Fundamental and Derived Properties of Powders
Micromeritics - Fundamental and Derived Properties of PowdersMicromeritics - Fundamental and Derived Properties of Powders
Micromeritics - Fundamental and Derived Properties of PowdersChitralekhaTherkar
 
A Critique of the Proposed National Education Policy Reform
A Critique of the Proposed National Education Policy ReformA Critique of the Proposed National Education Policy Reform
A Critique of the Proposed National Education Policy ReformChameera Dedduwage
 
Organic Name Reactions for the students and aspirants of Chemistry12th.pptx
Organic Name Reactions  for the students and aspirants of Chemistry12th.pptxOrganic Name Reactions  for the students and aspirants of Chemistry12th.pptx
Organic Name Reactions for the students and aspirants of Chemistry12th.pptxVS Mahajan Coaching Centre
 
microwave assisted reaction. General introduction
microwave assisted reaction. General introductionmicrowave assisted reaction. General introduction
microwave assisted reaction. General introductionMaksud Ahmed
 
BASLIQ CURRENT LOOKBOOK LOOKBOOK(1) (1).pdf
BASLIQ CURRENT LOOKBOOK  LOOKBOOK(1) (1).pdfBASLIQ CURRENT LOOKBOOK  LOOKBOOK(1) (1).pdf
BASLIQ CURRENT LOOKBOOK LOOKBOOK(1) (1).pdfSoniaTolstoy
 

Recently uploaded (20)

Solving Puzzles Benefits Everyone (English).pptx
Solving Puzzles Benefits Everyone (English).pptxSolving Puzzles Benefits Everyone (English).pptx
Solving Puzzles Benefits Everyone (English).pptx
 
Mastering the Unannounced Regulatory Inspection
Mastering the Unannounced Regulatory InspectionMastering the Unannounced Regulatory Inspection
Mastering the Unannounced Regulatory Inspection
 
APM Welcome, APM North West Network Conference, Synergies Across Sectors
APM Welcome, APM North West Network Conference, Synergies Across SectorsAPM Welcome, APM North West Network Conference, Synergies Across Sectors
APM Welcome, APM North West Network Conference, Synergies Across Sectors
 
SOCIAL AND HISTORICAL CONTEXT - LFTVD.pptx
SOCIAL AND HISTORICAL CONTEXT - LFTVD.pptxSOCIAL AND HISTORICAL CONTEXT - LFTVD.pptx
SOCIAL AND HISTORICAL CONTEXT - LFTVD.pptx
 
Incoming and Outgoing Shipments in 1 STEP Using Odoo 17
Incoming and Outgoing Shipments in 1 STEP Using Odoo 17Incoming and Outgoing Shipments in 1 STEP Using Odoo 17
Incoming and Outgoing Shipments in 1 STEP Using Odoo 17
 
Industrial Policy - 1948, 1956, 1973, 1977, 1980, 1991
Industrial Policy - 1948, 1956, 1973, 1977, 1980, 1991Industrial Policy - 1948, 1956, 1973, 1977, 1980, 1991
Industrial Policy - 1948, 1956, 1973, 1977, 1980, 1991
 
mini mental status format.docx
mini    mental       status     format.docxmini    mental       status     format.docx
mini mental status format.docx
 
Science 7 - LAND and SEA BREEZE and its Characteristics
Science 7 - LAND and SEA BREEZE and its CharacteristicsScience 7 - LAND and SEA BREEZE and its Characteristics
Science 7 - LAND and SEA BREEZE and its Characteristics
 
The Most Excellent Way | 1 Corinthians 13
The Most Excellent Way | 1 Corinthians 13The Most Excellent Way | 1 Corinthians 13
The Most Excellent Way | 1 Corinthians 13
 
Introduction to ArtificiaI Intelligence in Higher Education
Introduction to ArtificiaI Intelligence in Higher EducationIntroduction to ArtificiaI Intelligence in Higher Education
Introduction to ArtificiaI Intelligence in Higher Education
 
Alper Gobel In Media Res Media Component
Alper Gobel In Media Res Media ComponentAlper Gobel In Media Res Media Component
Alper Gobel In Media Res Media Component
 
Introduction to AI in Higher Education_draft.pptx
Introduction to AI in Higher Education_draft.pptxIntroduction to AI in Higher Education_draft.pptx
Introduction to AI in Higher Education_draft.pptx
 
Call Girls in Dwarka Mor Delhi Contact Us 9654467111
Call Girls in Dwarka Mor Delhi Contact Us 9654467111Call Girls in Dwarka Mor Delhi Contact Us 9654467111
Call Girls in Dwarka Mor Delhi Contact Us 9654467111
 
Kisan Call Centre - To harness potential of ICT in Agriculture by answer farm...
Kisan Call Centre - To harness potential of ICT in Agriculture by answer farm...Kisan Call Centre - To harness potential of ICT in Agriculture by answer farm...
Kisan Call Centre - To harness potential of ICT in Agriculture by answer farm...
 
Micromeritics - Fundamental and Derived Properties of Powders
Micromeritics - Fundamental and Derived Properties of PowdersMicromeritics - Fundamental and Derived Properties of Powders
Micromeritics - Fundamental and Derived Properties of Powders
 
A Critique of the Proposed National Education Policy Reform
A Critique of the Proposed National Education Policy ReformA Critique of the Proposed National Education Policy Reform
A Critique of the Proposed National Education Policy Reform
 
Model Call Girl in Bikash Puri Delhi reach out to us at 🔝9953056974🔝
Model Call Girl in Bikash Puri  Delhi reach out to us at 🔝9953056974🔝Model Call Girl in Bikash Puri  Delhi reach out to us at 🔝9953056974🔝
Model Call Girl in Bikash Puri Delhi reach out to us at 🔝9953056974🔝
 
Organic Name Reactions for the students and aspirants of Chemistry12th.pptx
Organic Name Reactions  for the students and aspirants of Chemistry12th.pptxOrganic Name Reactions  for the students and aspirants of Chemistry12th.pptx
Organic Name Reactions for the students and aspirants of Chemistry12th.pptx
 
microwave assisted reaction. General introduction
microwave assisted reaction. General introductionmicrowave assisted reaction. General introduction
microwave assisted reaction. General introduction
 
BASLIQ CURRENT LOOKBOOK LOOKBOOK(1) (1).pdf
BASLIQ CURRENT LOOKBOOK  LOOKBOOK(1) (1).pdfBASLIQ CURRENT LOOKBOOK  LOOKBOOK(1) (1).pdf
BASLIQ CURRENT LOOKBOOK LOOKBOOK(1) (1).pdf
 

Frequencies, Proportion, GraphsFebruary 8th, 2016Frequen.docx

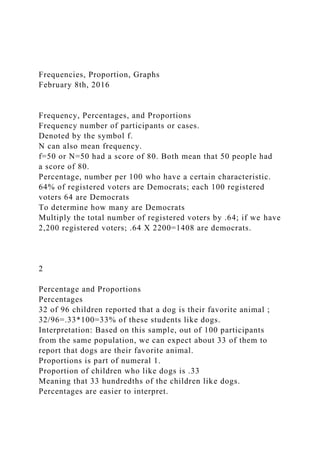
  • 1. Frequencies, Proportion, Graphs February 8th, 2016 Frequency, Percentages, and Proportions Frequency number of participants or cases. Denoted by the symbol f. N can also mean frequency. f=50 or N=50 had a score of 80. Both mean that 50 people had a score of 80. Percentage, number per 100 who have a certain characteristic. 64% of registered voters are Democrats; each 100 registered voters 64 are Democrats To determine how many are Democrats Multiply the total number of registered voters by .64; if we have 2,200 registered voters; .64 X 2200=1408 are democrats. 2 Percentage and Proportions Percentages 32 of 96 children reported that a dog is their favorite animal ; 32/96=.33*100=33% of these students like dogs. Interpretation: Based on this sample, out of 100 participants from the same population, we can expect about 33 of them to report that dogs are their favorite animal. Proportions is part of numeral 1. Proportion of children who like dogs is .33 Meaning that 33 hundredths of the children like dogs. Percentages are easier to interpret.
  • 2. Percentages Cont’d Good to report the sample size with the frequency Percentages can help us understand differences between groups of individuals College ACollege BNumber of Education MajorsN=500N=800Early Childhood EducationN= 400 (80%)N=600 (75%) Shapes of Distributions Frequency distribution Number of participants have each score Remember that we are describing our data X (Score)f2522442352110207194181171N=34 Frequency Polygon Histogram Shapes of Distributions Cont’d Normal Distribution Most Important shape (shape found in nature) Heights of 10 year old boys in a large population Bell-shaped curve
  • 3. Used for inferential Statistics Skewed Distributions Skew: most frequent scores are clustered at one end of the distribution The symmetry of the distribution. Positive skew (scores bunched at low values with the tail pointing to high values). Negative skew (scores bunched at high values with the tail pointing to low values). Consider how groups differ depending on their standard deviation. 68% of the cases lie within one standard deviation unit of the mean in a normal distribution. 95% of the cases lie within two standard deviation unit of the mean in a normal distribution 99% of the cases lie within three standard deviation unit of the mean in a normal distribution Standard Deviation and the Normal Distribution February 1, 2016 Descriptive Statistics Number of Children in families
  • 4. Order of finish in the Boston Marathon Grading System (A, B, C, D, F) Level of Blood Sugar Time required to complete a maze Political Party Affiliation Amount of gasoline consumed Majors in College IQ scores Number of Fatal Accidents Level of Measurement Examples 2 Types of Statistics We use descriptive statistics to summarize data Think about measures of central tendency and variability We use correlational statistics to describe the relationship between two variables Considered as a special case of descriptive statistics We use inferential statistics to generalize from the sample to the larger population Measures of Central Tendency Mean Average Score Median Middle 50% of the distribution; point at which 50% of the distribution lies above or below. Mode
  • 5. Most Frequent Score Central tendency: The Mode Mode: score that occurs the most frequently in the dataset. Bimodal Having two modes Multimodal Having several modes Can take on several values Ex. 10 12 12 14 16 18 19 20 Ex. 15 16 17 17 18 19 19 20 5 Central Tendency: The Median Median The middle score when scores are ordered. Example Number of friends of 11 Facebook users. Ex. 22 40 53 57 93 98 103 108 116 121 252 Arrange the score in ascending order Count the number of scores we have collected (n) Add one to this value Divide by 2 Find the score in that position (n+1)/2= (11+1)/2= 12/2=6
  • 6. 6 Central Tendency: Median Cont’d Ex. 22 40 53 57 93 98 103 108 116 121 252 Drop 252 (n+1)/2= (10+1)/2= 11/2=5.5 Median is halfway between the 5th and 6th score Add the 5th and 6th score and divide by 2 93+98=191/2=95.5 Median is unaffected by extreme scores at either end of the continuum Useful for ordinal, interval, and ratio level data. 7 Central Tendency: The Mean Mean The sum of scores divided by the number of scores. Number of friends of 11 Facebook users.
  • 7. 8 Central Tendency: The Mean Cont’d Using the same example, if we drop the extreme score (252). Mean drops to 81.1 friends. Influenced by extreme scores. 9 Shapes of Distributions Cont’d Normal Distribution Most Important shape (shape found in nature) Heights of 10 year old boys in a large population Bell-shaped curve Used for inferential Statistics Skewed Distributions Skew: most frequent scores are clustered at one end of the distribution The symmetry of the distribution. Positive skew (scores bunched at low values with the tail
  • 8. pointing to high values). Negative skew (scores bunched at high values with the tail pointing to low values). In a skewed distribution, the mode will be located at the peak on one side and the mean will be displaced toward the tail on the other side. The median is usually between the mode and the mean Compare the three measures of central tendency by looking at frequency distribution Comparison of the Mean, Median, Mode 11 Mean, Median, and Mode 12 PositionNumber of EmployeesSalaryPresident1$180,000Executive vice President1$60,000Vice Presidents2$40,000Controller1$22,000
  • 9. (mean)Senior salespeople3$20,000Junior salespeople4$14,800Foreman1$12,000 (median)Machinists12$8,000 (mode) Example 13 Click to edit Master text styles Second level Third level Fourth level Fifth level 14 Slide 15 A Simple Statistical Model In Statistics we fit models to our data (i.e. we use a statistical model to represent what is happening in the real world). The mean is a hypothetical value (i.e. it doesn’t have to be a value that actually exists in the data set). As such, the mean is simple statistical model.
  • 10. 15 Slide 16 The Mean The mean is the sum of all scores divided by the number of scores. The mean is also the value from which the (squared) scores deviate least (it has the least error). 16 Slide 17 Measuring the ‘Fit’ of the Model Measuring the degree to which a statistical model represents the data collected is called the fit. The mean is a model of what happens in the real world: the typical score It is not a perfect representation of the data How can we assess how well the mean represents reality? 17 Differences among participants Describe the amount of variability in a set of scores Range, Variance, Standard Deviation
  • 11. A lot of variability vs. a little variability. Variability 18 Range: quantification of the spread, or dispersion of scores in the data. Ex. Facebook friends 22, 40, 53, 57, 93, 98, 103, 108, 116, 121, 252 Highest Score-Lowest Score 252-22=230 Dramatically effected by extreme scores Used as a rough estimate of the variability of scores Only based on extreme scores Interquartile Range: calculate the range without the extreme scores (associated with the median) Range of the middle 50% of the participants Cut off the top 25% of the top and bottom scores and calculate the range of the middle 50% of the scores. Range and Interquartile Range Calculate quartiles Three values that split the sorted data into four equal parts Second quartile: median, splits the data into two equal parts Mdn=98
  • 12. Lower quartile: median of the lower half of the data Upper quartile: median of the upper half of the data Interquartile Range Cont’d 20 Interquartile Range Cont’d 21 Slide 22 A Simple Statistical Model In Statistics we fit models to our data (i.e. we use a statistical model to represent what is happening in the real world). The mean is a hypothetical value (i.e. it doesn’t have to be a value that actually exists in the data set). As such, the mean is simple statistical model. 22
  • 13. Slide 23 Measuring the ‘Fit’ of the Model Measuring the degree to which a statistical model represents the data collected is called the fit. The mean is a model of what happens in the real world: the typical score It is not a perfect representation of the data How can we assess how well the mean represents reality? 23 Slide 24 A Perfect Fit Rater Rating (out of 5) 24 Number of Friends 1.0 2.0 3.0 4.0 5.0 5.0 5.0 5.0 5.0 5.0 Slide 25 Calculating ‘Error’ A deviation is the difference between the mean and an actual data point.
  • 14. Deviations can be calculated by taking each score and subtracting the mean from it: 25 Slide 26 Click to edit Master text styles Second level Third level Fourth level Fifth level 26 Slide 27 Use the Total Error? We could just take the error between the mean and the data and add them. ScoreMean Deviation12.6-1.622.6- 0.632.60.432.60.442.61.4Total =0
  • 15. 27 Slide 28 Sum of Squared Errors We could add the deviations to find out the total error. Deviations cancel out because some are positive and others negative. Therefore, we square each deviation. If we add these squared deviations we get the Sum of Squared Errors (SS). Good measure of the accuracy of a model 28 Slide 29 ScoreMean DeviationSquared Deviation12.6-1.62.5622.6- 0.60.3632.60.40.1632.60.40.1642.61.41.96Total5.20 Click to edit Master text styles Second level Third level Fourth level Fifth level 29
  • 16. Slide 30 Variance The sum of squares is a good measure of overall variability, but is dependent on the number of scores. We calculate the average variability by dividing by the number of scores (n). This value is called the variance (s2). Average of the error between the mean and the observations 30 Slide 31 Standard Deviation The variance has one problem: it is measured in units squared. This isn’t a very meaningful metric so we take the square root value. This is the Standard Deviation (s). 31 Slide 32 Important Things to Remember
  • 17. The Sum of Squares, Variance, and Standard Deviation represent the same thing: The ‘Fit’ of the mean to the data The variability in the data How well the mean represents the observed data Error 32 Slide 33 Same Mean, Different SD 33 The SD and the Shape of a Distribution 34 Consider how groups differ depending on their standard deviation. 68% of the cases lie within one standard deviation unit of the mean in a normal distribution.
  • 18. 95% of the cases lie within two standard deviation unit of the mean in a normal distribution 99% of the cases lie within three standard deviation unit of the mean in a normal distribution Standard Deviation and the Normal Distribution n x n i i å = = 1 X 1063 252 121 116 108 103
  • 22. - n x x n i i s Chapter 7: Correlation February 22, 2016 What is Correlation? It is a way of measuring the extent to which two variables are related. It measures the pattern of responses across variables. Measuring Relationships Covariance The average sum of combined deviations It tells us by how much scores on two variables differ from their respective means.
  • 24. 6 Covariance (-0.4)(-3) + (-1.4)(-2) + (-1.4)(-1) + (0.6)(2) + (2.6)(4) _________________________________________ N – 1 = 1.2 + 2.8 + 1.4 + 1.2 + 10.4 ________________________ 4 = 17/4 Covariance = 4.25 7 Problems with Covariance It depends upon the scales of measurement used. E.g., the covariance of two variables measured in miles might be 4.25 square miles, but if the same scores are converted to km, the covariance is 11 square kilometers. How do we FIX it?!? 8
  • 25. Standardize It! The covariance must be converted into standard set of units. The standardized covariance is the Correlation Coefficient 9 10 Standardize It! Pearson’s Correlation Coefficient 11 Calculate the Pearson’s Correlation Coefficient!
  • 26. 12 Pearson’s r 4.25 ____________ (1.67)(2.92) = 4.25 _______ 4.8764 Pearson’s r = 0.87 13 Correlation Coefficients A coefficient of: +1 = a perfect positive relationship -1 = a perfect negative relationship 0 = no linear relationship 14
  • 27. More About Correlation It is a measure of effect size ±.1 = small effect (0 -.24) ±.3 = medium effect (.25-.49) ±.5 = large effect (.50 – 1.00) 15 A Word of Warning: Correlation does not imply CAUSATION! The third-variable problem: In any correlation, causality between two variables cannot be assumed because there may be other measured or unmeasured variables affecting the results. Direction of causality: Correlation coefficients say nothing about which variable causes the other to change. 16 “Breaking News!” Time Healthland: Don't Look Now, But Your TV Is Trying To Murder You!
  • 28. New York Times: Apparently, Science Says You Love Your IPhone CNN: Danger! Danger! Dating Spreads Drinking Among Teenagers Using R2 for Interpretation Coefficient of determination, r2 A measure of the amount of variability in one variable that is shared by the other. E.g., correlation between exam performance and exam anxiety. R2 tells us the amount of variance explained by exam anxiety. 18 Nonparametric Correlation Spearman’s Rho Pearson’s correlation on ranked data Kendall’s Tau
  • 29. Better than Spearman’s for small samples 19 ( ) ( ) ( ) 1 1 2 Variance - - å - - å - = = N x x x x N x x
  • 31. i y x xy s s N y y x x s s Cov r 1 - - å - = = March 21st , 2016 * Allows the researcher to make generalizations from sample data
  • 32. to the population from which the sample was drawn. * Systematic Variation Differences in performance created by a specific experimental manipulation. Unsystematic Variation Differences in performance created by unknown factors. Age, Gender, IQ, Time of day, Measurement error etc. Randomization Minimizes unsystematic variation. * Unbiased random sample contains errors. Eliminate bias reducing sampling error. Larger samples yield smaller sampling errors.Precision: same results will be obtained if another random sample were drawn from the population. Increase sample sizeSmaller and the anticipated difference Larger sample size * Small samples can identify very large differences Consider the variables in your study
  • 33. Treatment studies (new medication to reduce a virus)Populations with very limited variability Small samples precise resultsMore variable the population, the larger the sample size. Achievement ScoresIn most cases, 10-15 participants per variable/constructLarge samples do not correct for bias. * Difference between population parameter and a sample statistic What is unaccounted forEven with random sampling, there will be some errorCan estimate the expected error and include in statistical analysisSampling error decreases with increases in sample size * Take several samples from the populationSamples will differ slightlyEach sample will have its own meanWe can calculate the sample mean, the average of the sample meansSamples will vary because they contain different members of the population: sample variationSampling distribution: diagram that shows the frequency distribution of sample means from the same population
  • 34. * Means: Sampling Distribution of meansCentral Limit Theorem: sampling distributions of means will resemble the normal curveStandard deviation of the sampling distribution: Standard error of the mean SEM M = 9 M = 8 M = 10 M = 11
  • 35. M = 12 M = 11 M = 9 M = 10
  • 37. Central Limit theorem Large samples will take the shape of a normal distribution regardless of the shape of the population from which it is drawn Equal to the standard deviation of the sample (s) divided by the square root of the sample size. * Standard deviation of the sample mean Remember that standard deviation a representation of how close the observations are to the meanA large standard error means that there is a lot of variability between the means of different samples The sample might not be representative of the populationA small standard error indicates that most sample means are similar to the population mean Sample is likely to be an accurate reflection of the population * Larger the sample, the smaller the standard error of the mean. Larger samples have greater precisionLess variability in a population, the smaller the standard error the mean. Less variability more precision.
  • 38. * Z-Score Standardizing a score with respect to the other scores in the group. Expresses a score in terms of how many standard deviations it is away from the mean. The distribution of z-scores has a mean of 0 and SD = 1. * We can assess the accuracy of the sample mean as an estimate of the mean in the population by calculating boundaries within which the true value of the mean fall. 95% and 99% are the percent range for most of the confidence intervals calculated. A confidence interval for the mean is a range of scores constructed such that the population mean will fall within this range in 95% of samples If we collect 100 samples, calculated the mean and then calculated the confidence interval for that mean, then for 95 of these samples the confidence interval would contain the true value of the population mean *
  • 39. Sample means will be different form the population means due to sampling variation.We use Z scores to calculate confidence intervals. Properties of Z score As such, 95% of z-scores lie between −1.96 and 1.96. Calculate a 95% confidence interval 99% of z-scores lie between −2.58 and 2.58 Calculate a 99% confidence interval 99.9% of them lie between −3.29 and 3.29. * Lower boundary of confidence interval - (1.96 X SE) Upper boundary of confidence interval + + (1.96 X SE) Value of the mean might be influenced by sampling errors. m=75, s=16, n=64 Sem =2.00Actual mean is called a point estimate 95% or 99% confidence interval 95% confidence interval: We have 95% confidence that the true population mean is between 71-79 99% confidence interval: *
  • 40. Research Hypothesis H1 Statement of the relationship the researcher seeks to find as a result of the study Directional or Non-directional Null Hypothesis H0 States that there is no relationship between the variables under study. Assesses the probability that the results of the study were due to chance. Ex. There is no relationship between mathematical intervention and mathematic achievement. * States the expected relationship between variables.Must be testableShould be consistent with the existing body of knowledgeStatement should be concise. * State in operational terms, the relationships that should be observed if the research hypothesis is trueState the null hypothesis.Gather the dataDetermine if evidence is sufficient to accept or reject the null hypothesis *
  • 41. Rejection of research hypothesis after empirical testing does not mean that the study was failure.Unconfirmed hypothesis are apart of scientific research and still add to the body of knowledgeHypothesis are never proved or disproved * A researcher finds the following differences in Self-Esteem scores between boys and girls.Girls m=70.00 Boys m=80.00Do boys have higher self-esteem or are the results due to chance factors? We use inferential tests to answer the question. Null Hypothesis: The true difference between the means (in the population is zero) H0: u1-u2=0 * Symbolized by a Greek lowercase level alpha (α).Rejection of a true null hypothesis. States that the results of the study were not due to chance. Researcher incorrectly concludes that significant differences WERE found or that a relationship between the variables exists. Considered to be more serious than Type II error. Inferential statistics allow the researcher to estimate population
  • 42. parameters based on what is known about the sample, and sampling error IF YOU REPLICATE the DATA 100 TIMES…… On 5 occasions we would have a see an effect., probability of error, we would have a test statistic large enough to tell us that there is an effect in the population. If we lower the probability~ make alpha more stringent we increase our risk of making a type II errorIf we take 100 samples of data from a population in which an effect exists, we would fail to detect that effect in 20 of these samples. Use tests of significance Null hypothesis is TOOL for significance testing; because you are testing whether your results are due to chance alone, or a real relationships among variables ( so what we do is RULE OUT that is happened by chance alone) – THE CHANCE EXPLANATION IS THE NULL HYPOTHESIS You always begin statistical tests with the assumption that the null hypothesis is true – so you reject the null or fail to reject the null TYPE I – reject the null, but it IS true; you say you have a significant finding when you don’t SAY THE NULL IS FALSE, BUT IT IS TRUE; GENERALLY THIS IS THE MORE SERIOUS (say guilty, but innocent) TYPE II – accept the null but it is NOT true; say there is no difference when really there IS a difference SAY THE NULL IS TRUE, BUT IT IS FALSE (say innocent, but they’re guilty) *
  • 43. Symbolized by a Greek lowercase level beta (β).Investigator retains a false null hypothesisResearcher incorrectly concludes that significant differences were NOT found or that a relationship between the variables does not exist. * Null Hypothesis Type I error: reject true null hypothesisType II error: accept false null hypothesisInnocentGuiltyNot guilty verdictJusticeType II Error βGuilty verdictType I Error αJustice * Investigators must weigh the consequences of a Type I or Type
  • 44. II error before the conducting the experiment.Level of significance: is the level at which the null hypothesis will be rejected. Probability that the investigator is willing to risk in rejecting a null hypothesis. Most common used levels are .05 and .01 * Type I errors can lead to changes in the educational system that are not necessary such as: Best practices Curriculum modifications Teacher training programsType II errors can lead to the lack necessary changes being made. Maintenance of the status quo. * Sample Mean 6 7 8 9 10 11 12 13 14 Frequency 0 1
  • 45. 2 3 4 Mean = 10 SD = 1.22 N s X = s s X X z - = Output: Independent Samples t-test Group Statistics Picture of Spider N Mean Std. Deviation Std. Error Mean Anxiety Level Picture of Spider 12 3.75 1.913 .552 Live Spider 12 5.50
  • 46. 1.784 .515 Independent Samples Test Levene's Test for Equality of Variances t-test for Equality of Means F Sig. t df Sig. (2-tailed) Mean Difference Std. Error Difference 95% Confidence Interval of the Difference Lower Upper Anxiety Level Equal variances assumed .038 .847 -2.318 22 .030 -1.750 .755
  • 47. -3.316 -.184 Equal variances not assumed -2.318 21.893 .030 -1.750 .755 -3.316 -.184 Hypothesis Testing/ Differences between two Means April 4th, 2016 1 Testing The Hypothesis State in operational terms, the relationships that should be observed if the research hypothesis is true State the null hypothesis. Gather the data Determine if evidence is sufficient to accept or reject the null hypothesis 2
  • 48. Hypothesis Testing Cont’d Rejection of research hypothesis after empirical testing does not mean that the study was failure. Unconfirmed hypothesis are apart of scientific research and still add to the body of knowledge Hypothesis are never proved or disproved 3 Null Hypothesis A researcher finds the following differences in Self-Esteem scores between boys and girls. Girls m=70.00 Boys m=80.00 Do boys have higher self-esteem or are the results due to chance factors? We use inferential tests to answer the question. Null Hypothesis: The true difference between the means (in the population is zero) H0: u1-u2=0 Type I Error Symbolized by a Greek lowercase level alpha (α). Rejection of a true null hypothesis. States that the results of the study were not due to chance. Researcher incorrectly concludes that significant differences WERE found or that a relationship between the variables exists. Considered to be more serious than Type II error.
  • 49. 5 Type II Error Symbolized by a Greek lowercase level beta (β). Investigator retains a false null hypothesis Researcher incorrectly concludes that significant differences were NOT found or that a relationship between the variables does not exist. 6 The Strategy of Inferential Statistics Null Hypothesis Type I error: reject true null hypothesis Type II error: accept false null hypothesisInnocentGuiltyNot guilty verdictJusticeType II Error βGuilty verdictType I Error αJustice 7 Level of Significance Investigators must weigh the consequences of a Type I or Type II error before the conducting the experiment. Level of significance: is the level at which the null hypothesis will be rejected.
  • 50. Probability that the investigator is willing to risk in rejecting a null hypothesis. Most common used levels are .05 and .01 .05 level, willing to be wrong 5 times in 100 in rejecting the null hypothesis .01 level, willing to be wrong 1 time in 100 in rejecting the null hypothesis (rejecting the null with more confidence compared to .05). .001 level, willing to be wrong 1 time in 100 in rejecting the null hypothesis. 8 Consequence of Type I and Type II Errors in Education Type I errors can lead to changes in the educational system that are not necessary such as: Best practices Curriculum modifications Teacher training programs Type II errors can lead to the lack necessary changes being made. Maintenance of the status quo. 9 Rationale to the t-testt=observed difference between sample means−expected difference between population means (if null hypothesis is true)estimate of the standard error of the difference between two sample means
  • 51. t-test Dependent t-test Compares two means based on related data. E.g., Data from the same people measured at different times. Data from ‘matched’ samples. Test re-test Independent t-test Compares two means based on independent data E.g., data from different groups of people Boys vs. Girls. 13 Rational for the t-test Two samples of data are collected and the sample means calculated. These means might differ by either a little or a lot. If the samples come from the same population, then we expect their means to be roughly equal. Although it is possible for their means to differ by chance alone, we would expect large differences between sample means to occur very infrequently. There is no effect and sample means in our population fluctuate a lot and we have, by chance, collected two samples that are atypical of the population from which they came.
  • 52. The two samples come from different populations but are typical of their respective parent population. In this scenario, the difference between samples represents a genuine difference between the samples (and so the null hypothesis is incorrect). . 14 Rational for t-test As the observed difference between the sample means gets larger, the more confident we become that the second explanation is correct (i.e. that the null hypothesis should be rejected). If the null hypothesis is rejected, then we gain confidence that the two sample means differ because of the different experimental manipulation imposed on each sample. 15 T-test Cont’d p<.05 t test yields a low probability that the null hypothesis is true Researchers will reject the null hypothesis Larger Samples=less likely that the difference between two means is due to sampling errors. Less sampling error, less change that the null hypothesis is correct Larger observed difference between means = less likely that the difference was created by sampling errors. T-test Cont’d
  • 53. Smaller the variance among subjects: less likely the difference between two means is due to sampling error. Smaller the variance: more likely the null hypothesis will be rejected No sampling error More variation leads to observed differences attributed to sampling error. Statistical Tests t test for independent samples t test for dependent samples 18 Assumptions of the t-test Both the independent t-test and the dependent t-test are parametric tests based on the normal distribution. Therefore, they assume: The sampling distribution is normally distributed. In the dependent t--test this means that the sampling distribution of the differences between scores should be normal, not the scores themselves. Data are measured at least at the interval level. The independent t-test, because it is used to test different groups of people, also assumes: Variances in these populations are roughly equal (homogeneity of variance). Scores in different treatment conditions are independent (because they come from different people). Effect Size: Cohen’s D Magnitude of the difference between variables
  • 54. Experimental Group-Control Group/SD of Control Group Mean for group 1 is 9 tenths of a standard deviation above the control group or group 2. MeanSDGroup 111010Group 210011Effect Size110- 100=1010/11=.90 When Assumptions are Broken Dependent t-test Mann-Whitney Test Wilcoxon rank-sum test Independent t-test Wilcoxon Signed-Rank Test SPSS Example: 1) Independent and Dependent Sample Spider anxiety 2). Calculate the effect size 3). Practice Exercise Output: Independent Samples t-test
  • 55. Group Statistics Picture of Spider N Mean Std. Deviation Std. Error Mean Anxiety Level Picture of Spider 12 3.75 1.913 .552 Live Spider 12 5.50 1.784 .515 Independent Samples Test Levene's Test for Equality of Variances t-test for Equality of Means F Sig. t df Sig. (2-tailed) Mean Difference Std. Error Difference 95% Confidence Interval of the Difference
  • 56. Lower Upper Anxiety Level Equal variances assumed .038 .847 -2.318 22 .030 -1.750 .755 -3.316 -.184 Equal variances not assumed -2.318 21.893 .030 -1.750 .755 -3.316 -.184 Running Head: Collaborative Leadership & Teacher Performance 4
  • 57. Collaborative Leadership & Teacher Performance Student Name: Institution: Professor: Course Title: Date of Submission: Introduction This article examines the effects of collaborative leader on teacher performance with a purpose of critically analyzing and critiquing the effects of having collaboration between the school leaders and the teachers performance that has far much implication also on the student results, school name and overall effect on the community and society the institution is serving. A collaborative leader refers to any kind of a head who recognizes the need for wide consultation and direct involvement of the concerned colleagues in all matters that affects them in the work place. He is the person who recognizes the views, opinions, input in terms of ideas from the people he/she is leading (Pynes, 1997). He is a person who has the people he is leading in his heart and their values in the organization. He believes no man is an island and he is because the other people are there. He or she accepts positive and constructive criticism in order to better the organization he is
  • 58. heading. Collaboration in leadership entails direct involvement of those you are leading in decision making, planning and getting their views and ideas. It assists in easing the burden of thinking alone and allowing brainstorming and coming up with a solution to a problem collectively as a group. When an idea is born through active collaboration then it means it serves the best interests of most if not all members of the group and results of it are sweet fruits. In our case, the collaborative leader can be the school head or principal who works collaboratively with fellow teachers to ensure the success of the school (Marks, 2013). For people to co-work and co-exist collaboratively, they need to share common virtues and attributes and for instance, all of them need to have a common vision that acts as guide line and keeps them together. They also need to have common goals and objectives that they need to achieve at the end of the exercise. A common unity of purpose is key for all within an organization. A successful collaborative approach has a measurement mechanism where the leader (principal) and the stake holders (teachers) review to see if they have achieved their targets within the set time. If not, the loopholes that needs to be filled and ironed to ensure success in the next trial. This also gives them time to reflect on the run of the organization (Goddard & Tschamen, 2007). To ensure collaborative leadership, the principal needs to involve the teachers directly in planning of the lessons and time, offering alternative time to ensure complete teaching, consulting widely during decision making as it affects the teachers, allowing dialogue between the staff and getting their complains and grievances collectively, offering audience to students and parents and engaging in verbal talks on what affects them, proper and unanimous scheduling of time to ensure teacher satisfaction, among others. All these have a direct relationship between teacher performance and consequently the students and school in general. Methodology
  • 59. In order to examine the effects of collaborative leadership in teacher performance different authors have high relied on use of questionnaires in examining the effects of collaborative leadership on teacher performance by sampling both schools that have collaborative leadership and those which do not have. They have relied on oral/verbal interviews that were conducted on teachers in both calibers of schools with all giving almost same views. Below were findings of the research conducted on a sample of 480 teachers. (Gallimore, 2014) Findings After a thorough research on the effects of collaborative leader on teacher performance, below where some of the results that were assembled from the respondents: Effects of collaborative leader on teacher performance It assists in improving poor performing schools through extra teacher performance A collaborative approach between the school principal and teachers can help in improving the grades of a poor performing schools and that is directly related to positive performance by teachers. This is so true for instance, if the principal realizes that the school has been performing poorly due to adoption of one man’s rule where all decisions are made by the principal alone and subjected to teachers regardless of their effects. This may not auger well with teachers and they may not feel moralized to teach (Goddard & Tschamen, 2007). This can well be turned around if the principal holds a dialogue with teachers, gets their views and opinion regarding the school management. If they have a common goal and vision to achieve, that will act as a fabric that will unite them and they will feel strong to work together. Since they have a target to achieve, they will be easy to take as the teachers will realize that they are recognized and their presence felt. Again all this direct involvement of the teachers shows that the principal has trust in his staff and they will work even harder to achieve and maintain standards. A poor performing school can
  • 60. improve its grades if the teachers are delivering well (Sánchez & Schmid, 2013). Creates job satisfaction and exemplary teacher performance Every employee dreams of working in an environment that gives heart satisfaction and peace of mind and teachers are not exceptional. A collaborative approach to teaching ensures that teachers working within that institution feel recognized and that they contributing to the success of the school. This creates a satisfaction and even extra performance in order to raise standards. A calm and conducive working environment may entail involvement of the staff in planning and decision making, through shopping of ideas and opinions from them before arriving in any decision. This also shows that the leader respects the staff and they will be able to work extra mile to ensure they maintain they status, and also possibly get retention within a good performing school. Excellent decision making improving teacher performance A collaborative leader always has an easy time in decision making and most of it is unanimously accepted by all hence less resistance and easy implementation. Direct involvement of the staff through their input in planning and decision making ensures viable results as there is brain storming and exchange of opinions and ideas (Gilbert2014) A common decision is always reached and support is always sure so as success as the staff feels that they are part of the goal setters hence should work hard to ensure they achieve their target and goals as well, since teachers feels obliged to succeed , they put extra effort hence improvement and success of the school. Improved teacher performance leads to student achievement An effective collaboration between the principal and the teaching staff has a direct positive relationship to the performance and achievement of the students. Moralized and focused teachers will have a reason to teach even better and the results of their hard work will be measured by achievement of
  • 61. the students during exams. Teachers will extend that collaborative relationship to even students and reciprocated through excellent results. Involvement of the parents also will assist in teacher performance through the support that the parents will offer (Manyika, 2014). The success of a school is viewed as a collective collaboration of the school head, teaching staff, students, parents and all the involved stake holders. Both moral and verbal support is vital to ensure success of an institution. Creation and maintenance of status quo When a principal through a collaborative approach leads to success of a school, teachers and other stake holders are always proud and create a good name for the school. This also gives it a different status to which may refer it within the society. Teachers, students, parents and the collaborative leader need to always be reading from the same page in order to ensure continued success and maintenance of the status quo (Manyika, 2014). Conclusion From the above research carried out, by the scholars, it can be universally agreed that there is a positive relationship between a collaborative leadership approach and its effect on teacher performance. This consequently has a positive effect on the student achievement and the school in general and contributes to well-being of the society. However any negative effect of the collaborative leadership approach on teacher performance seem not to have been identified by the surveys carried out and hence another extensive research can be carried out to ascertain the extend of the same. References Pynes, Joan. (1997). Human Resources Management for Public and Non-profit Organizations. San Francisco, Jossey-Bass James Manyika. (2014). Insights & Publications. Retrieved March 13, 2016, from A productivity perspective on the future of growth:
  • 62. http://www.mckinsey.com/insights/economic_studies/a_producti vity_perspective_on_the_future_of_growth Goddard R.D & Tschamen-Moran M (2007). A theoretical and empirical investigation of teacher collaboration for school improvement and student achievement in schools Gallimore, R. (2014). Coach John Wooden's Pyramid of Success: A Comparison to the Sport Psychology Literature. International Journal Of Sports Science And Coaching, 9(1), 103-106. Gilbert, W. (2014). Coach John Wooden's Pyramid of Success: A Comparison to the Sport Psychology Literature. International Journal Of Sports Science And Coaching, 9(1), 107-108. Sánchez, C., & Schmid, A. (2013). Base of the pyramid success: a relational view. S Asian Jnl Of Global Bus Res, 2(1), 59-81. Reproduced with permission of the copyright owner. Further reproduction prohibited without permission. Gender differences among African American students in the impact of racial id... Kevin O Cokley Journal of College Student Development; Sep/Oct 2001; 42, 5; ProQuest Education Journals pg. 480 Reproduced with permission of the copyright owner. Further reproduction prohibited without permission.
  • 63. Reproduced with permission of the copyright owner. Further reproduction prohibited without permission. Reproduced with permission of the copyright owner. Further reproduction prohibited without permission. Reproduced with permission of the copyright owner. Further reproduction prohibited without permission. Reproduced with permission of the copyright owner. Further reproduction prohibited without permission. Reproduced with permission of the copyright owner. Further reproduction prohibited without permission. Reproduced with permission of the copyright owner. Further reproduction prohibited without permission. Understanding, Connection, and Identification Friendship Features of Bilingual Spanish-English Speaking Undergraduates Anne M. Sebanc
  • 64. Maria D. Hernandez Maria Alvarado Whittier College, CA Bilingual undergraduates may have closer friendships with other bilinguals than with monolinguals. This study investigated this hypothesis and explored the friendship features of 46 bilingual Spanish and English speaking under- graduates by combining quantitative analyses of surveys and qualitative analyses of interviews. Survey results indicated that participants rated their friendships with bilinguals to be more secure, closer, and to provide more help and companionship than their friendships with monolinguals. During interviews, participants described understanding, connection, and identifica- tion with their bilingual friends. These features were considered reasons for their friendships with other bilinguals and reasons for their greater quality. Bilingual friendships also helped bilingual undergraduates navigate a chal- lenging sociopolitical context and have pride in their ethnolinguistic identity. Keyword: friendship; emerging adulthood; college; bilingual; Latinos Intimacy or emotional closeness in friendships becomes increasingly impor-tant to emerging adults. Research confirms that emotional closeness in both college men’s and women’s friendship was positively related to
  • 65. identity Journal of Adolescent Research Volume 24 Number 2 March 2009 194-217 © 2009 Sage Publications 10.1177/0743558408329953 http://jar.sagepub.com hosted at http://online.sagepub.com 194 Authors’ Note: The authors appreciate all the participants who told their stories of friendship. We thank the reviewers, Sebastianna Maugeri, Elizabeth Mendoza, Yesenia Ocampo, Linzi Juliano, Jessica Barajas, Jodie Ehrlich, Kristin Friedersdorf, Harpreet Kaur, Claudia Ramirez Wiedeman, Jose Orozco, Rafael Chabran, and Andrew Wallis for their assistance with this pro- ject. Muchas gracias por todo. Portions of this article were presented at the 2004 Society for Research on Adolescence Meeting in Baltimore, Maryland and the 2005 Society for Research on Child Development in Atlanta, Georgia. The first author was supported by the National Science Foundation (BCS-0417286) while preparing this manuscript. Please address corre- spondence to Anne Sebanc, Department of Education and Child Development, Whittier
  • 66. College, 13406 Philadelphia Street, Whittier, CA 90601; e-mail: [email protected] at HOWARD UNIV UNDERGRAD LIBRARY on September 30, 2015jar.sagepub.comDownloaded from http://jar.sagepub.com/ exploration and achievement (Johnson et al., 2007). In other words, close friendships may provide support to emerging adults’ identity development or those who are exploring and achieving aspects of their identity may seek close friends. Having support from friends in college ameliorates stress from con- flicts with roommates (Lepore, 1992) and contributes to academic and psy- chological adjustment (Hertel, 2002). One study of Latino college students showed that support from friends more than family contributed to psychologi- cal well-being (Rodriguez, Bingham Mira, Meyers, Morris, & Cordoza, 2003). Considerable research has shown that starting in adolescence and continuing throughout adulthood, individuals expect support and intimacy from their friends, and friendships play a particularly important role during developmen- tal transitions (Hartup & Stevens, 1997). Whether friends offer support and intimacy varies across friendships and individuals’ perceptions of these qualitative features has been shown to predict
  • 67. psychological adjustment. Research has confirmed that positive features (such as companionship, intimacy, and nurturance) in college students’ friendships are positively associated with self-esteem while negative features (conflict and antagonism) predict psychological problems (Bagwell, Bender, Andreassi, Montarello, & Muller, 2005). Many studies have shown that friendship quality can be reduced to two features: positive and negative (Berndt, 1996); although others argue for looking at individual qualitative features, such as validation, conflict resolution, conflict, help, companionship, and intimate exchange (Parker & Asher, 1993). In fact, Parker and Asher showed some friendship features relate more to popularity and loneliness than others. The current study investigates individual features of friendships in order to provide a richer description of friendships of bilingual Latino college students. Research on friendship features has been limited by not focusing enough on emerging adults. We know much more about the friendship features of children and adolescents than adults (Hartup & Stevens, 1997). The few studies that have investigated qualitative features of emerging adults’ friend- ships are cited in this introduction. Emerging adulthood describes the period
  • 68. from late teens to late twenties when most individuals in current industrialized societies are still exploring aspects of their identity rather than achieving a stable adult identity (Arnett, 2004). Arnett (2007) has found this period to be less structured than adolescence or adulthood and more heterogeneous in terms of individual’s experiences of it. Friends, therefore, may be particularly important as emerging adults may need information from peers of a similar age who experience similar challenges rather than from family or authority figures who experienced a more abrupt transition to adulthood. Sebanc et al. / Friendship Features of Bilingual Undergraduates 195 at HOWARD UNIV UNDERGRAD LIBRARY on September 30, 2015jar.sagepub.comDownloaded from http://jar.sagepub.com/ Another limitation of friendship research in the United States is that researchers study White middle-class people more than people of color. Although several cross-cultural studies of friendships show that friendships vary with cultural traditions and beliefs (see Krappman, 1996 for a review), only a few researchers have studied the friendships of ethnic minorities in the United States. Studies of friendship quality of ethnic
  • 69. minorities have generally focused on children and adolescents and shown that same-race friendships have greater intimacy than cross-race friendships (Aboud, Mendelson, & Purdy, 2003) and that friendship quality increased over the high school years for all ethnicities but Latino adolescents reported the highest friendship quality (Way & Greene, 2006). When emerging adults have been studied, they have focused on in-group/out-group friendship choices rather than features of their relationship (e.g., Levin, VanLaar, & Foote, 2006). Ethnicity should be part of the friendship literature because emerging adults of color warrant research in their own right but also because some of our assumptions about friendships have been challenged when people of color have been investigated. For example, DuBois and Hirsch (1990) showed that Black adolescents had fewer friends at school but more extensive neighborhood friendship networks than Whites. In addi- tion, the gender difference commonly found in reports of positive friend- ship features (girls tend to report greater intimacy and support from friends than boys), were not found in Black adolescents. This study points to the fact that broad conclusions about friendships from only White samples can lead to biased judgments.
  • 70. Undergraduates of color may face unique challenges compared with White undergraduates and, therefore, require different kinds of support from their friends. Students of color report a variety of forms of differential treat- ment both in and out of the classroom during their college years (Suarez- Balcazar, Orellana-Damacela, Portillo, Rowan, & Andrews- Guillen, 2003). Research has shown that students of color have unique needs at college (Hertel, 2002) and that students with greater ethnic identity are more likely to negatively view the college environment and doubt their persistence in college (Castillo et al., 2006). Students of color are likely to be exploring aspects of their ethnic identity during emerging adulthood (Phinney, 2006). Finding support for this aspect of their identity and this stage in life may be difficult for students of color. The transition to college has been shown to be a period of instability in friendship because of losing old friends and making new ones (Bohnert, Aikins, & Edidin, 2007). Friendships with other students of color provide support and social integration in college that they do not receive from other sources (Martinez Aleman, 2000). We similarly expected 196 Journal of Adolescent Research
  • 71. at HOWARD UNIV UNDERGRAD LIBRARY on September 30, 2015jar.sagepub.comDownloaded from http://jar.sagepub.com/ that support from similar friends would be important to the bilingual Latino undergraduates in this study and that some of the support would be different than typical friendship features more commonly studied. The purpose of this study was to investigate the friendship features of bilingual English-Spanish speaking undergraduates. Because of the limited research on friendship features of emerging adults and college students of color, this research was primarily exploratory and descriptive. Our only working hypothesis was that friendships between bilinguals would offer more help, companionship, security, and closeness than bilinguals’ friend- ships with monolinguals. This hypothesis was based on previous research that adolescents have more intimacy with same-race friends than with cross-race friends (Aboud et al., 2003). Quantitative data was collected to test this hypothesis. A second goal was to further describe the features of friendships between bilingual Latino college students. To this end, semi- structured interviews were conducted and qualitative analyses were used to
  • 72. identify features of friendships that were important to participants who self- identified as bilingual in English and Spanish. Bilinguality is a multidi- mensional construct that is hard to define (Hamers & Blanc, 2000) and we allowed all students to participate who viewed themselves as fluent in speaking English and Spanish. Our combination of quantitative and quali- tative methods allowed us to situate the findings in past research of friend- ship features while also hearing the voices of bilingual Latino students themselves as they described their friendships. Method Participants A total of 46 bilingual (English and Spanish speaking) undergraduates (36 female, 10 male) participated. The average age was 20.6 years old and the youngest student to participate was 18 years and the oldest 27 years. Two nontraditionally aged students (36 and 51 years old) also were inter- viewed but were not included in this sample or the data analyses because they did not represent emerging adults or average college students. The majority of the participants were Latino (71.7%) or multiracial that includes Latino (10.9%) as self-identified in the background
  • 73. survey. There were also two African Americans (4.3%), two Whites (4.3%), one Asian American (2.2%), and two students who indicated other ethnicity (4.3%). Of the participants 42 (91.3%) of them were born in the United States and four Sebanc et al. / Friendship Features of Bilingual Undergraduates 197 at HOWARD UNIV UNDERGRAD LIBRARY on September 30, 2015jar.sagepub.comDownloaded from http://jar.sagepub.com/ participants were born in another country (8.7%).The majority of participants (58.7%) indicated that their parents had immigrated to the United States, as opposed to themselves (6.5%), their grandparents (10.9%), and their great grandparents (19.6%). Two of the students were international students who did not plan on becoming U.S. citizens and therefore did not answer the immi- gration status question. Mexico was the most common birthplace of parents (47.8% of mothers, 39.1% of fathers), followed by the United States (39.2% of mothers, 32.6% of fathers), and El Salvador (4.3% of mothers and fathers). Other Hispanic countries (e.g., Cuba or Guatemala) were only represented by one participant’s parent(s) each. Surprisingly, several non-
  • 74. Hispanic countries were birthplaces of participant’s parents (Romania, South Africa, and Thailand). This sometimes was due to mixed nationality and other times due to non-Latino participants, because of their fluent English and Spanish speak- ing. Parents’ and participants’ country of origin will be noted in the results sec- tion when it is not the United States or Mexico. All undergraduates attended a small residential liberal arts college in Southern California that is a Hispanic-serving institution. Latinos repre- sented 26.3% of the approximately 1,200 students enrolled during the two semesters when interviews were conducted. Students were primarily recruited in child development and Spanish classes by undergraduate research assistants making an announcement and circulating a sign-up sheet. Bilingual undergraduate research assistants sometimes made announce- ments in their own nonrelated classes if their professors allowed. Several signs about the study, with a phone number and e-mail were posted around campus. Students were also told in the class or by the sign that they would receive a wooden token for a free soda at the restaurant on campus as an incentive for participating. The majority of participants came from direct in- class recruitment or word of mouth (a friend participated and
  • 75. recommended) and not through flyers. The assistants asked if they spoke Spanish and con- sidered themselves bilingual in Spanish and English. If they answered yes, they placed their name, phone number, and e-mail on the sign- up sheet. If students asked what was considered bilingual, we told them that they con- sidered themselves fluent in English and Spanish. Procedure Undergraduate researchers contacted bilingual participants and sched- uled an appointment at a time when the participants had an hour to an hour and a half free. The interviews were conducted around campus at the par- ticipants’ convenience and in places of relative privacy. Participants were 198 Journal of Adolescent Research at HOWARD UNIV UNDERGRAD LIBRARY on September 30, 2015jar.sagepub.comDownloaded from http://jar.sagepub.com/ given a background survey first that asked about their country of origin, family background, language skills in English and Spanish, and the number of bilingual and monolingual friends. Undergraduate researchers then
  • 76. began the semistructured interview about their friendships that was audio- taped. After the interview, participants completed the Friendship Qualities Scale (FQS; Bukowski, Hoza, & Boivin, 1994) on their closest bilingual and monolingual friends. Measures Background survey. The background survey asked 22 questions about participants’ ethnicity, country of origin, family’s country of origin, immi- gration status, and language fluency. After indicating their age and gender, participants identified their ethnicity by writing in their own description on a blank line. This information was used to describe the participants in the previous section by categorizing answers according to U.S. Census cate- gories for Hispanic (Latino), African American, Asian American, White, or mixed race. Participants circled whether they were born somewhere else, or their parents, grandparents, or great-grandparents were born somewhere else and they were born in the United States. Answers to this question were used to indicate immigration status by rating the first as 1 (first generation American) and parents as 2, grandparents 3, and great grandparents 4. The mean for immigration status was 2.45 with a standard deviation of 0.90.
  • 77. They also answered “How many of your friends are bilingual?” and “How many of your friends are monolingual in English?” using a 5-point scale: none (0), a few (1), some (2), most (3), and all (4). Number of bilin- gual friends (M = 2.4, SD = 0.86) and number of monolingual friends (M = 2.1, SD = 0.89) were created from those answers. Finally, participants were asked to indicate their level of English and Spanish fluency on five tasks (speaking, reading, writing, conversation, and formal speech) on a 4 point scale (1 = not at all, 2 = with considerable effort, 3 = somewhat, and 4 = easily; see Table 1 for descriptive statistics). Because these measures were largely correlated with each other (.65 to .97 within each language), they were submitted to a principal components analysis with a varimax rotation and produced two factors: English fluency and Spanish fluency. Eigenvalues were greater than 2.5. Semistructured interview. The interview consisted of a series of 35 ques- tions in English (see Appendix A). The questions on the interview were developed after a focus group with six Latina students was conducted by Sebanc et al. / Friendship Features of Bilingual Undergraduates 199
  • 78. at HOWARD UNIV UNDERGRAD LIBRARY on September 30, 2015jar.sagepub.comDownloaded from http://jar.sagepub.com/ 200 Journal of Adolescent Research the authors. Two of the pilot participants also participated in the current study. After meeting with pilot students, all questions of interest were given to three Latino/a faculty at the college and asked for feedback on the ques- tions. The final interview asked about social interactions (and participation in Spanish language activities), friendships in general, differences between bilingual and monolingual friendships, and about their closest bilingual friend in particular (see Appendix A). Although the interview was fairly structured, research assistants asked follow-up questions and engaged in some conversation with the participants. The audiotapes of the interviews were transcribed by undergraduate assistants. The second author, an undergraduate researcher at the time, read and corrected all transcripts while listening to the interviews and completed the transcription of one where the participant answered several questions in Spanish. The Spanish in that transcript was then translated back into English
  • 79. by a modern language professor at Whittier College. The first author then read all transcripts, taking notes for common themes, particularly about friendship features, using a phenomenological approach. Several themes came up over and over again and were listed in a notebook. Anytime an interviewee discussed a more traditional friendship feature was also tracked. The themes seemed to cluster into the reasons for bilingual friendships or why they offered more support than their friendships with monolinguals. After the first and second author discussed the themes, we labeled them as follows: understanding/entendimiento, connection/conexión, and identifica- tion/identificacion. The first author then read all transcripts again to find examples of these three additional features of bilingual friendships. Friendship features were mainly discussed by participants in answer to the following four questions: Table 1 Means (Standard Deviations) for English and Spanish Fluency Questions Mean for English (SD) Mean for Spanish (SD) Speak fluently 3.9 (0.63) 3.4 (0.81) Read college textbooks 3.8 (0.63) 2.8 (1.03)
  • 80. Write college papers 3.8 (0.70) 2.4 (1.10) Complete conversation 3.8 (0.63) 3.3 (0.85) Formal speech to high 3.8 (0.65) 2.8 (1.1) school students at HOWARD UNIV UNDERGRAD LIBRARY on September 30, 2015jar.sagepub.comDownloaded from http://jar.sagepub.com/ (10) Does the quality of your friendship with bilinguals differ from your friendships with monolinguals? How?, (16) Does it help you to have bilin- gual friends? How?, (19) After discussing your bilingual friendships, why do you think you have bilingual friends?, and (30) Does being bilingual affect the intimacy of your (closest bilingual) friendship? In what way? The entire interview, however, was read for relevant data and friendship features were noted at any point during the interview. While reading the interviews a second time, another theme emerged that was only tangentially related to friendship features. Several students discussed the sociopolitical conditions that affected their friendships (in most cases made them seek friendships with other bilinguals). Examples of answers that related to discrimination or particular social pressures of bilingual Latinos were noted and will be
  • 81. discussed in the last section of the results, Sociopolitical Context. Participants were given a pseudonym in the results keeping the same name throughout if they are quoted more than once. Friendship Quality Scale (FQS). Participants answered 39 questions from the FQS (Bukowski et al., 1994) about their closest current bilingual and monolingual friendships. At the top they were asked to chose their clos- est current bilingual and monolingual friendships and place their names at the top. Each item was only repeated once next to two scales (numbers 1 to 5 under the names of their closest friends). The FQS measures five aspects of friendship quality: closeness, security, help, companionship, and con- flict. Means were created for each of these variables for the closest bilin- gual friend and monolingual friend. Missing Data Two students’ interviews could not be transcribed because the tapes were defective. Their results are included in the quantitative analyses of the friend- ship quality questionnaire. One student did not complete the background survey or friendship quality questionnaire because of time constraints. His information is included in the qualitative analyses of the interviews only.
  • 82. Results Quantitative analyses are presented first in the discussion of friendship features and their correlates. Qualitative analyses follow in discussion of three additional friendship features or reasons why bilingual friendships Sebanc et al. / Friendship Features of Bilingual Undergraduates 201 at HOWARD UNIV UNDERGRAD LIBRARY on September 30, 2015jar.sagepub.comDownloaded from http://jar.sagepub.com/ 202 Journal of Adolescent Research were important to those interviewed. One further qualitative analysis provided information about the particular sociopolitical context of these friendships. Quantitative Analyses: Friendship Features and Their Correlates Paired sample t tests were conducted to determine whether there was a difference between participants’ closest bilingual and monolingual friends on the five features in the FQS. Bilingual students reported greater com- panionship, security, help, and closeness with their closest bilingual friend
  • 83. compared with their closest monolingual friend (see Table 2). There was no significant difference between friends based on conflict. Correlations among friendship features with monolingual and bilingual friends were largely significant, indicating that the way individuals scored friendship features of their bilingual friend was related to the way they reported friendship features of their monolingual friend. Conflict, close- ness, help, and security with bilingual were all significantly correlated with the same friendship feature with monolinguals (see Table 2). These two sets of results show that participants may rate their closest bilingual friend higher than their closest monolingual friend but the scale the participants use for each friendship feature is similar (compared with other partici- pants). In other words, rank order of participants on each friendship feature Table 2 Comparison Between Closest Bilingual and Monolingual Friends: Means (Standard Deviations), Paired t Tests, and Correlations for Friendship Qualities Scale Closest Closest Correlation Bilingual Monolingual Between Friend Friend Paired Bilingual and Features Mean (SD) Mean (SD) t Test Monolingual
  • 84. Closeness 4.48 (0.60) 4.08 (0.80) 3.63*** .47*** Companionship 4.11 (0.87) 3.46 (0.98) 3.68*** .17 Security 4.52 (0.58) 4.23 (0.71) 2.61* .36* Help 4.50 (0.60) 4.24 (0.73) 2.67* .50*** Conflict 2.00 (1.01) 1.95 (0.93) 0.47 .64*** Note: n = 45. *p < .05. **p < .01. ***p < .001. at HOWARD UNIV UNDERGRAD LIBRARY on September 30, 2015jar.sagepub.comDownloaded from http://jar.sagepub.com/ Sebanc et al. / Friendship Features of Bilingual Undergraduates 203 is similar for both friendships. The correlation for conflict (r = .64), however, may be exaggerated as conflict was rated low by practically all participants, therefore there was a limited range of answers. Additional correlations were conducted to determine whether partici- pants’ background characteristics (English fluency, Spanish fluency, number of bilingual friends, number of monolingual English- speaking friends, and immigration status) were related to the friendship features (with bilingual or monolingual friends). First, background characteristics were correlated with each other. Spanish fluency was negatively
  • 85. related to number of monolingual English friends (r(46) = −.35; p < .05) and immi- gration status (r(46) = −.54; p < .001). Participants who were first or sec- ond generation U.S. citizens rated their Spanish fluency as higher but the number of English-only speaking friends lower than those who were third or fourth generation. No other background characteristics were signifi- cantly related to each other. Background characteristics were correlated with the friendship features (see Table 3). Spanish fluency was related negatively to bilingual conflict Table 3 Correlations Between Background Characteristics and Friendship Features Number of Number of Spanish English Immigration Bilingual Monolingual Fluency Fluency Statusa Friends Friends Bilingual friendship features Closeness −.10 −.09 −.02 .30* .02 Companionship −.04 .06 −.06 .48*** −.19 Security −.08 −.09 −.03 .35* −.05 Help −.16 −.15 −.08 .44** −.08 Conflict −.39** .05 .20 −.04 .14 Monolingual
  • 86. friendship features Closeness −.14 −.15 .26+ −.22 .40** Companionship −.18 −.04 .43** −.20 .41** Security −.10 −.14 .15 −.31* .45** Help −.09 −.17 .05 −.19 .30* Conflict −.29+ .07 .30* −.10 .23 a. n = 44 except for immigration status where n = 43. +p < .10. *p < .05. **p < .01. ***p < .001. at HOWARD UNIV UNDERGRAD LIBRARY on September 30, 2015jar.sagepub.comDownloaded from http://jar.sagepub.com/ with friends and there was a trend that it was related to monolingual con- flict as well. English fluency was not significantly related to any friendship feature. Immigration status was related positively to companionship and conflict in monolingual friendships. This result indicates that the longer their family lived in America, the greater companionship and conflict par- ticipants had with monolingual friends. Number of bilingual friends was related positively to companionship, help, security, and closeness with bilingual friends and negatively to security with monolingual friends. Similarly, number of monolingual friends was related positively to com- panionship, help, security, and closeness with monolingual
  • 87. friends but not to bilingual friendship quality. Qualitative Analyses: Three Additional Features of Bilingual Friendship The majority of bilingual Spanish-English speakers interviewed reported positive features of their friendships with other bilinguals and greater impor- tance of having bilingual Latino friends. The participants discussed features in their friendships that were not described in traditional friendship quality scales. These three features we called understanding, connection, and identi- fication. These features had more to do with what their similarities meant for their relationship or why they sought friendships with other bilinguals. Each feature will be discussed separately in the results although they are obviously interconnected. We also discuss more traditional features that were brought up by the participants that support the results of the quantitative data throughout these sections. Understanding/Entendimiento. “How would that [being bilingual] help the friendship? Just because that person can relate and understand what I am saying.” (Melissa) Not surprisingly, many students discussed their bilingual friends under-
  • 88. standing the languages they spoke, both English and Spanish, as a great advantage to those relationships. This provision of friendship, we called “understanding” in order to include two ideas commonly considered a ben- efit of bilingual relationships: (a) being able to use both languages with each other and (b) not having to translate thoughts and feelings. The second aspect of understanding went beyond the literal knowledge of two lan- guages and also applied to their friends knowing where they came from and their background. Bilingual friends did not require explanations and trans- lations as monolingual friends did. Understanding by their bilingual friends 204 Journal of Adolescent Research at HOWARD UNIV UNDERGRAD LIBRARY on September 30, 2015jar.sagepub.comDownloaded from http://jar.sagepub.com/ contributed to the closeness of these friendships, especially through intimacy and sharing. A large benefit of having a bilingual friend was not having to translate for the friend. Many expressed that the right word was often found in Spanish and could not be translated to English. Jose was asked
  • 89. when he spoke Spanish with his friends, “When there’s, like, something you can’t really say in English, like, it doesn’t make sense, but then in Spanish, it makes sense.” In response to the same question, Maria explained, ’Cause in Spanish there is like a lot of dichos, like sayings, that I don’t, I have never heard a translation of that in English. See and if sometimes, if I want to get my point across and, like, you think of something you heard in your upbringing, that would be a time [we speak Spanish] . . . Because you can’t translate everything word for word, because it loses it’s meaning. Being able to use their primary language with friends assured that they could impart exactly what they meant to their friends. Translation was often viewed as something that got in the way of closeness with friends who did not speak Spanish. Speaking Spanish led to more intimacy with their bilingual friends because it involved discussing more emotions than speaking English. Javier said, “My own personal history is revealed when I do speak in Spanish. You know, when I speak about being younger, uh, I just happen to speak it in Spanish.” Spanish is often their primary language and therefore
  • 90. is both the first language they spoke as well as the main language spoken at home with their families. Certain topics, therefore, may be reserved for only one lan- guage, Spanish. One Cuban student, Vanessa, put it this way, It seems easier to communicate a lot of feelings. And, I don’t know, if that maybe the vocab. is larger or there’s just more words in Spanish. It seems that words in Spanish are a lot more expressive so I guess I could express more to my friends that speak Spanish Greater intimacy with bilingual friends was often reported because students could express more feelings and memories in Spanish. Interestingly, most students discussed how important it was that their friends speak Spanish and not that they also speak English. Almost all par- ticipants said they used English more often than Spanish with their friends. Even though they spoke Spanish less frequently, the ability to code switch and say exactly what they wanted to made these friendships closer and more intimate than their friendships with monolinguals. Not all participants Sebanc et al. / Friendship Features of Bilingual Undergraduates 205 at HOWARD UNIV UNDERGRAD LIBRARY on September
  • 91. 30, 2015jar.sagepub.comDownloaded from http://jar.sagepub.com/ 206 Journal of Adolescent Research discussed how sharing Spanish led to more intimacy like the examples above. Nonetheless, they described topics they discussed with their friends that may increase closeness. For instance, Karen, who is actually Asian and speaks Spanish because a Latino family raised her, said, I can speak to them in the language that we share. We can do like those inside jokes like when only that person and I speak Spanish, no one else. We can talk about those other people in Spanish [giggles] Like this student, most students reported both joking and gossiping in Spanish with bilingual friends. Both these activities may increase intimacy of these friendships. Connection/Conexión. “It’s just having a connection with somebody if they speak . . . Spanish, they have a tradition behind them. It’s like their parents are strong. They are raised kind of in the same way you were, with a lot of similarities.” (Juan) The sense of similarity and connection within bilingual
  • 92. friendships res- onated through most participants’ interviews. The two types of connection that seemed most important to participants, as the above quote demon- strates, were family and culture. This section will focus on connection to family in its many meanings: bilingual friends became like family, they participated in family activities, their families liked each other, and they had a greater sense of similarity because their families were alike. We will also discuss how this sense of connection leads to other friendship features such as help and companionship. Culture will be discussed more in the next section on identification but we will touch on it here as it is tied to family and the activities that they share. Connection was often understood in familial or relatedness terms. Some students used fictive kin terms for their bilingual friends. A few students mentioned that their bilingual friends were like siblings or cousins. This was in addition to having more connection to each other’s family because of their ability to speak Spanish with them. Olivia showed how relatedness would not apply to her monolingual friends. “Well, monolinguals are dear to me too. Like, I care for them. But, they’re not, like, they wouldn’t be like my sister.” Other students used the concept “relating better” to
  • 93. explain why they had bilingual friends. “[My friends being bilingual] makes me feel comfortable with them, being more open. That they are part of my culture and an aspect, that I can, there’s something I can relate to them, like that special tie,” explained Gina. Many other participants also discussed how relating better to their bilingual friends led to more comfort in those relationships. at HOWARD UNIV UNDERGRAD LIBRARY on September 30, 2015jar.sagepub.comDownloaded from http://jar.sagepub.com/ Sebanc et al. / Friendship Features of Bilingual Undergraduates 207 Another aspect of connection was that having bilingual friends allowed students to connect their peer network and their family. Vanessa reported “I could do more family related things with my bilingual friends ’cause they come from similar cultures so they could understand that we are more fam- ily centered so we could visit with each other’s families more.” Family activities were still seen as important to these bilingual Latino undergradu- ates. Olivia put it this way. I open a lot more to bilingual people because they could talk to
  • 94. my mom. So, like, my mom is really special to me, so if you can talk to my mom, of course, you’re gonna be close to me. The importance of family to these Latino students was clear in most interviews. These students wanted to involve their parents in their activities and felt language barriers with monolingual friends and the college context. Their bilingual friends also became better companions for them because they participated in more activities together. Feelings of connection also seemed to lead to more typically studied positive friendship features such as stability, help, and support. Cindy, whose parents are from El Salvador, said, I’ve noticed that my bilingual friends that I had, I’ve had for years and years and years. And my monolingual friends, it usually doesn’t last very long. I don’t know why. I never really thought about it until today. Um, I just hap- pen to have more friends that are bilingual just ‘cause of that similarity between us, I guess. The fact that these relationships last longer may attest to their positive features. Several students described how bilingual friends help them. Susan described the support she receives from bilingual friends, “they
  • 95. know how to relate to me so it just helps. It gives you peace of mind to know there’s people like you.” Help and support were commonly mentioned as some- thing that bilingual students received more from their bilingual friends than monolingual friends. Very few discussed direct aid except with Spanish classes or sometimes college classes in general. Most students discussed indirect aid through supportive feelings or their friends “being there” for them when they were needed. Identification/Identificación. “I got to have that trust and that understand- ing. Like, you know what, you care about other people’s cultural linguistic identity. And so to me, that all comes back to identity and you know who we really identify with.” (Javier) at HOWARD UNIV UNDERGRAD LIBRARY on September 30, 2015jar.sagepub.comDownloaded from http://jar.sagepub.com/ Although only a few students directly mentioned identification or iden- tity in relation to their friendships, many discussed aspects of their identity and how other bilinguals affirmed them. In this section, we focus mostly on bilingual students’ cultural and linguistic identity. These themes
  • 96. emerged in both understanding and connection but we focus on them here. This section discusses how bilingual friendships were important to them as an individ- ual, especially in relation to their identity development and cultural pride, rather than to their relationship. Bilingual friends attended important cultural activities with our partici- pants. Rocio said that her bilingual friends could go, To los bailes, you know dancing to the kind of music that you listen to, or just going to any festivals, like maybe they have festivals at church or maybe like events that we go to. Posadas [Traditional Christmas events] or, like, stuff like that. Many students reported that there were cultural events or even types of night clubs that they would take their bilingual friends and not their mono- lingual friends. Bilingual friends, therefore, provided more companionship because they went with them to these events. Furthermore, these events were important because they gave our participants a sense of pride in their ethnolinguistic identity. Others discussed that it was their friends that brought out their cultural pride and speaking of Spanish. Many students mentioned that
  • 97. bilingual friends protected them from losing Spanish. Susan, in particular, was led by her closest bilingual friend to speak Spanish. “If anything, she is the one that pushes me to speak more Spanish. Yeah, she calls me a ‘gringa’ and says I need to learn more Spanish.” She goes on to discuss how this friend has led her to partake in more traditional cultural activities. She’s more comfortable in, like, like, going to places where they play, like, Ranchero music where I wouldn’t feel that comfortable. Like, she, she’ll take me there, . . . I say ‘Oh, you’re more Mexican than me’ . . . well, no, I’m not saying that I’m not Mexican [laughing] but, like, she’s kind of more in tune with her culture than I am. By speaking Spanish and attending more traditional Mexican activities, this friend seemed to be invigorating her friend’s cultural identity. This shows the mutual socialization of friends; friends are directly affecting each other’s ethnolinguistic identity. 208 Journal of Adolescent Research at HOWARD UNIV UNDERGRAD LIBRARY on September 30, 2015jar.sagepub.comDownloaded from http://jar.sagepub.com/
  • 98. Sociopolitical Context The broader context, including social, political, and cultural, was men- tioned by participants as something that made their friendships important, motivated them to seek bilingual friends, and threatened their ethnic pride. The college environment to some was less Latino-friendly than their old hometown while for others there was more access to bilingual peers. Several discussed political and social pressures to speak Spanish with other Latinos but not have a Mexican accent around Whites. There was a sense of being pulled between two identities: Mexican (or other Latino country) and American. A few explicitly discussed how the majority culture in the United States did not support their ethnolinguistic identity. Again, bilingual friends were seen as helpful with these challenges. Participants varied in whether they viewed the college as friendly to Spanish speakers. Rachel shared that having bilingual friends, “helps me practice my Spanish because, I mean here in Whittier you rarely speak Spanish. Yeah. I find myself making up words that don’t exist in Spanish and my mom gets mad at me for doing that.” College in the United States is dominated by English and, perhaps, students adopt an
  • 99. increased use of English in this context. Others had the opposite experience in that where they came from had fewer Spanish speakers than Whittier College which is a Hispanic serving institution. Monica, whose Dad is from Puerto Rico and who grew up in Colorado, said this about being friends with more bilinguals in college, It helps me like, look at parts of my culture that I didn’t look at before. In Colorado, it’s just, people call me coconut sometimes because, like, I am brown outside and White in the inside. ‘Cause over there everybody is just, like, um, no-nobody speaks Spanish. The diversity of our participants showed that not everyone perceived the same sociopolitical context on campus. The larger sociopolitical context of the United States was brought up by a few students directly. Several participants discussed being looked down on by the majority Whites and more-acculturated Latinos for speaking Spanish. Olivia commented on having a Mexican accent, “Like yeah, a Spaniard accent, you’re considered elite but if you have a Mexcian accent, you’re like uneducated . . . so I think there’s that stigma that we kind of have to go
  • 100. above.” Being called coconut or gringa by Latinas as previously mentioned can be seen as the opposite side of the conflict. Many expressed fear of losing Spanish and the threat to their language may be real especially in California Sebanc et al. / Friendship Features of Bilingual Undergraduates 209 at HOWARD UNIV UNDERGRAD LIBRARY on September 30, 2015jar.sagepub.comDownloaded from http://jar.sagepub.com/ considering bilingual education was removed from schools. Clearly, there are pressures from acculturated Americans to speak English without a Mexican accent and pressures from fellow Latinos to retain their cultural and linguistic heritage. The Latino college students in our sample seem to be wedged in this gap and some of them felt the pressure. Others discussed discrimination that bilingual Latinos face in America explicitly. Javier, a particularly politically active student, discussed why he relates better to bilinguals, “By knowing more bilingual people I under- stand what discrimination they have gone through or what kind of ordeals they have gone through that are maybe different than mine but at the same
  • 101. time very similar.” When talking about joking in English, he said, We try to seek humor to you know comfort our wounds with like living in a racist institution . . . So I mean if our joke is in English, but at the same time it is used as a way of critiquing and very much critiquing like you know the English dominancy but also we also joke in Spanish and you know like, we just, we think jokes are good in any language. This student clearly articulates perceptions of racism in his sociopoliti- cal context. He also uses humor with friends to cope or turn his status into strength. In other students’ interviews, there were many hints that students felt a clash between being Latino or speaking Spanish and being American. Their bilingual friends probably felt this clash too or at least were in the same situation. Discussion The quantitative findings clearly show that bilingual students view their friendships with bilingual friends as more positive than with monolingual friends. The quantitative findings were confirmed and extended by the qual- itative findings. During interviews, bilingual students discussed positive fea- tures of bilingual friendships but these included features of
  • 102. friendships not commonly studied by friendship researchers. Understanding, connection, and identification were often mentioned as reasons for friendships with other bilinguals and why those friendships offer more support than friendships with monolinguals. These findings can encourage friendship researchers to consider other features of friendships than those most commonly studied. Closeness, security, help, and companionship were all reported as greater in friendships with another bilingual than with a monolingual. This 210 Journal of Adolescent Research at HOWARD UNIV UNDERGRAD LIBRARY on September 30, 2015jar.sagepub.comDownloaded from http://jar.sagepub.com/ was true in spite of the fact that their friendship perceptions were highly related to each other. In other words, if a participant viewed their closest bilingual friend high on security than she viewed her closest monolingual friend similarly. Conflict did not differ between bilingual friendships and monolingual friendship but was related to less Spanish fluency. Participants who believed they were highly fluent in Spanish were also more
  • 103. likely to have an earlier immigration status (first or second) and had a lower number of monolingual English speaking friends. These participants may represent less acculturated students who do not identify with the conflict questions in the FQS or do not fight with friends. The number of bilingual and mono- lingual friends was strongly related to positive features. The more friend- ships participants had with bilinguals, the greater they rated their closeness, help, security, and companionship with bilinguals; the same was true with number of friendships with monolinguals and monolingual friendship qual- ity. Perceptions about the number of friendships with a similar or different peer may reflect quality and satisfaction with those friendships and not sim- ply number of friends they have. During the interview, participants clearly voiced the importance of find- ing similar friends, in this case, linguistically (and usually ethnically) simi- lar. Sharing Spanish with friends was particularly important to our bilingual participants. First, sharing their primary language aided in their friends’ understanding of them both linguistically and emotionally. Second, sharing Spanish and a similar cultural background also helped students connect their friends with their family. Desiring connection between friends
  • 104. and family is a component of friendships that researchers probably miss when studying White middle class participants with a more individualized sense of identity. Other research has shown that connection to family can be as important as individuation for some college students, especially women (Kenny & Donaldson, 1991). Latino students similarly may want to maintain close family ties while also increasing their autonomy in ways that promote their culture’s more familial or collectivist values (Phinney, 2006). The emphasis on connection for our participants may be because of their Latino culture or the preponderance of female participants in our sample. Identifying with their friends was one of the main reasons participants reported having or preferring bilingual friends. When they discussed iden- tifying with their friends, it was often in terms of the way their cultural or linguistic identity was affected by their friends. Students discussed mutual socialization as part of their friendship experiences. Some friends encouraged participants to attend more traditional Latino cultural events and others encouraged them to shop at mainstream American stores. Most encouraged Sebanc et al. / Friendship Features of Bilingual Undergraduates 211
  • 105. at HOWARD UNIV UNDERGRAD LIBRARY on September 30, 2015jar.sagepub.comDownloaded from http://jar.sagepub.com/ 212 Journal of Adolescent Research them to retain their Spanish speaking abilities. Similarity between friends, therefore, was likely to increase over time and not just be a part of friend- ship selection. Friendships between those who have similar cultural back- grounds may be particularly important during emerging adulthood. This developmental stage has been theorized to be dominated by identity explo- ration, instability, self-focus, feeling in-between, and possibilities (Arnett, 2007). We see that most, though not all, bilingual college students attempted to incorporate ethnolinguistic pride into their identity and that their friendships with other bilinguals helped them with that goal. In some ways, friendships can be seen as a context for cultural trans- mission and not just a product of the cultural context. The friends in this study mentioned identifying with their friends as well as being influenced by them. Friendships are an interesting context to study cultural transmis-
  • 106. sion because they are outside other societal institutions, such as family and work, and yet an institution themselves governed by cultural values (Krappman, 1996). Some of our participants sought to maintain the lan- guage their families speak because they viewed the sociopolitical context as hostile and that their identity was at risk in the United States or in college. By establishing friendships with similar peers, bilingual Latino students may be creating a space that fills the gap between their family’s culture and mainstream White culture. This may partly explain why those with more bilingual friends had greater friendship quality with their closest bilingual friend. The effects are likely to be bidirectional: choosing more bilingual friends may reinforce the importance of their bilinguality for friendship and vice versa. Friendships among people of color may in part socialize each other to have ethnic pride or prepare them for bias and discrimination in ways that have been found with Latino and African American parents (Hughes, 2003). Although there is some research about the influence of children’s friends on racial attitudes (e.g., Aboud & Doyle, 1996), the ways friends directly teach each other about discrimination and ethnic pride merits further study.
  • 107. Looking at a particular group of bilingual college students allows us to see both the diversity and similarity of friendship experiences. The three themes of understanding, connection, and identification represent the majority of participants’ answers; however, not all discussed these three themes. A small minority of participants said their friendships with mono- lingual and bilingual friends were of equal quality or that linguistic identity was not important to their friendships. These students may be more accul- turated than the rest of the bilingual students in our study. Diversity was at HOWARD UNIV UNDERGRAD LIBRARY on September 30, 2015jar.sagepub.comDownloaded from http://jar.sagepub.com/ Sebanc et al. / Friendship Features of Bilingual Undergraduates 213 also seen in who brought up the sociopolitical context directly. Some par- ticipants discussed the sociopolitical context explicitly and those who did expressed feelings of frustration, discrimination, and bicultural stress. Perhaps these students experienced more discrimination or had more awareness of potential threats to their ethnolinguistic identity. Straddling
  • 108. same-ethnic peer groups and school environments at the same time has been shown to be a successful coping mechanism for Latino students (Carter, 2006). The participants who did not discuss bicultural stress or dis- crimination may be successfully straddling mainstream White American and their family’s cultures or may not be exploring their ethnic identity dur- ing emerging adulthood. Our conclusions are tempered by the fact that our interview was designed to ask students about the features of their friendships. We did not ask direct questions about their feelings of discrimination on campus or in society. The fact that these issues sometimes came up may mean that they were an important aspect of these friendships and the sociopolitical context was affecting these relationships. In addition, the interview seemed to lead students to discuss the positive features rather than the negative features of their friendships. Although one question about negative aspects of having bilingual friendships was asked, few ever discussed specific ways that it was negative. Another limitation of the present study is that we used a con- venience sample of college students who volunteered for a small incentive. These students may not represent all bilingual college students and cer- tainly do not represent all emerging adults because many do not
  • 109. attend col- lege. Phinney (2006) posits that ethnic minorities who do not attend college may not explore their ethnic identity or may be less likely to experience the stage of emerging adulthood. Our sample size was also small by quantita- tive standards and therefore, we may not have an accurate representation of Latino college students. The way we selected participants was also potentially biased because we recruited participants who identified themselves as bilingual. Participants rated themselves as largely fluent in speaking English and Spanish but only somewhat fluent in college level writing, reading, and formal presentations in Spanish. On average, our bilingual participants showed “dominant bilin- guality” or greater competence in one language over another (Hamers & Blanc, 2000). Our descriptive statistics clearly show a range in fluency, especially in Spanish skills, and therefore, we cannot be sure to what degree our participants represent typical bilingual undergraduates. Also, because we recruited for bilingual status, participants did not have to identify themselves at HOWARD UNIV UNDERGRAD LIBRARY on September 30, 2015jar.sagepub.comDownloaded from http://jar.sagepub.com/
  • 110. as Latino. We saw greater diversity of the sample and their friends than we were expecting. Several participants were not Latino but only one of those was quoted in the qualitative results section and she was raised by a Latino family. More than 80% identified themselves as Latino or partly Latino. Given our sample, it was impossible to tease apart linguistic and ethnic identity and their influence on friendships. When comparing their friends, some students selected Spanish speakers as monolinguals and Latino English speakers as monolinguals. Because of this complication, we were unable to offer conclusions about whether similarity of ethnicity, language, or culture was more important to our participants. Research on a larger sample that could explore some of these differences would help determine the important characteristics in having a bilingual friend. Despite these limitations, both the quantitative and qualitative data pointed to greater quality and comfort in friendships with other bilinguals than with monolinguals. Researchers may want to further study under- standing, connection, and identification in friendship processes of emerg- ing adults of color or to compare same-ethnic and cross-ethnic friendships.
  • 111. In addition to providing greater understanding, connection, and identifica- tion, most participants valued their friendships with other bilinguals and gained a sense of ethnic and linguistic pride from them. Friendships empower students of color in ways researchers are only beginning to under- stand. Because other research on undergraduates of color has suggested that having only same-race friendships is problematic for academic achieve- ment (Levin et al., 2006), more research is needed to address how same- ethnicity friends can provide greater security and more help and yet may create ethnic segregation on college campuses. Appendix A Semistructured Interview Questions Social Interaction Questions 1. Which activities are you involved in: a. At school: b. In your community: 2. Where do you go shopping for groceries? 3. If you were going out on a Friday night with your friends, where would you guys go? 4. Do you attend mass service in Spanish or English? 5. Which Spanish language TV programs do you watch? 6. Which English language TV programs do you watch? 7. Which Spanish music stations do you listen? 8. Which Spanish language newspapers or magazines do you read?
  • 112. 214 Journal of Adolescent Research (continued) at HOWARD UNIV UNDERGRAD LIBRARY on September 30, 2015jar.sagepub.comDownloaded from http://jar.sagepub.com/ Sebanc et al. / Friendship Features of Bilingual Undergraduates 215 Appendix A (continued) Questions Comparing Bilingual And Monolingual Friendships 9. What are some of the things you can do with bilingual friends that you can’t do with monolingual friends? 10. Does the quality of your friendship with bilinguals differ from your friendships with monolinguals? How? Questions About Bilingual Friendships 11. When do you use Spanish with your bilingual friends? 12. When do you use English with your bilingual friends? 13. How often do you switch languages in your bilingual friendships? 14. Does language switching affect your friendship in any way? If so, how? 15. Did you ever feel like it was hard to make friends with people who were not bilin- gual? Why?