Downloaded 236 times
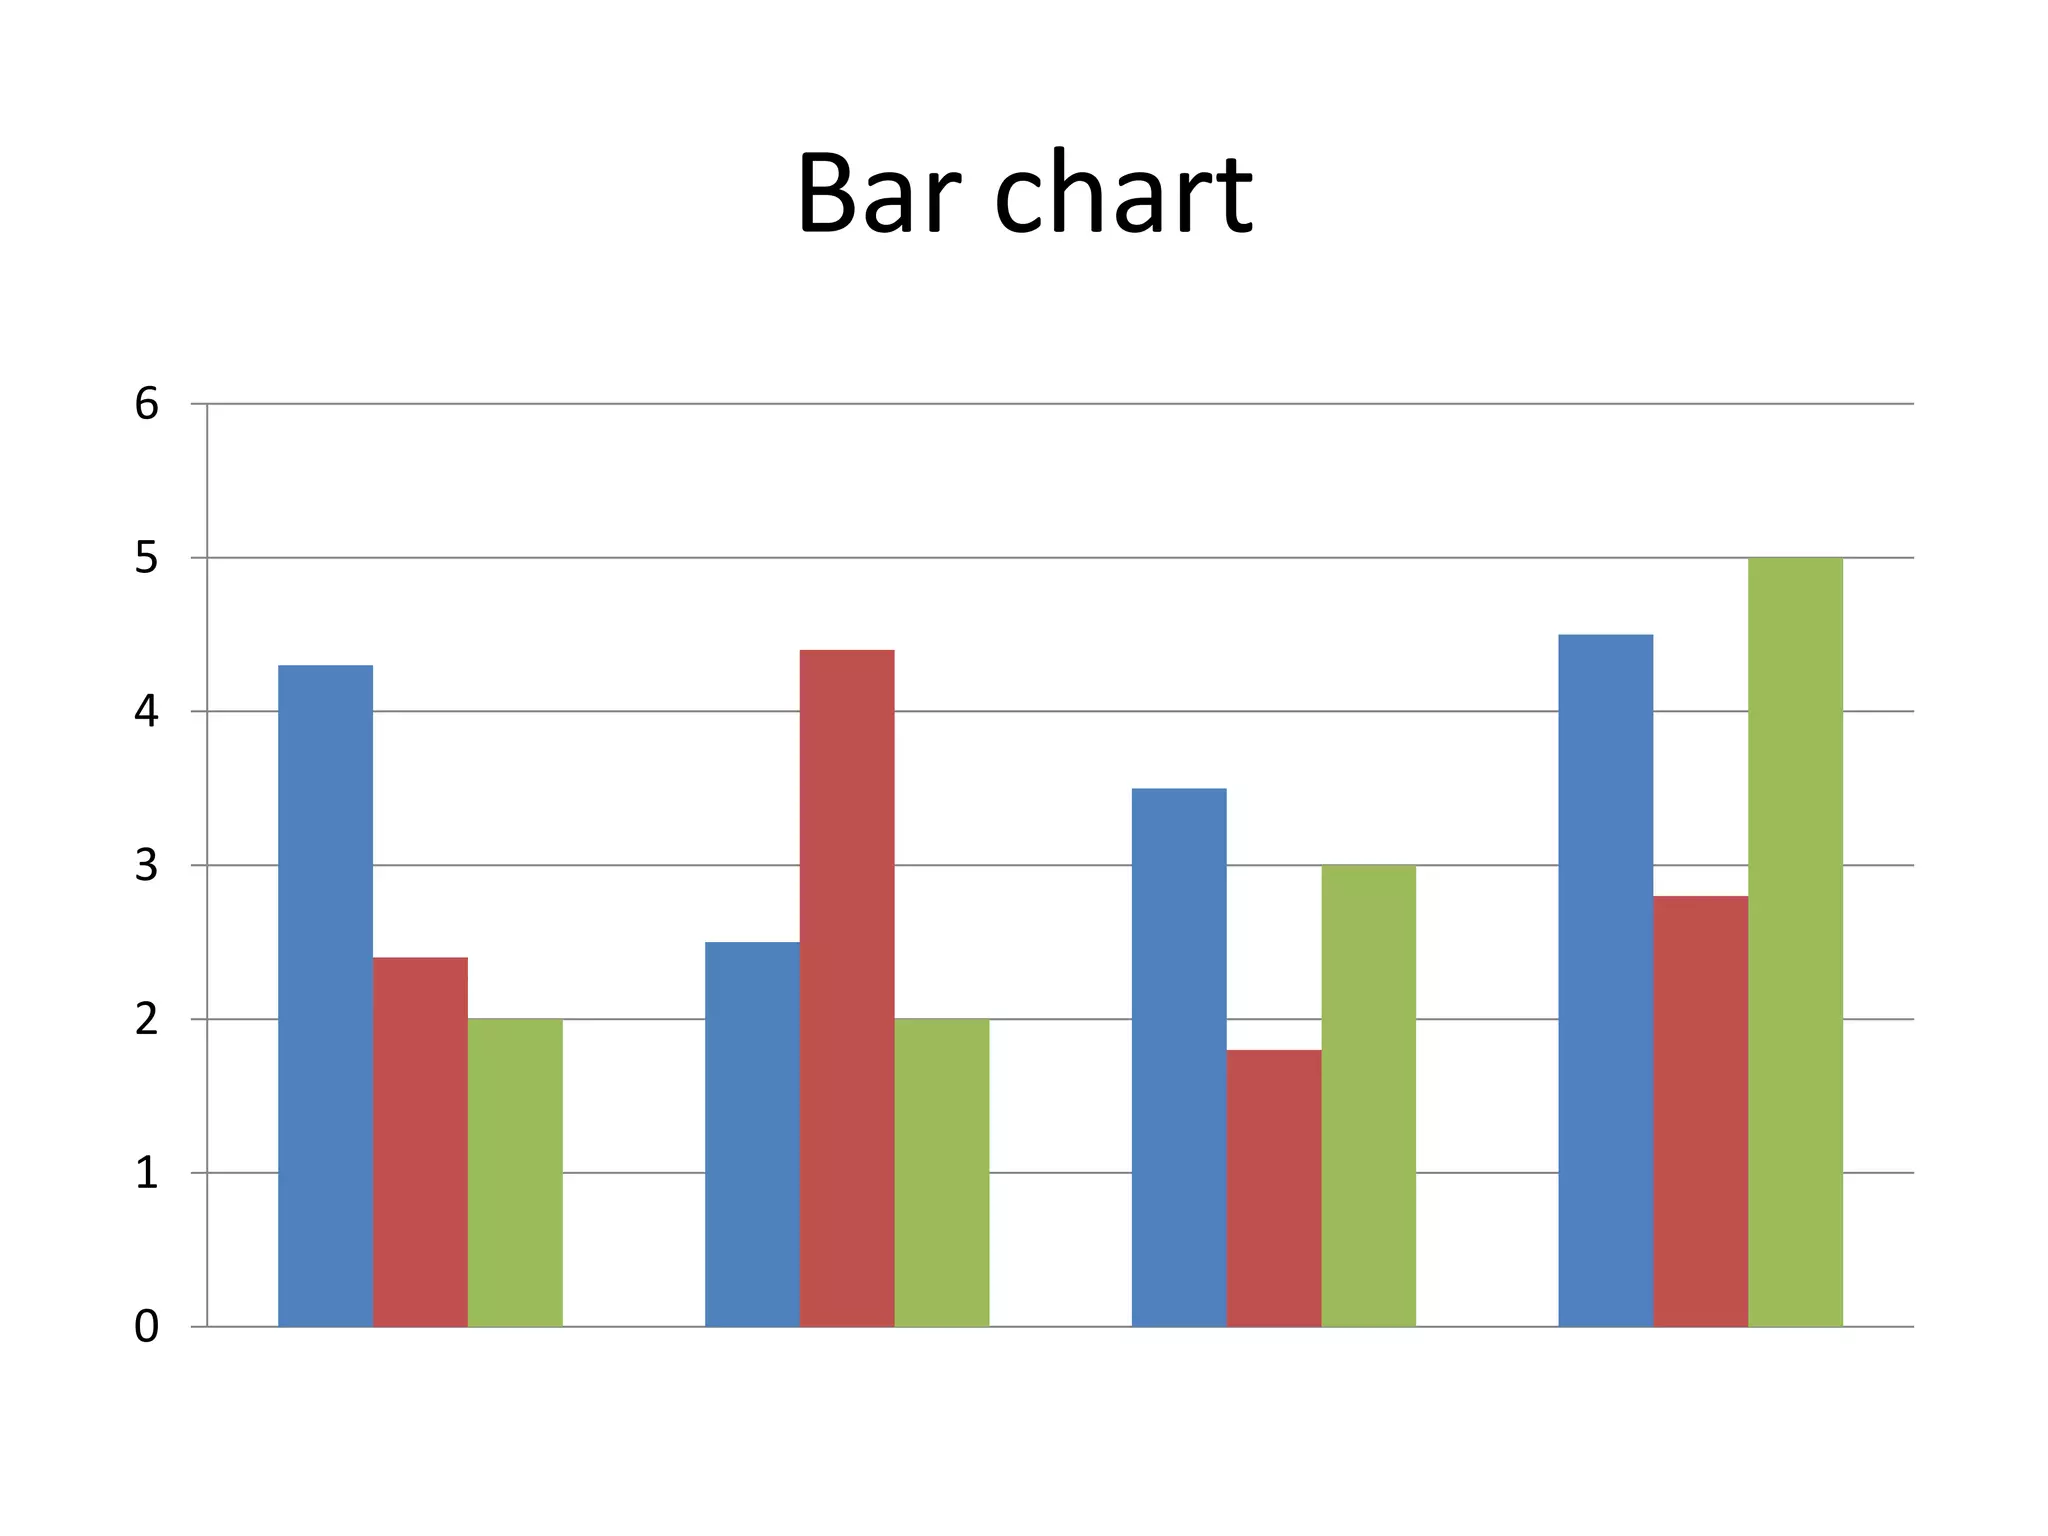


The document describes different types of graphs used to represent data visually, including bar charts, pie charts, line graphs and tables. It also lists terms commonly used to describe trends in data, such as upward trends like increase and rise, and downward trends like decrease and decline. Finally, it provides examples of prepositions, approximations, verbs and phrases used to discuss and analyze graphs and data trends.