1. Derivative Report
India Research
April 07, 2010
Comments
Nifty Vs OI
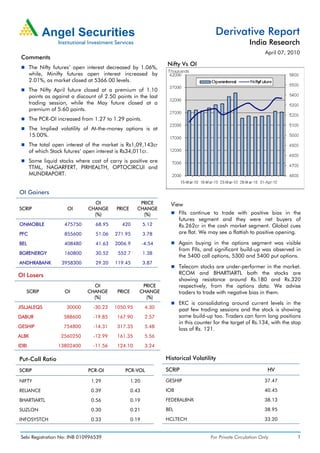
The Nifty futures’ open interest decreased by 1.06%,
while, Minifty futures open interest increased by
2.01%, as market closed at 5366.00 levels.
The Nifty April future closed at a premium of 1.10
points as against a discount of 2.50 points in the last
trading session, while the May future closed at a
premium of 5.60 points.
The PCR-OI increased from 1.27 to 1.29 points.
The Implied volatility of At-the-money options is at
15.00%.
The total open interest of the market is Rs1,09,143cr
of which Stock futures’ open interest is Rs34,011cr.
Some liquid stocks where cost of carry is positive are
TTML, NAGARFERT, PIRHEALTH, OPTOCIRCUI and
MUNDRAPORT.
OI Gainers
OI PRICE View
SCRIP OI CHANGE PRICE CHANGE
(%) (%) FIIs continue to trade with positive bias in the
futures segment and they were net buyers of
ONMOBILE 475750 68.95 420 5.12 Rs.262cr in the cash market segment. Global cues
PFC 855600 51.06 271.95 3.78 are flat. We may see a flattish to positive opening.
BEL 408480 41.63 2006.9 -4.54 Again buying in the options segment was visible
from FIIs, and significant build-up was observed in
BGRENERGY 160800 30.52 552.7 1.38
the 5400 call options, 5300 and 5400 put options.
ANDHRABANK 3958300 29.20 119.45 3.87
Telecom stocks are under-performer in the market.
OI Losers RCOM and BHARTIARTL both the stocks are
showing resistance around Rs.180 and Rs.320
OI PRICE respectively, from the options data. We advise
SCRIP OI CHANGE PRICE CHANGE traders to trade with negative bias in them.
(%) (%)
EKC is consolidating around current levels in the
JISLJALEQS 30000 -30.23 1050.95 4.30
past few trading sessions and the stock is showing
DABUR 588600 -19.85 167.90 2.57 some build-up too. Traders can form long positions
in this counter for the target of Rs.134, with the stop
GESHIP 754800 -14.31 317.35 5.48
loss of Rs. 121.
ALBK 2560250 -12.99 161.35 5.56
IDBI 13802400 -11.56 124.10 3.24
Put-Call Ratio Historical Volatility
SCRIP PCR-OI PCR-VOL SCRIP HV
NIFTY 1.29 1.20 GESHIP 37.47
RELIANCE 0.39 0.43 IOB 40.45
BHARTIARTL 0.56 0.19 FEDERALBNK 38.13
SUZLON 0.30 0.21 BEL 38.95
INFOSYSTCH 0.33 0.19 HCLTECH 33.20
Sebi Registration No: INB 010996539 For Private Circulation Only 1
2. Derivative Report | India Research
FII Statistics for 06-April-2010 Turnover on 06-April-2010
Open Interest
No. of Turnover Change
Detail Buy Sell Net Instrument
Contracts (Rs. in cr.) (%)
Contracts Value Change
(Rs. in cr.) (%)
INDEX Index Futures 295910 7852.35 -17.20
844.92 493.93 350.99 513773 13965.23 0.18
FUTURES
INDEX Stock Futures 456681 16403.35 10.89
2947.68 1765.43 1,182.25 1327797 35651.16 4.91
OPTIONS
STOCK Index Options 995675 26639.01 -17.52
1024.20 953.36 70.84 859537 29033.47 0.80
FUTURES
STOCK Stock Options 76017 2722.44 5.95
106.95 89.36 17.59 14201 426.27 7.89
OPTIONS
TOTAL 4923.75 3302.08 1,621.67 2715308 79076.13 2.68 Total 1824283 53617.14 -9.34
Nifty Spot = 5366.00 Lot Size = 50
Bull-Call Spreads Bear-Put Spreads
Action Strike Price Risk Reward BEP Action Strike Price Risk Reward BEP
Buy 5400 59.25 Buy 5300 54.15
35.85 64.15 5435.85 23.75 76.25 5276.25
Sell 5500 23.40 Sell 5200 30.40
Buy 5400 59.25 Buy 5300 54.15
52.40 147.60 5452.40 37.25 162.75 5262.75
Sell 5600 6.85 Sell 5100 16.90
Buy 5500 23.40 Buy 5200 30.40
16.55 83.45 5516.55 13.50 86.50 5186.50
Sell 5600 6.85 Sell 5100 16.90
Note: Above mentioned Bullish or Bearish Spreads in Nifty (April Series) are given as an information and not as a recommendation
Nifty Put-Call Analysis
For Private Circulation Only Sebi Registration No: INB 010996539 2
3. Derivative Report | India Research
Strategy Date Scrip Strategy Status
29-March-2010 SUZLON Long Call Continue
29-March-2010 IDBI Long Call Profit Booked on 06-Apr-2010
05-April-2010 RNRL Long Call Continue
05-April-2010 HUL Long Put Continue
DISCLAIMER:
This document is not for public distribution and has been furnished to you solely for your information and must not be reproduced or redistributed to any other person.
Persons into whose possession this document may come are required to observe these restrictions.
Opinion expressed is our current opinion as of the date appearing on this material only. While we endeavor to update on a reasonable basis the information discussed in
this material, there may be regulatory, compliance, or other reasons that prevent us from doing so. Prospective investors and others are cautioned that any forward-
looking statements are not predictions and may be subject to change without notice. Our proprietary trading and investment businesses may make investment decisions
that are inconsistent with the recommendations expressed herein.
The information in this document has been printed on the basis of publicly available information, internal data and other reliable sources believed to be true and are for
general guidance only. While every effort is made to ensure the accuracy and completeness of information contained, the company takes no guarantee and assumes no
liability for any errors or omissions of the information. No one can use the information as the basis for any claim, demand or cause of action.
Recipients of this material should rely on their own investigations and take their own professional advice. Each recipient of this document should make such investigations
as it deems necessary to arrive at an independent evaluation of an investment in the securities of companies referred to in this document (including the merits and risks
involved), and should consult their own advisors to determine the merits and risks of such an investment. Price and value of the investments referred to in this material may
go up or down. Past performance is not a guide for future performance.
Certain transactions - futures, options and other derivatives as well as non-investment grade securities - involve substantial risks and are not suitable for all investors.
Reports based on technical analysis centers on studying charts of a stock's price movement and trading volume, as opposed to focusing on a company's fundamentals and
as such, may not match with a report on a company's fundamentals.
We do not undertake to advise you as to any change of our views expressed in this document. While we would endeavor to update the information herein on a reasonable
basis, Angel Broking, its subsidiaries and associated companies, their directors and employees are under no obligation to update or keep the information current. Also
there may be regulatory, compliance, or other reasons that may prevent Angel Broking and affiliates from doing so. Prospective investors and others are cautioned that
any forward-looking statements are not predictions and may be subject to change without notice.
Angel Broking Limited and affiliates, including the analyst who has issued this report, may, on the date of this report, and from time to time, have long or short positions
in, and buy or sell the securities of the companies mentioned herein or engage in any other transaction involving such securities and earn brokerage or compensation or
act as advisor or have other potential conflict of interest with respect to company/ies mentioned herein or inconsistent with any recommendation and related information
and opinions.
Angel Broking Limited and affiliates may seek to provide or have engaged in providing corporate finance, investment banking or other advisory services in a merger or
specific transaction to the companies referred to in this report, as on the date of this report or in the past.
Sebi Registration No.: INB 010996539
Derivative Research Team derivatives.desk@angeltrade.com
For Private Circulation Only Sebi Registration No: INB 010996539 3