Download to read offline

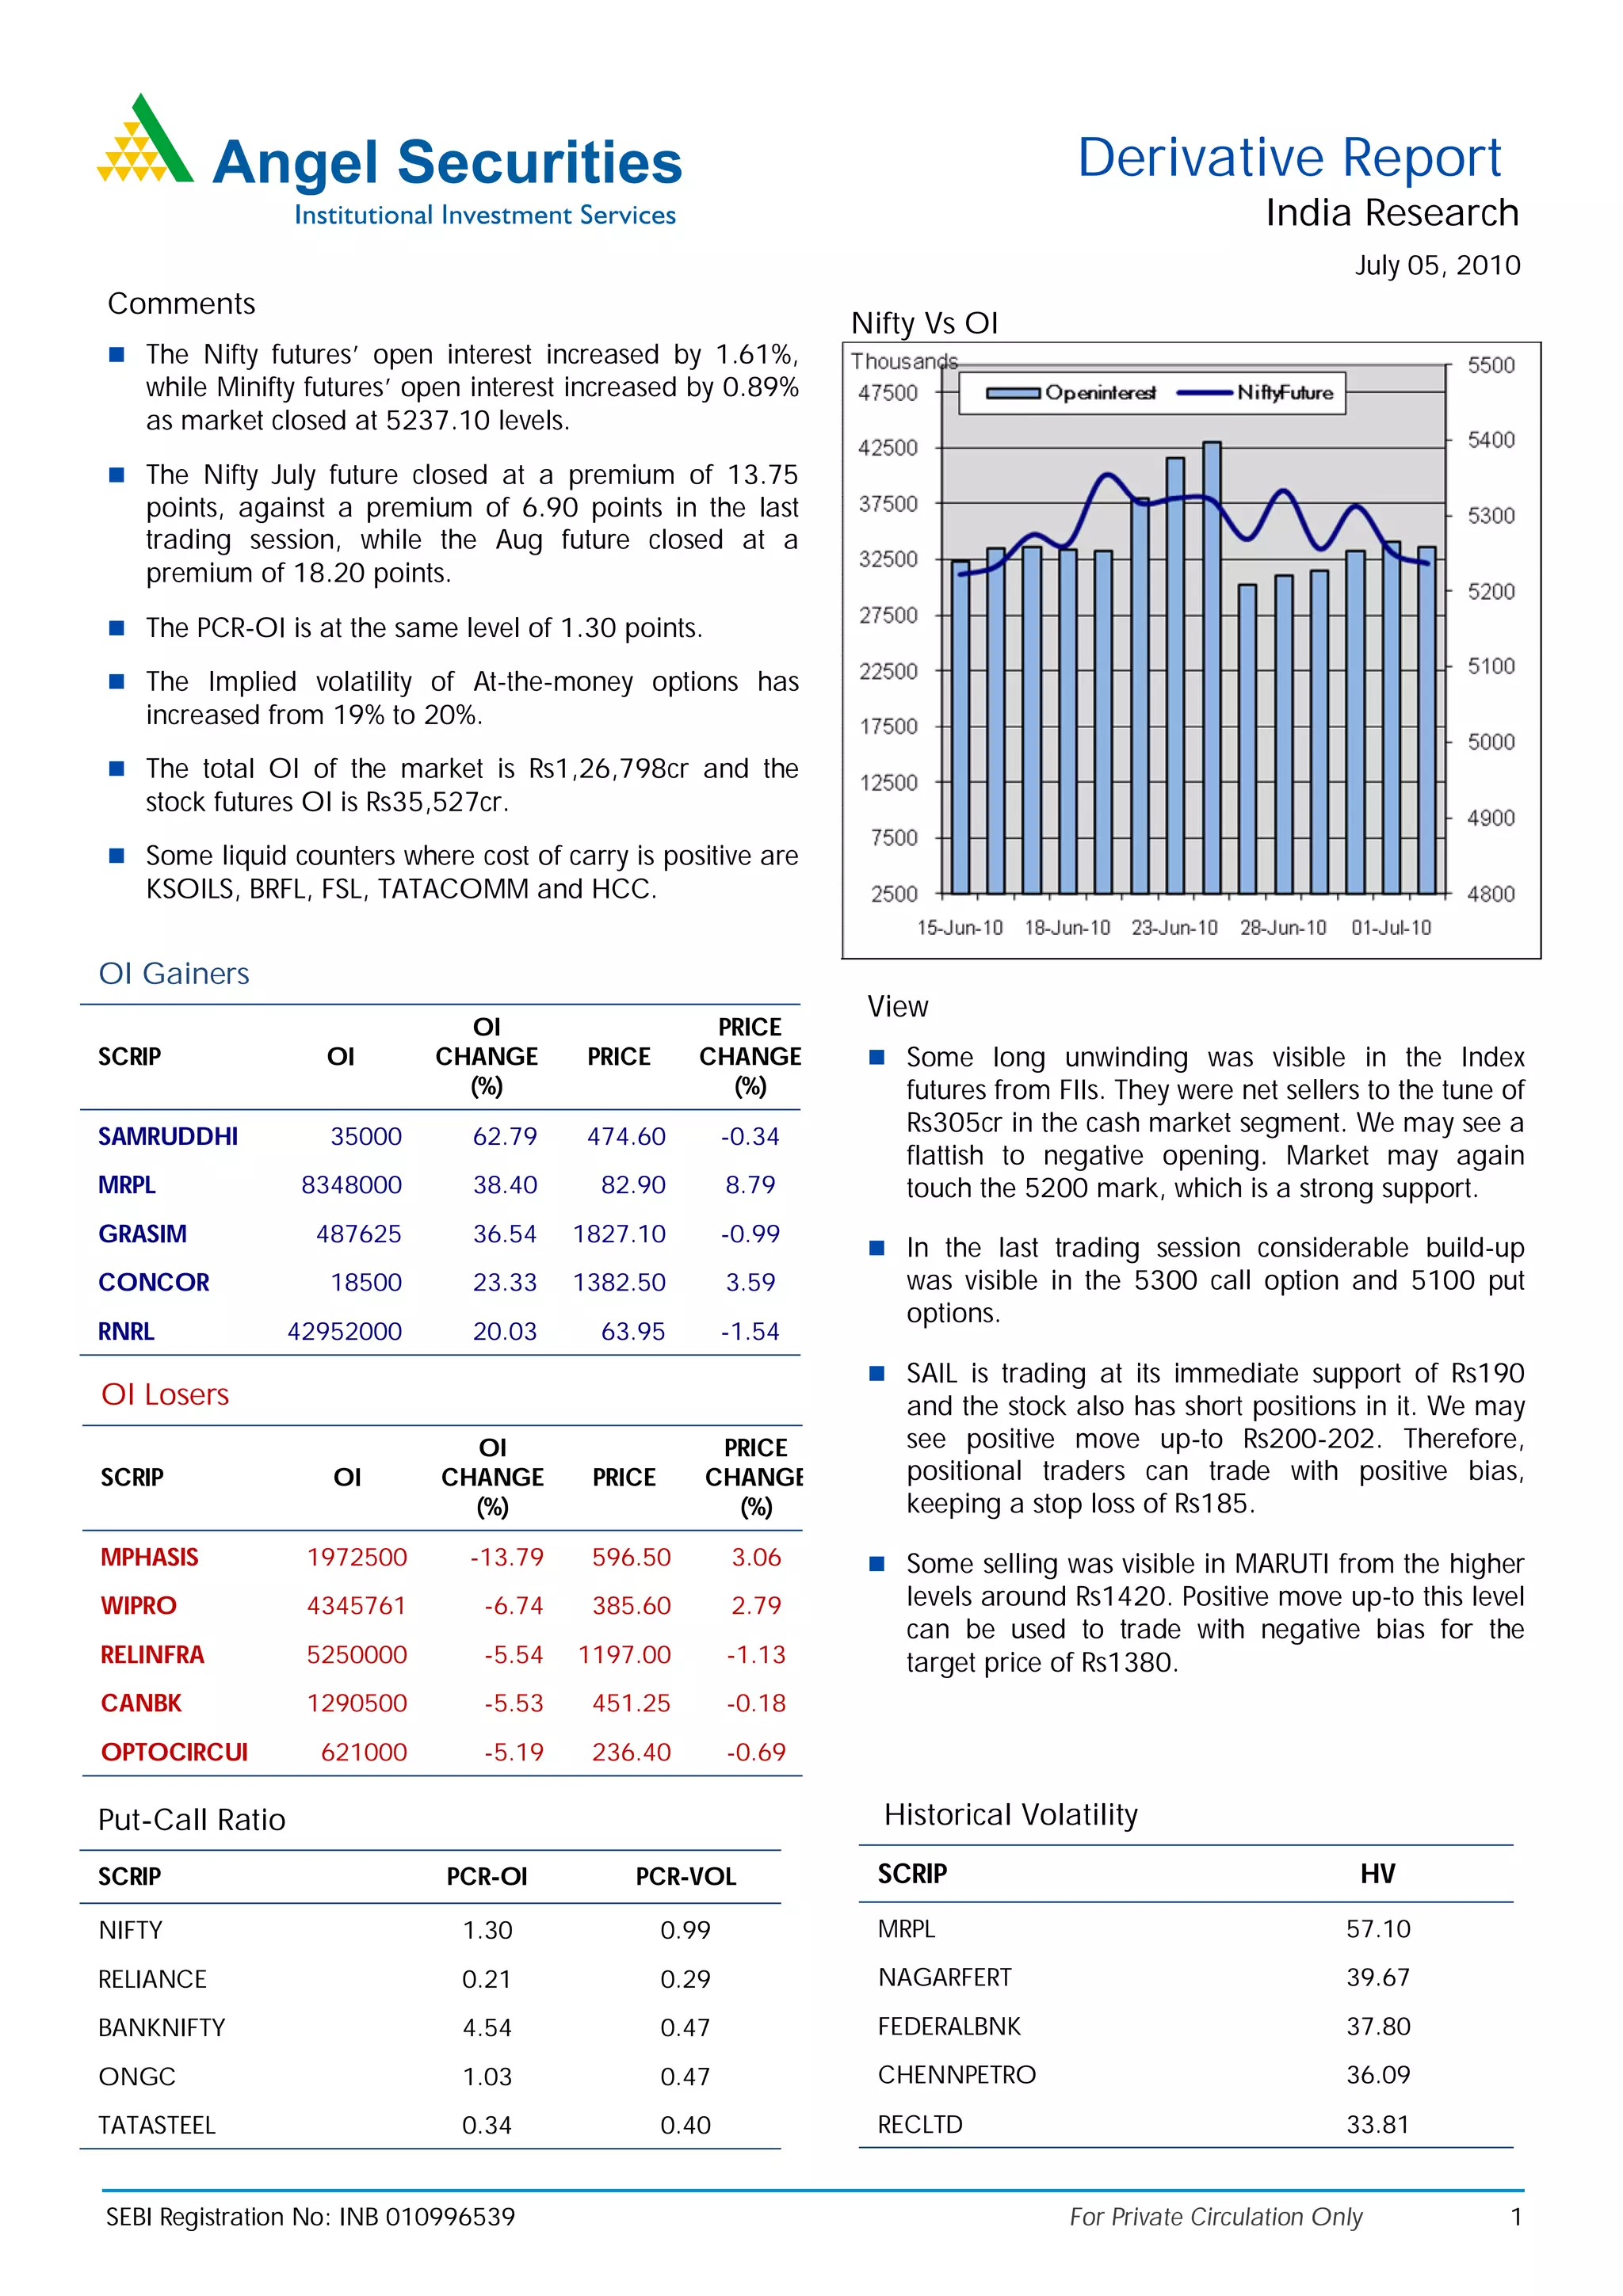
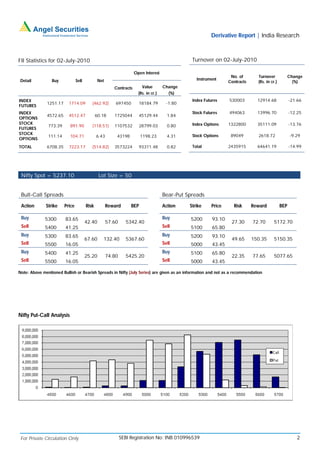

The derivative report provides a summary of activity in the Indian derivatives market on July 05, 2010: - Open interest in Nifty futures increased by 1.61% while open interest in Mini Nifty futures rose by 0.89% as the market closed at 5237.10 points. - Some stocks saw significant increases in open interest like MRPL (+38.40%), GRASIM (+36.54%), and CONCOR (+23.33%) while others decreased like MPHASIS (-13.79%), WIPRO (-6.74%), and RELINFRA (-5.54%). - The report also analyzes put-call ratios, volatility, FII activity and provides strategies


