Download to read offline

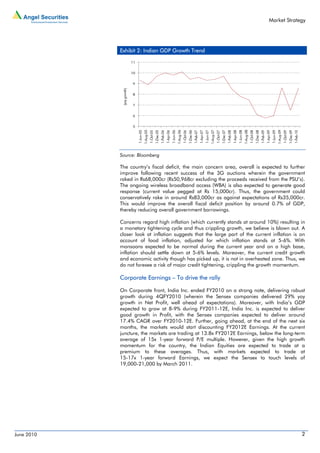


The document discusses the attractiveness of emerging markets like China and India for investments after recent corrections. It notes that valuations in countries like China have become compelling, with its P/E ratio of 13x and market cap to GDP ratio of 0.6x given that growth will remain higher than developed economies. It argues the European bailout package and low interest rates globally will drive funds back into high growth emerging markets like China and India. It highlights India's growth is driven more by domestic factors than external ones, and expects the economy to grow 8-9% in the coming fiscal year.