Download to read offline


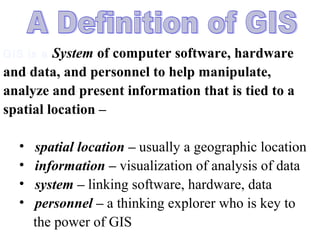

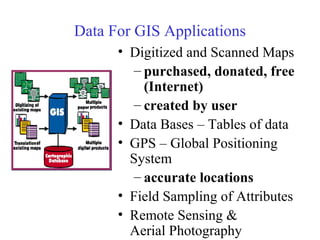

![Query and OverlayQuery and Overlay
AnalysesAnalyses
Query building is a data exploration operation
–Example statement: ‘([acres] > 500 AND [age] > 55)’
–This would highlight all land parcels of greater than 500 acres
owned by people older than 55 years old in a data set loaded into
the GIS.
Map algebra with raster data, in this type of operation
mathematical operations are done on each pixel of
multiple data layers. This results in a new data layer that
is calculated from all the input layers.](https://image.slidesharecdn.com/env-151026092332-lva1-app6891/85/Env-mon-47-320.jpg)


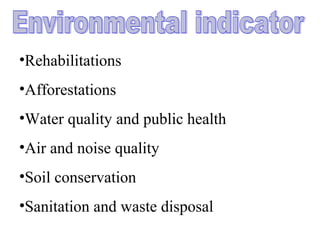
The document discusses environmental monitoring and its importance. It describes how monitoring is conducted to assess the status of the environment and protect against potential damage from human activities. It outlines the key goals of environmental monitoring as assessing changes in environmental conditions, monitoring the effectiveness of mitigation measures, and warning of significant deteriorations. Finally, it discusses the different aspects of the environment that are monitored, including rehabilitations, afforestations, water and air quality, soil conservation, and sanitation.


