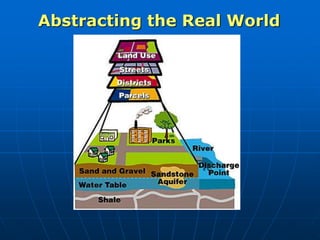
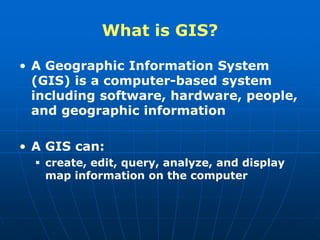
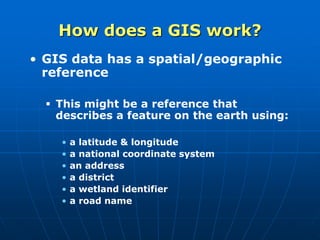
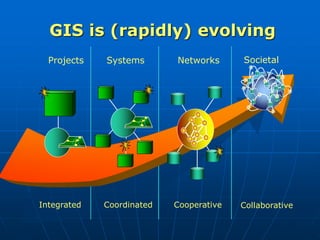
- A geographic information system (GIS) is a computer system for capturing, storing, analyzing and displaying geographic data. It allows users to create, edit, query, analyze and display spatial data on a computer.
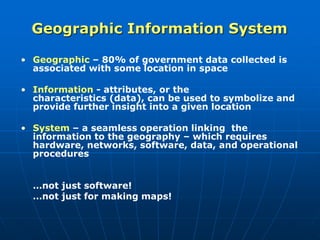
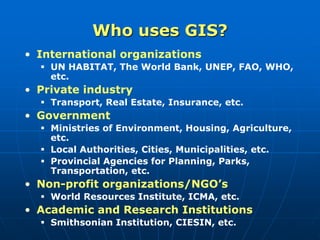
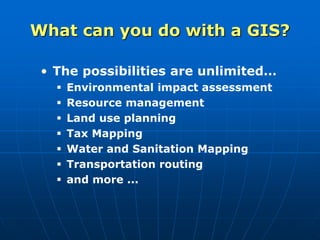
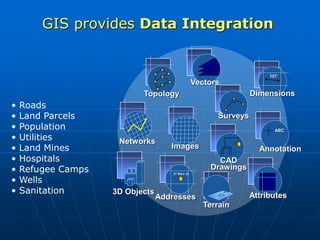
- GIS is used widely by government, private businesses, non-profits and academics for tasks like environmental planning, resource management, transportation routing and more. It integrates geographic data like imagery, maps and surveys with non-geographic data stored in tables.
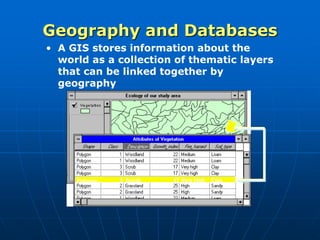
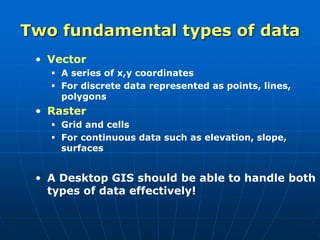
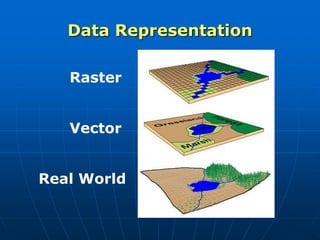
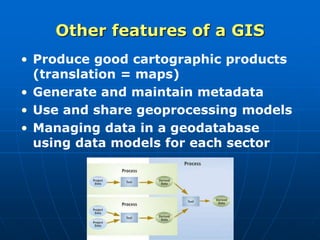
- Key components of a GIS include geographic data represented as vectors or rasters, software to manage and analyze spatial data, cartography tools to create maps, and the ability to integrate data from different sources into a centralized geodatabase.


![health and hygiene [Autosaved].pptx](https://cdn.slidesharecdn.com/ss_thumbnails/healthandhygieneautosaved-230209160922-06936c4d-thumbnail.jpg?width=640&height=640&fit=bounds)


