Downloaded 285 times
![Calculating Inertia [or Variance] using Points-rows XLStat calculates this table. It shows what Row category generates the most Inertia (Row 16-24 accounts for 72% of it)](https://image.slidesharecdn.com/correspondenceanalysis-100405162324-phpapp01/75/Correspondence-Analysis-12-2048.jpg)
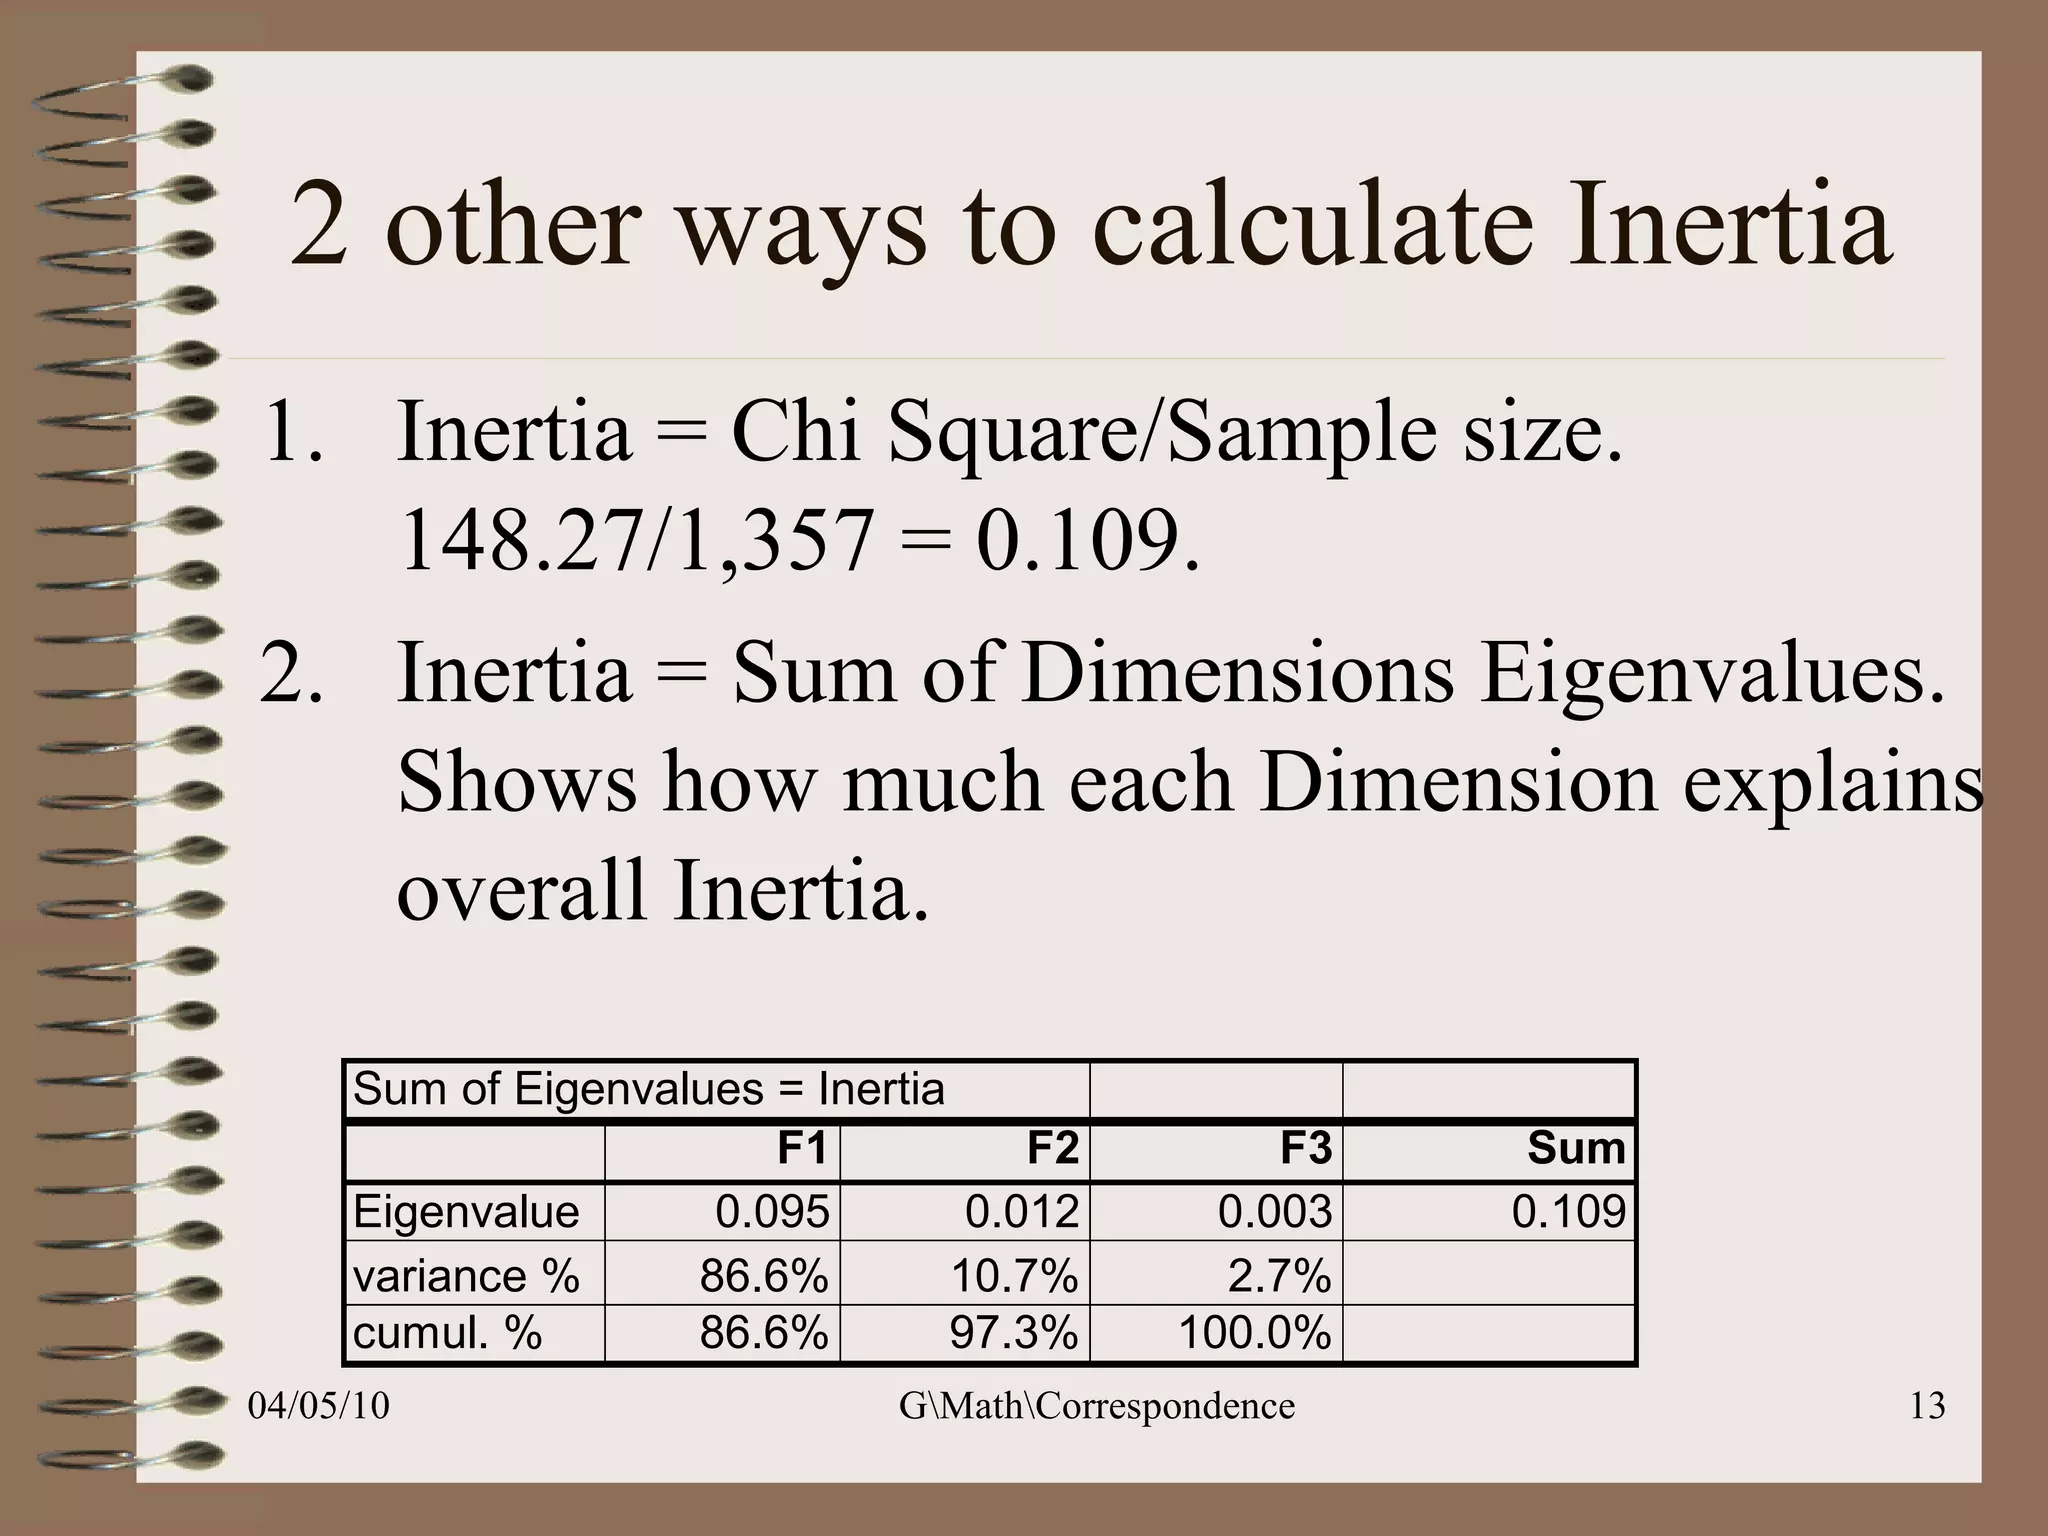
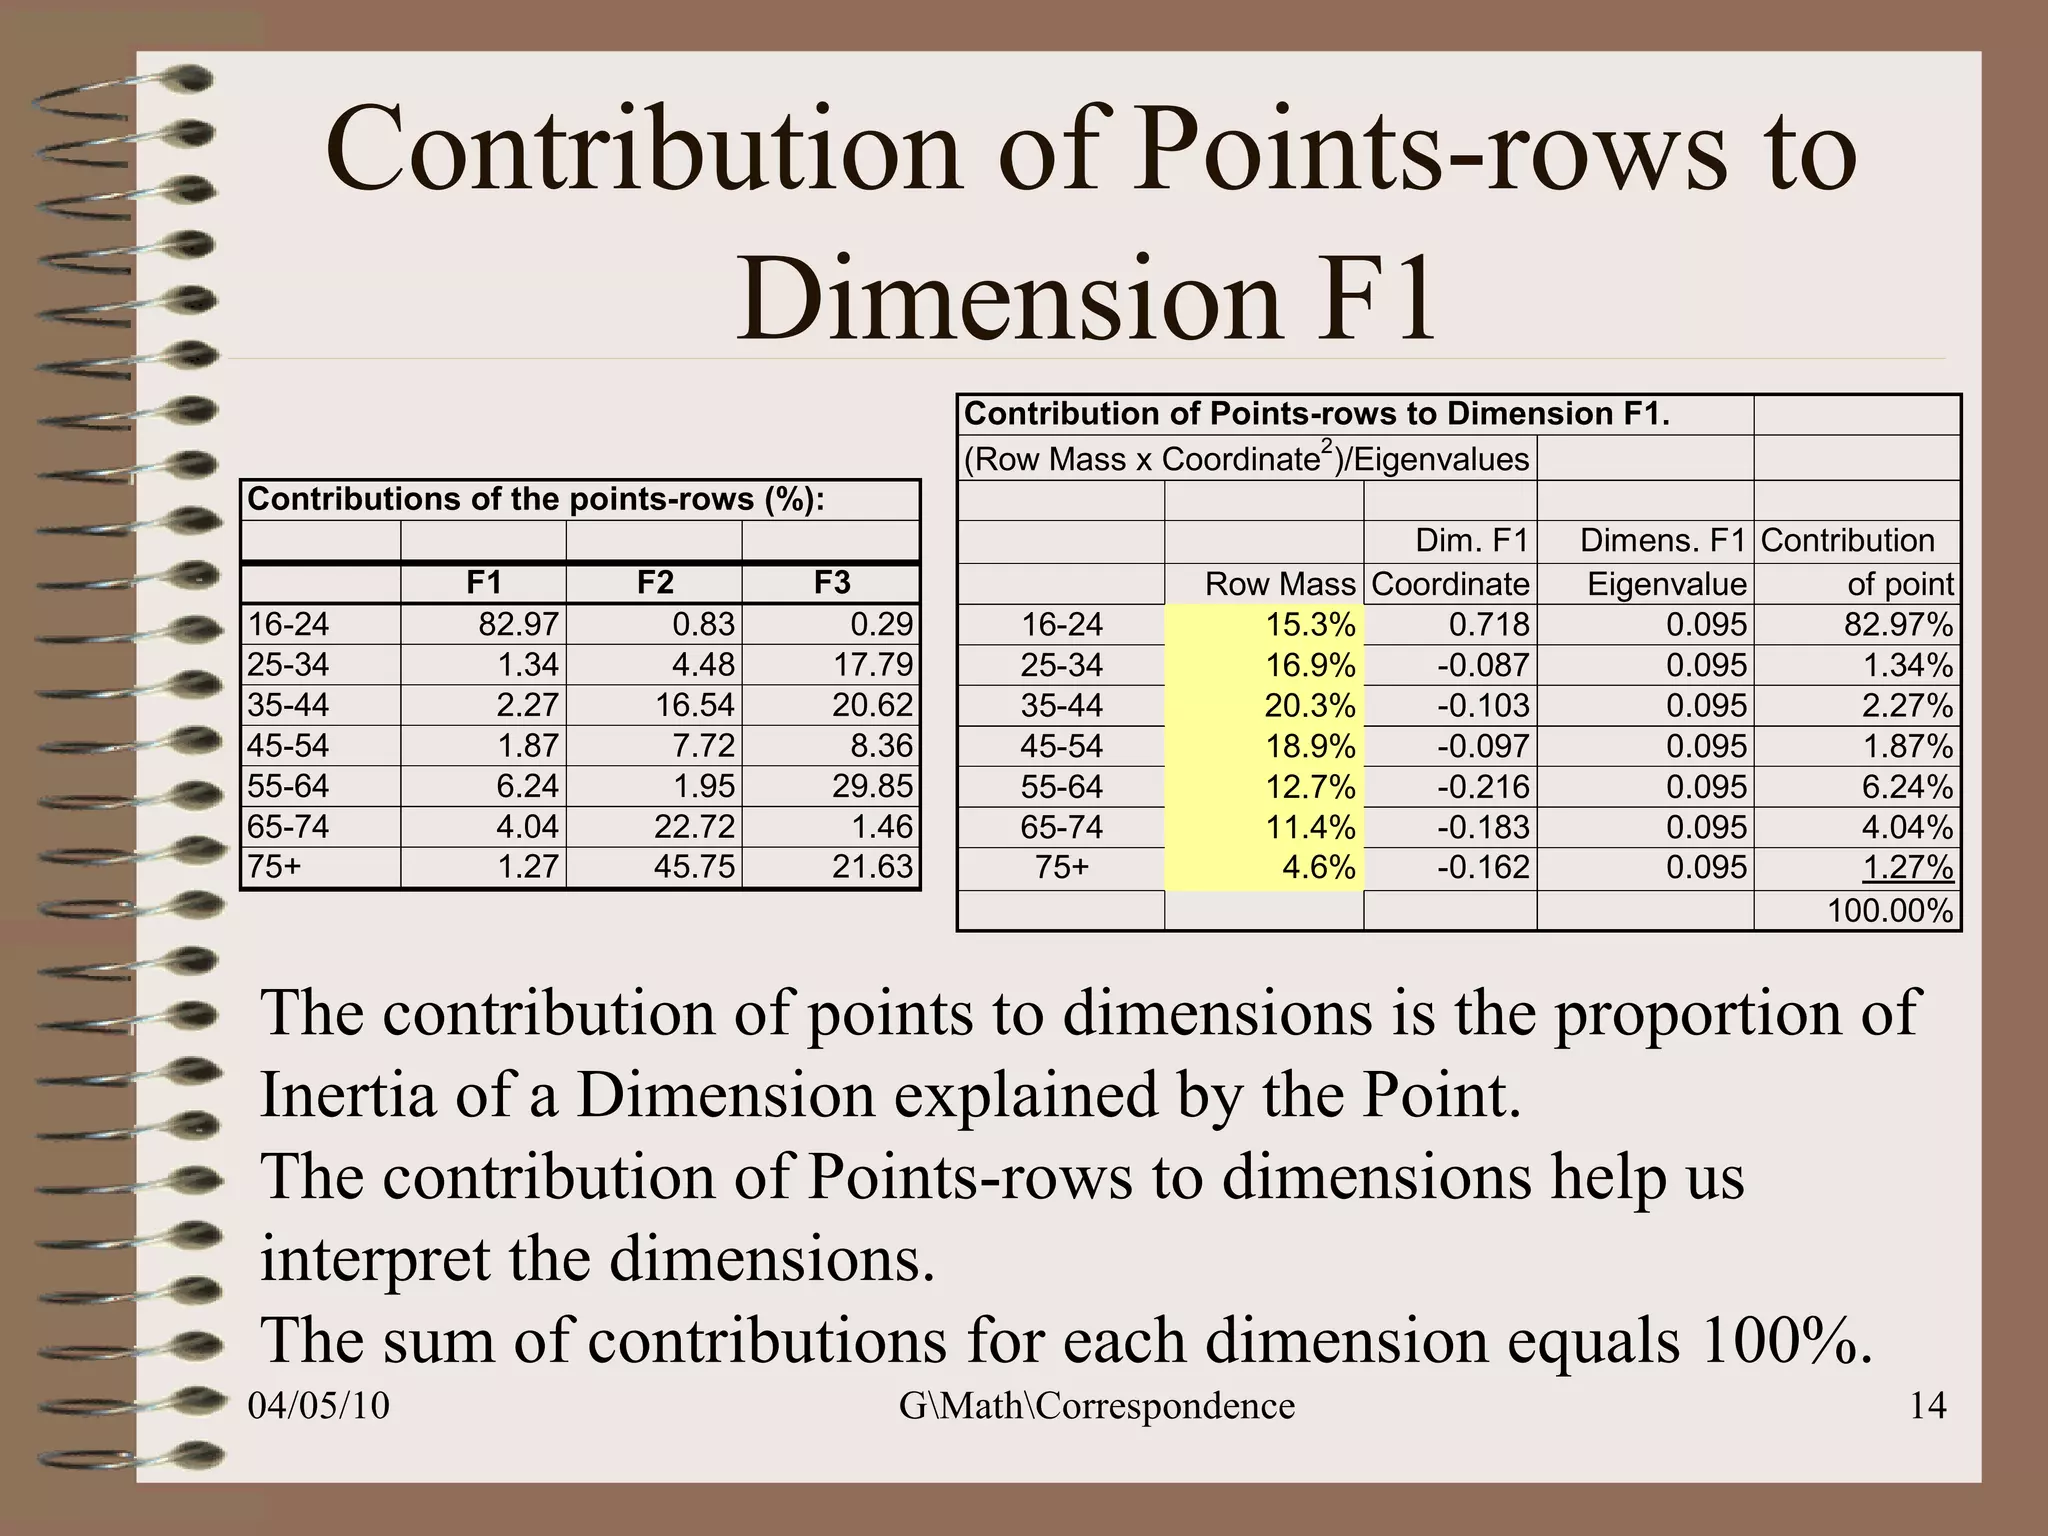
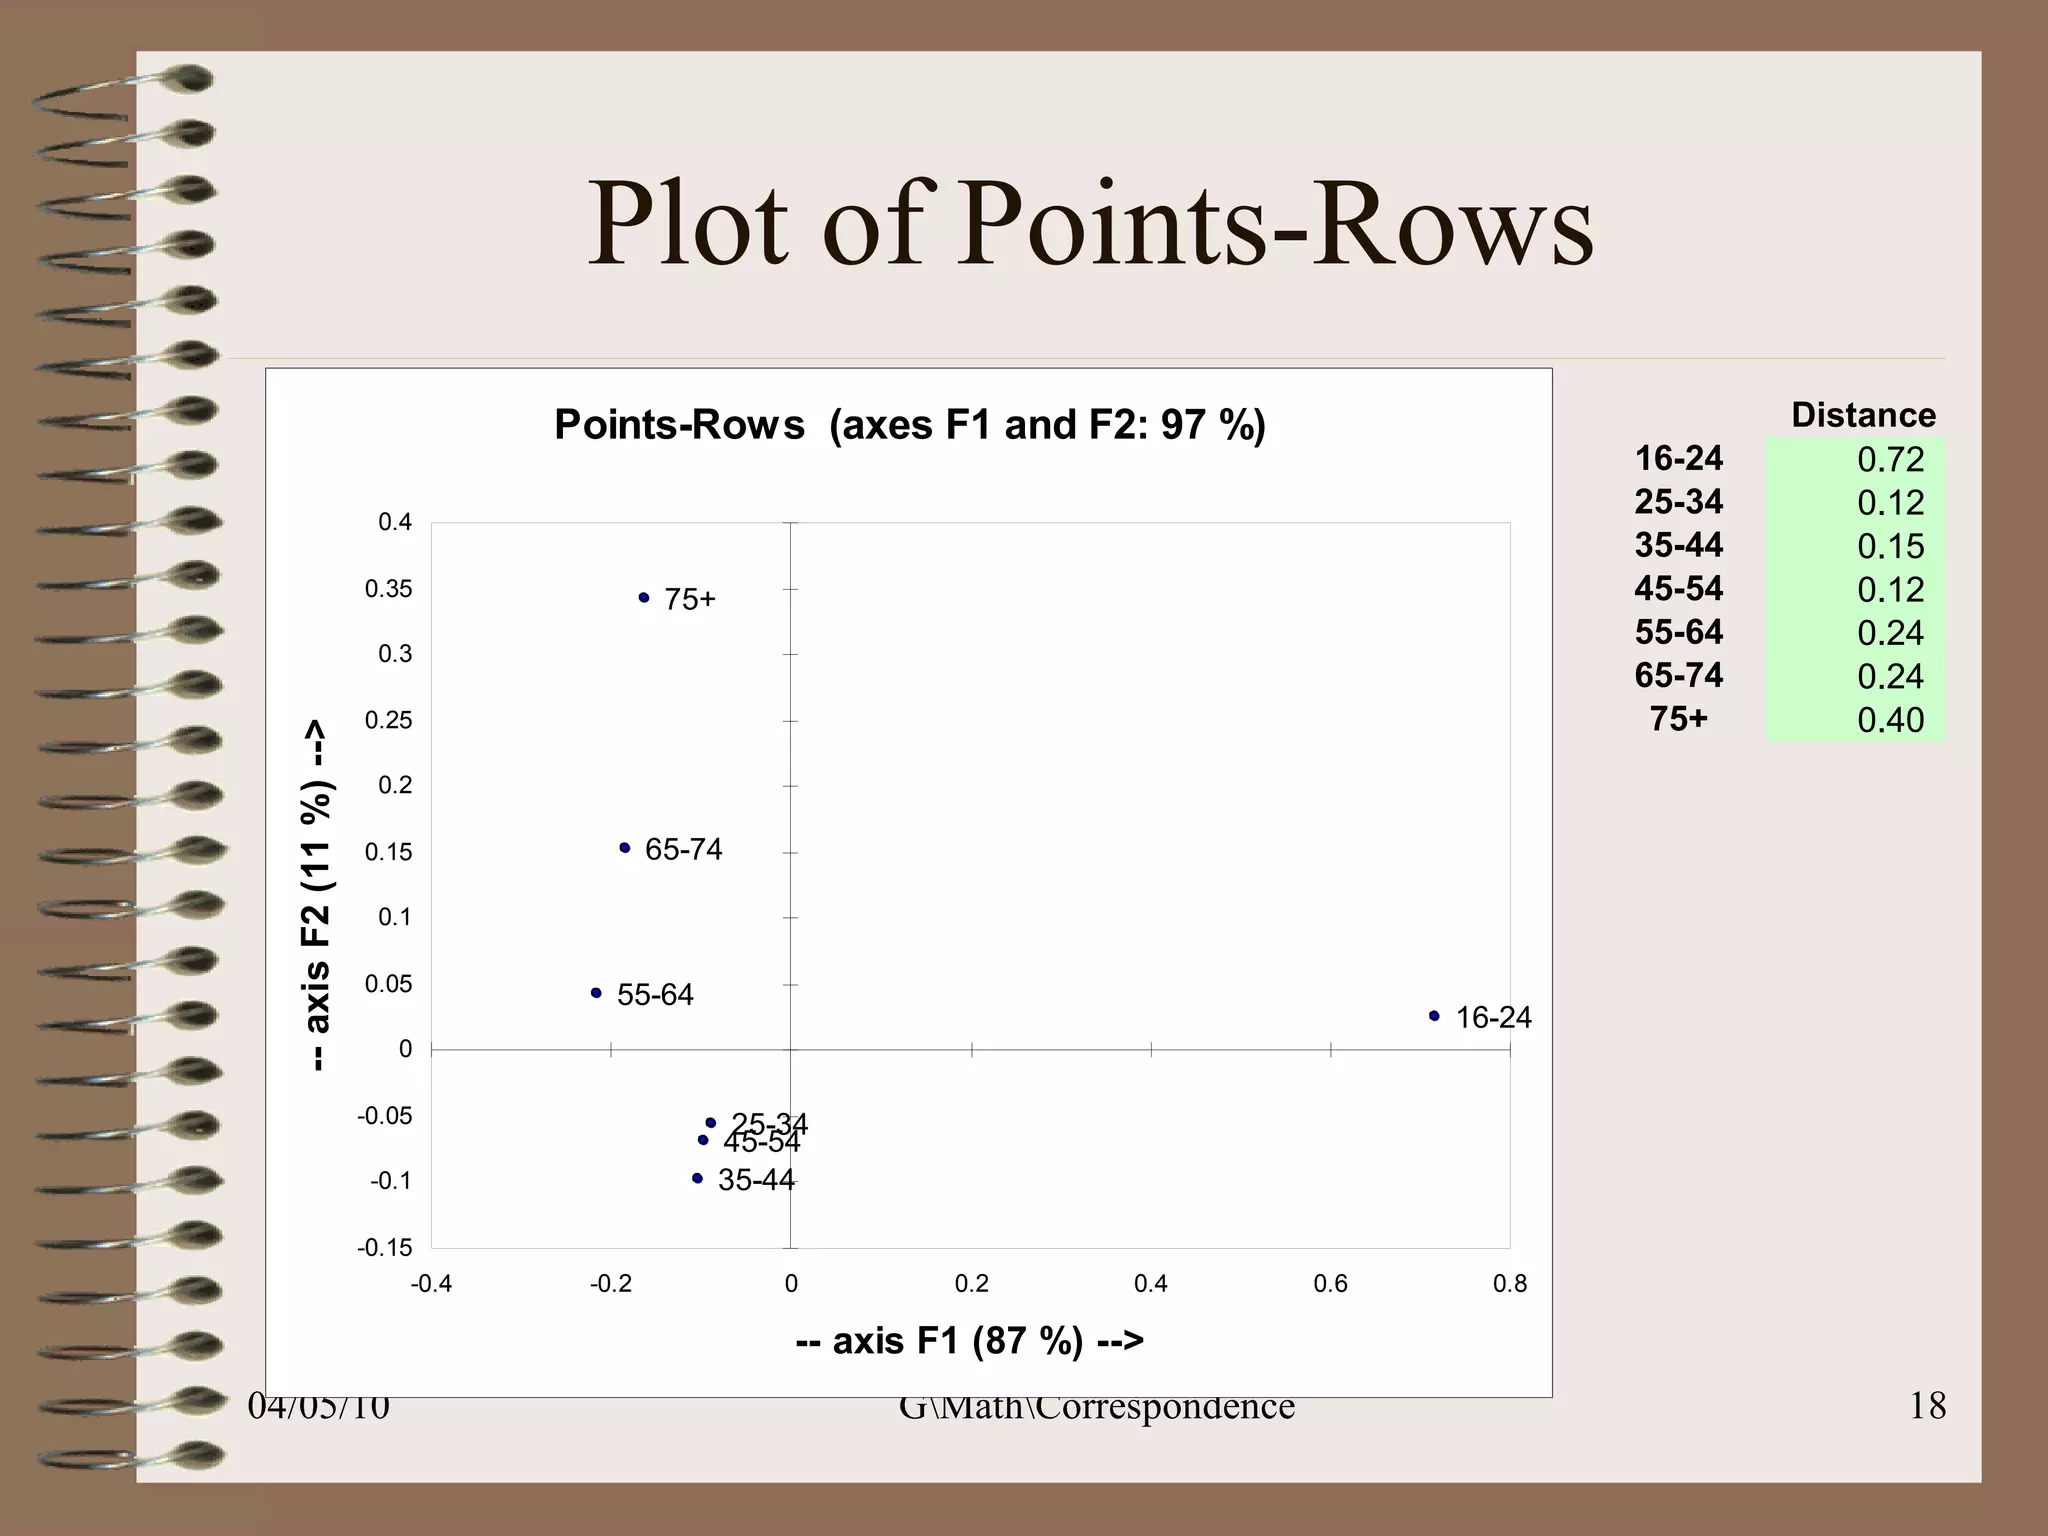
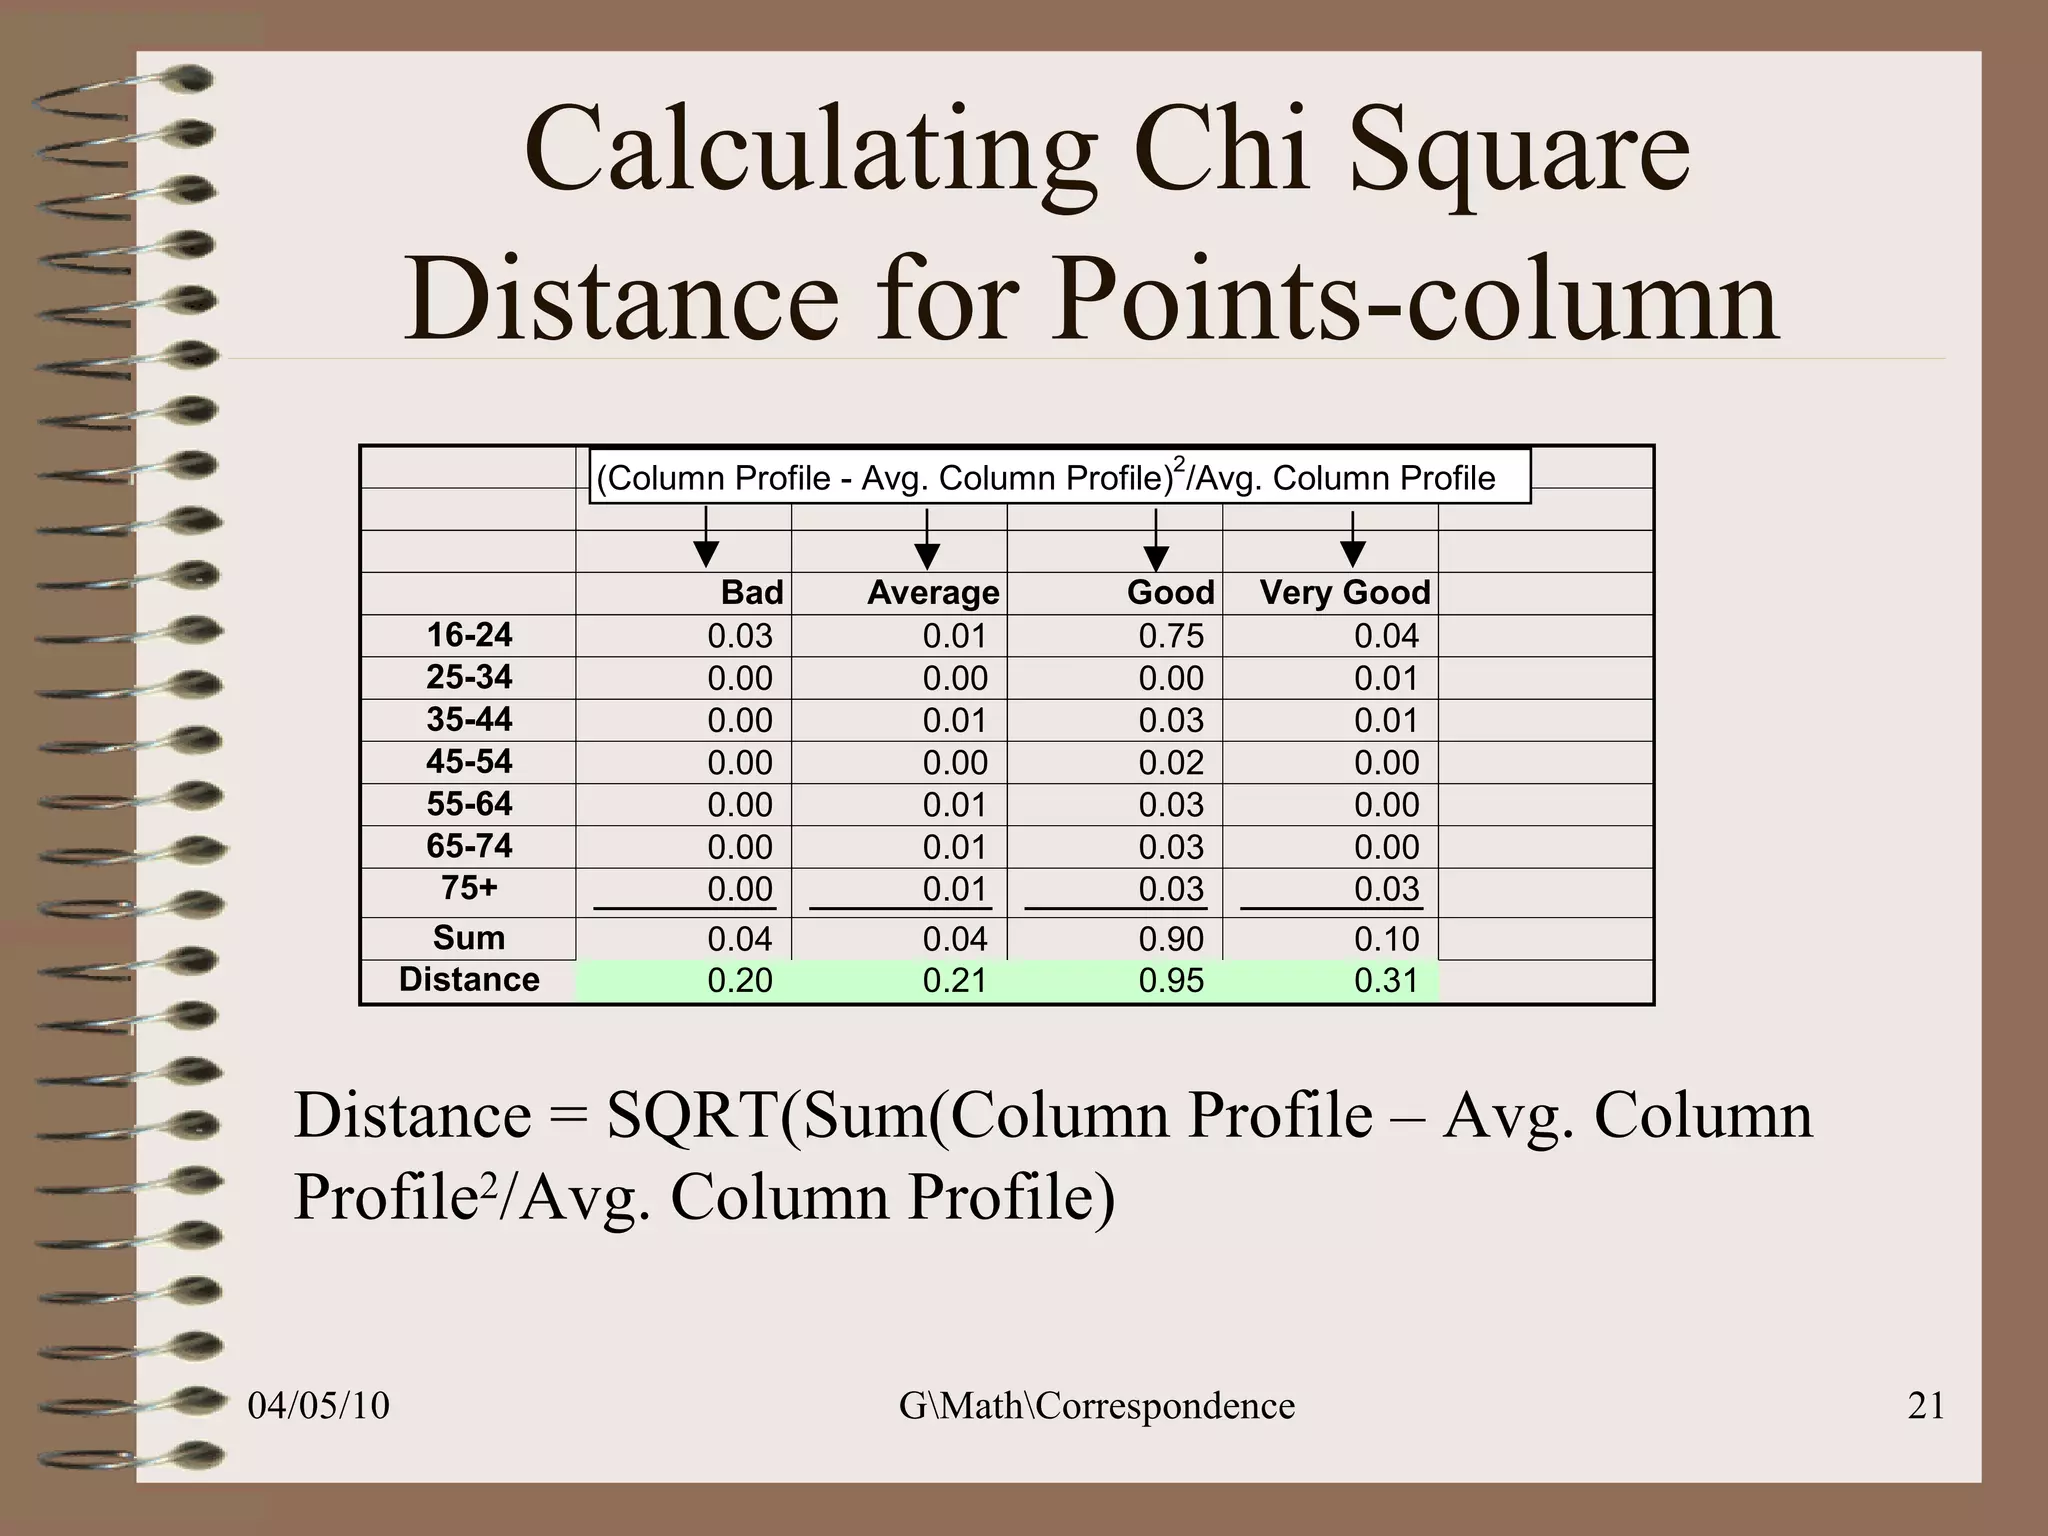
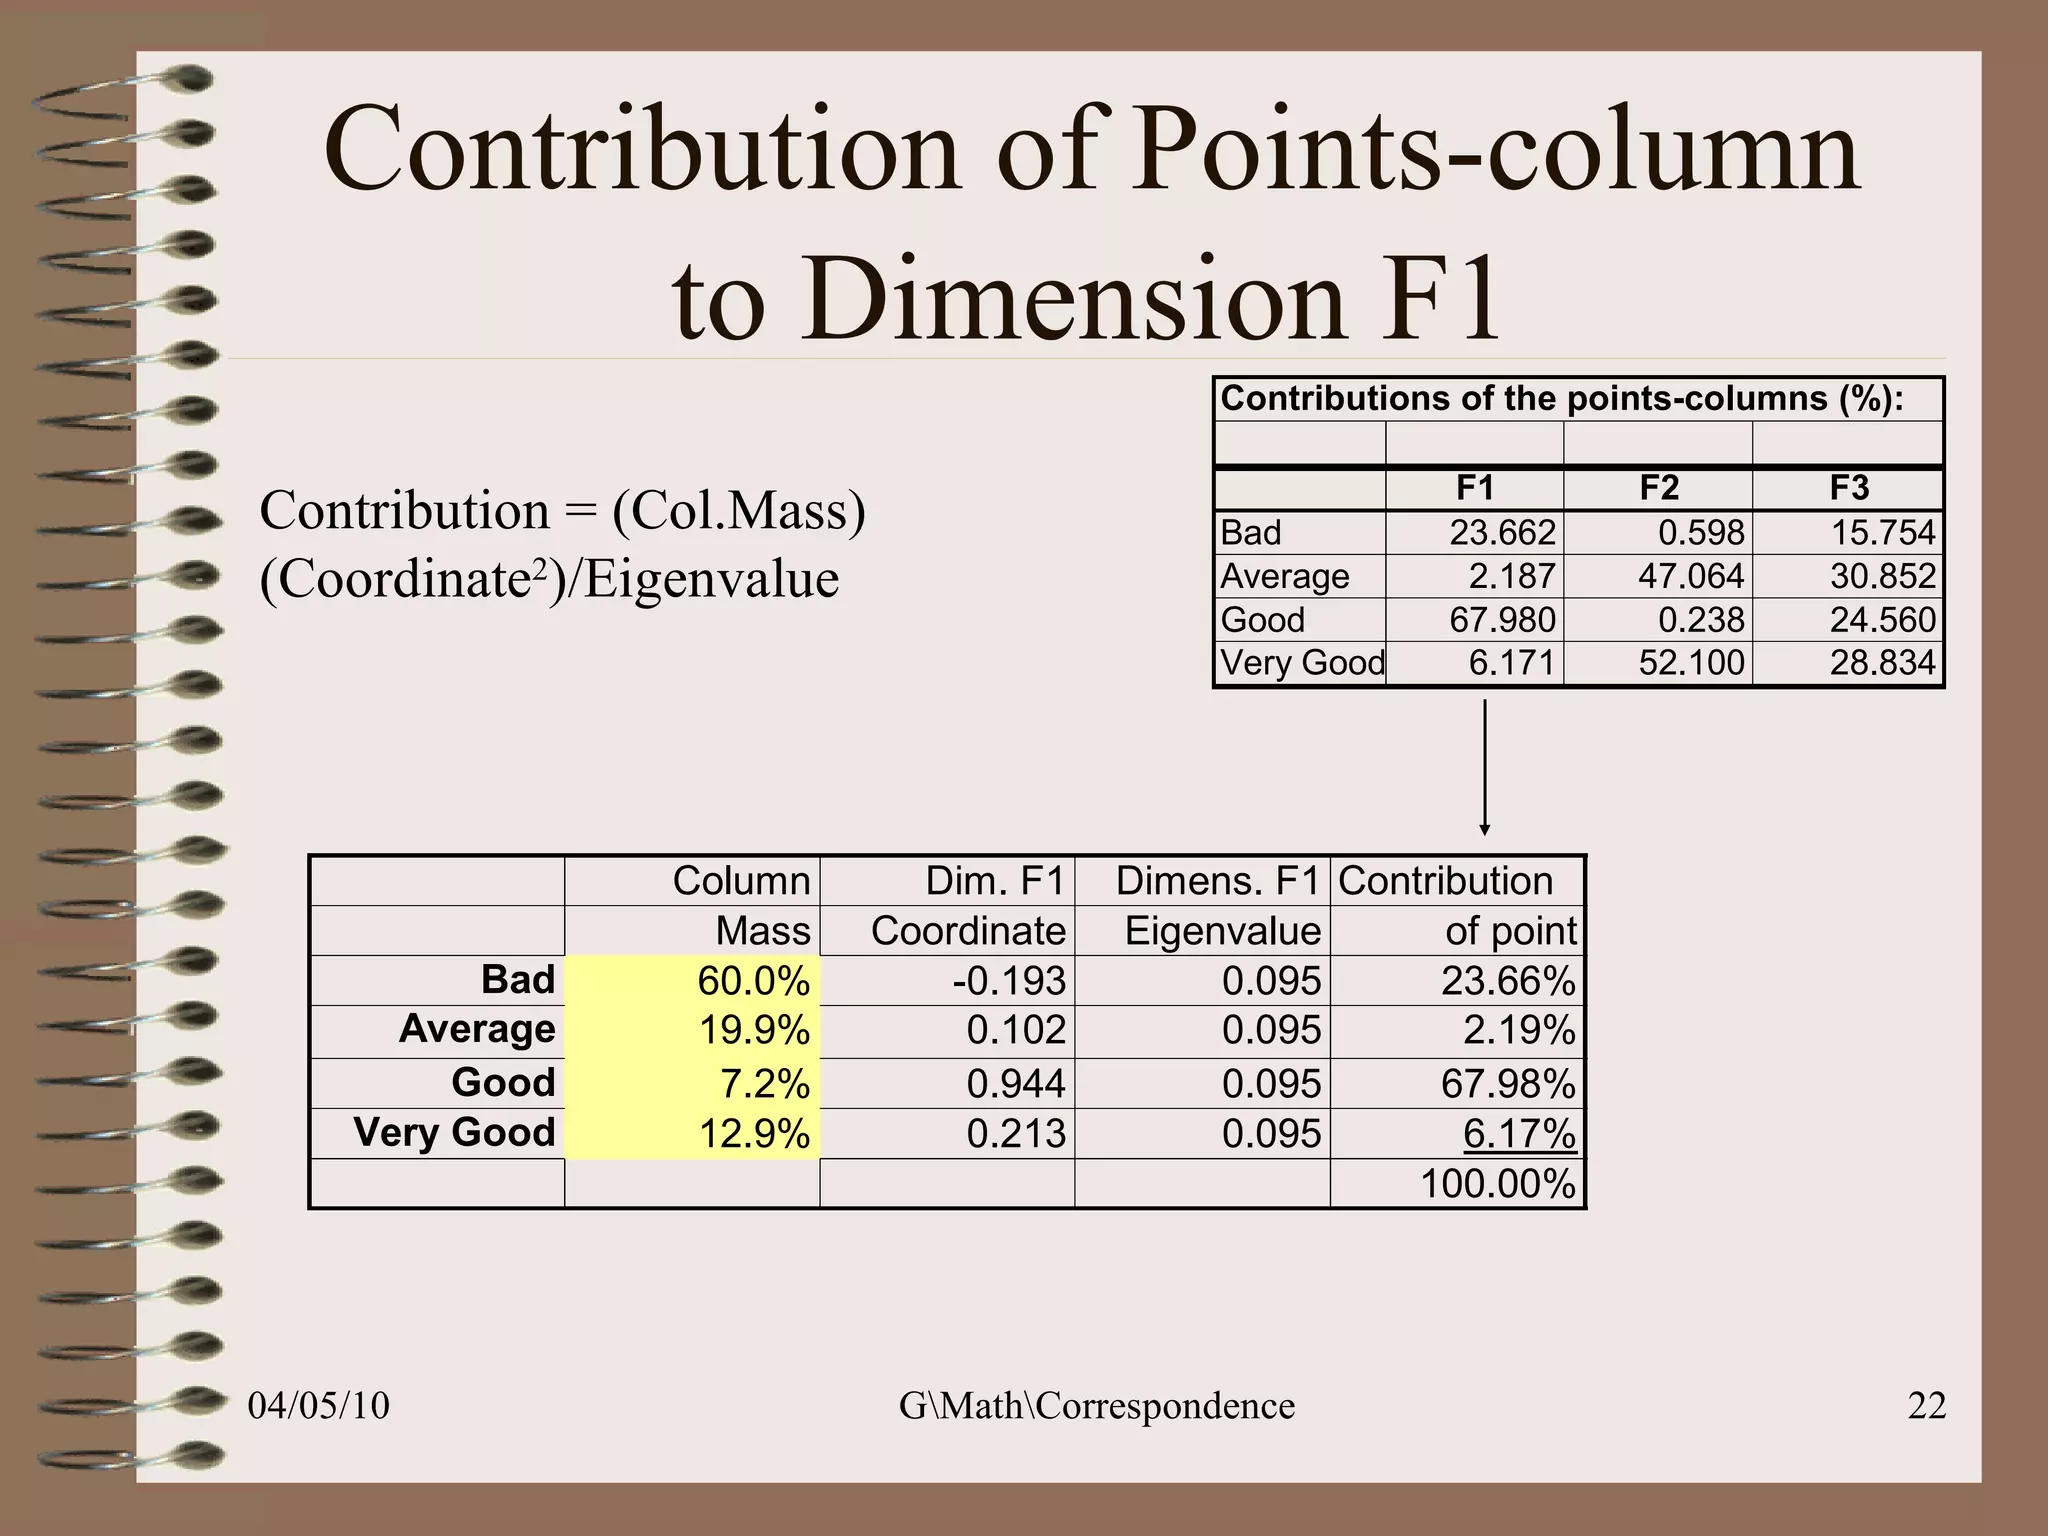
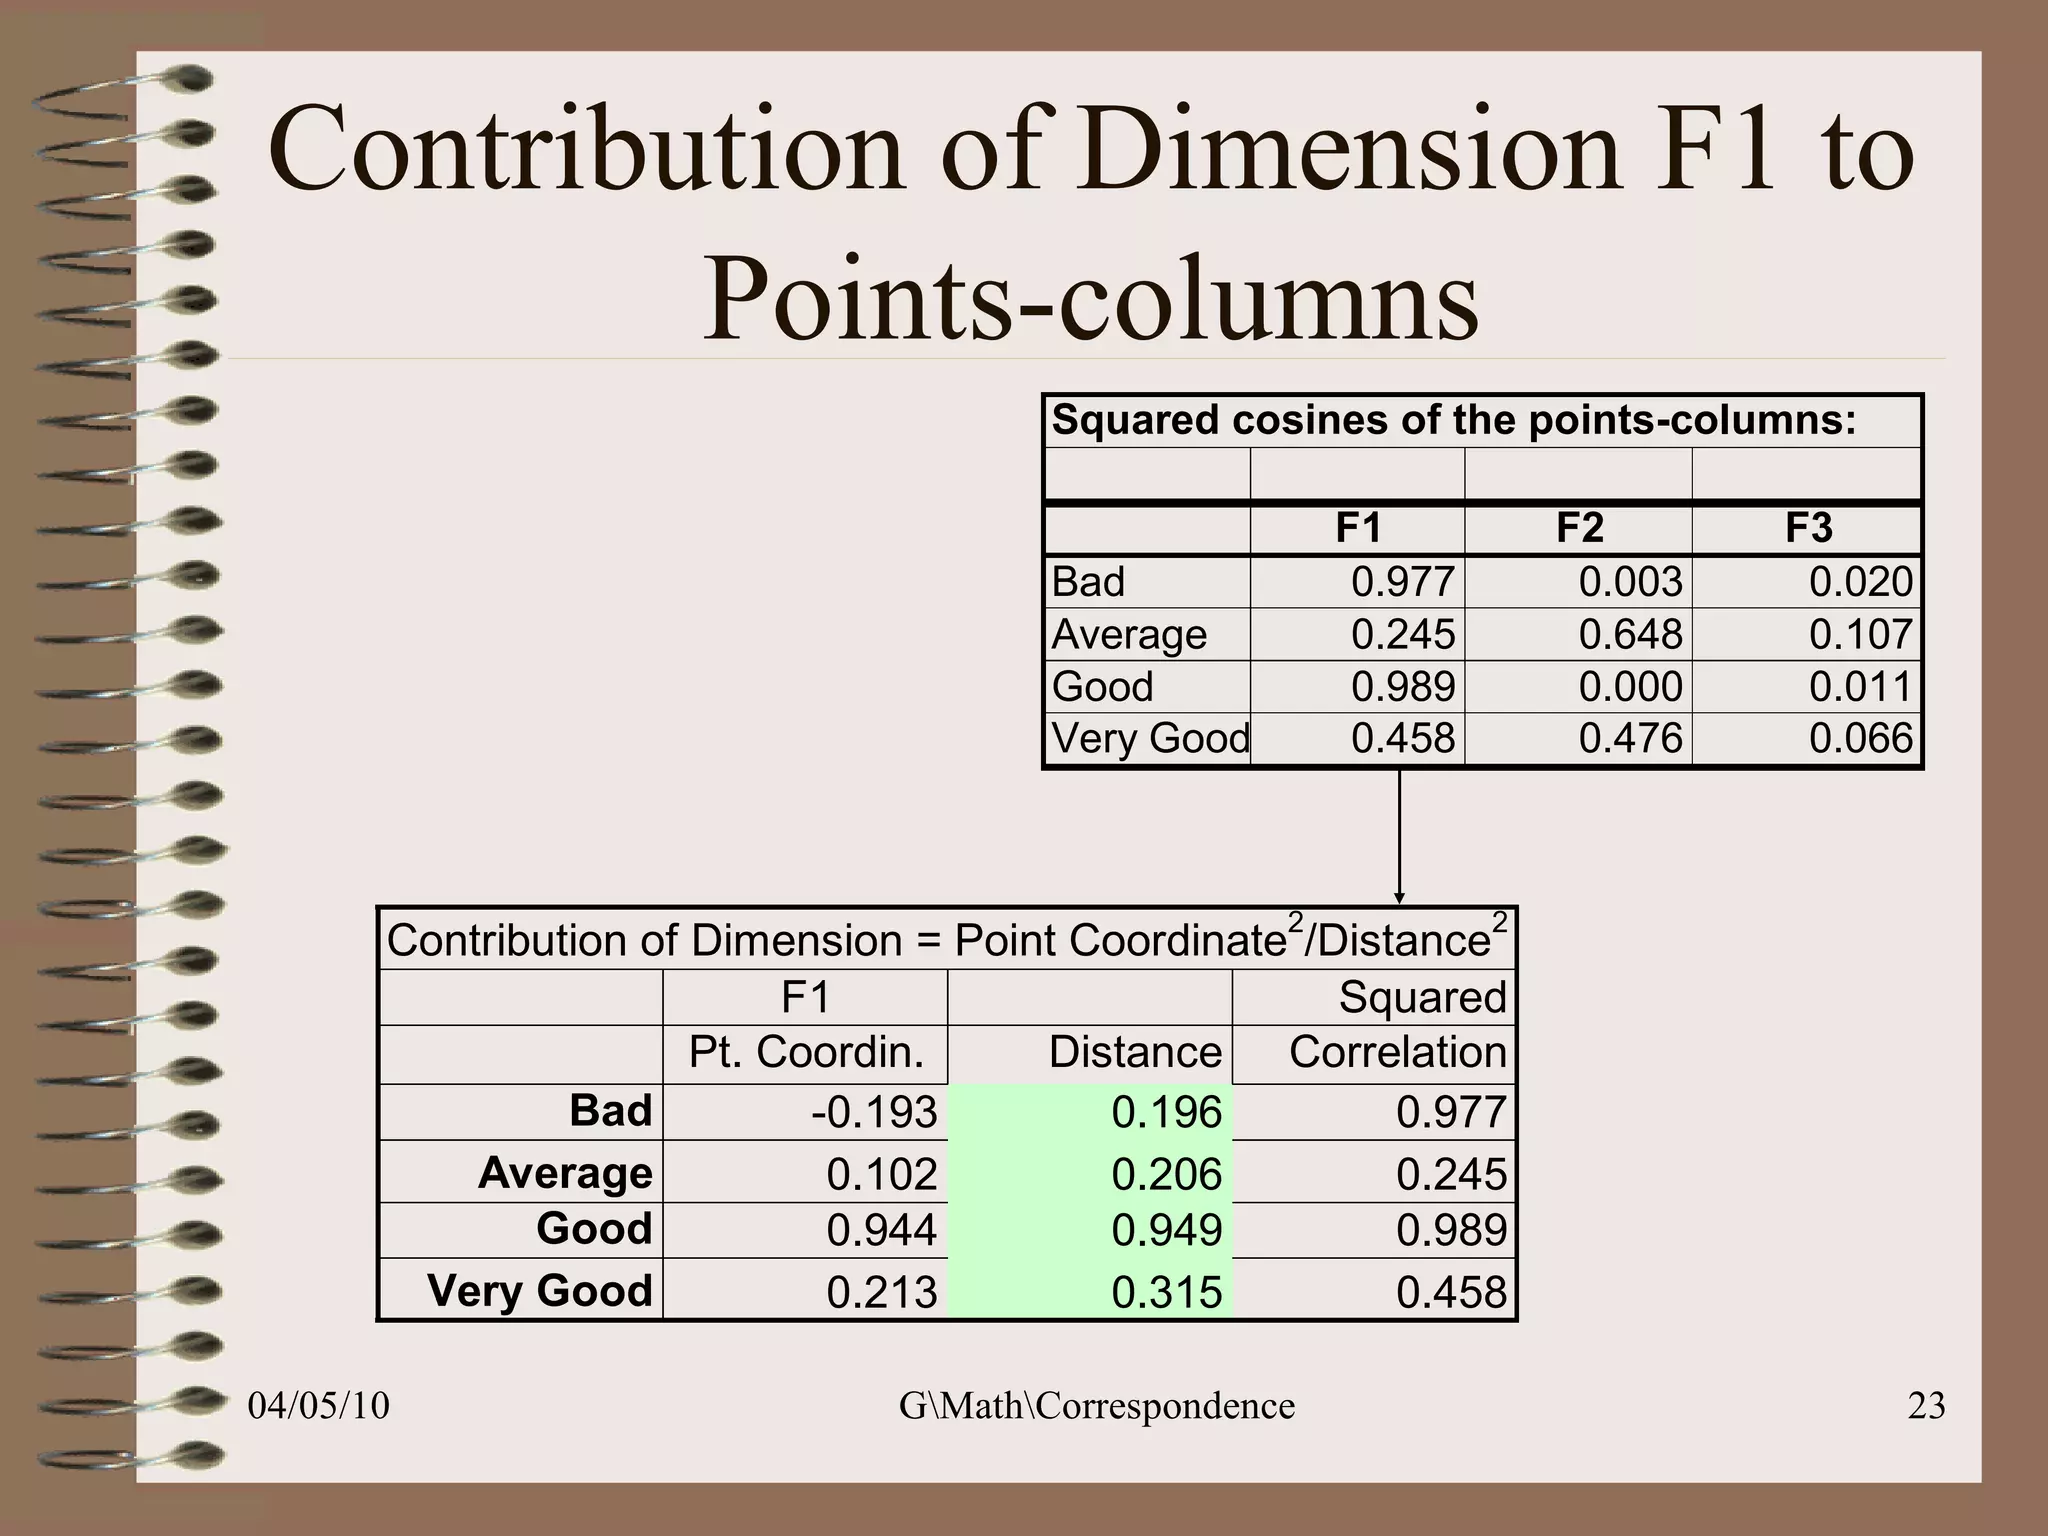
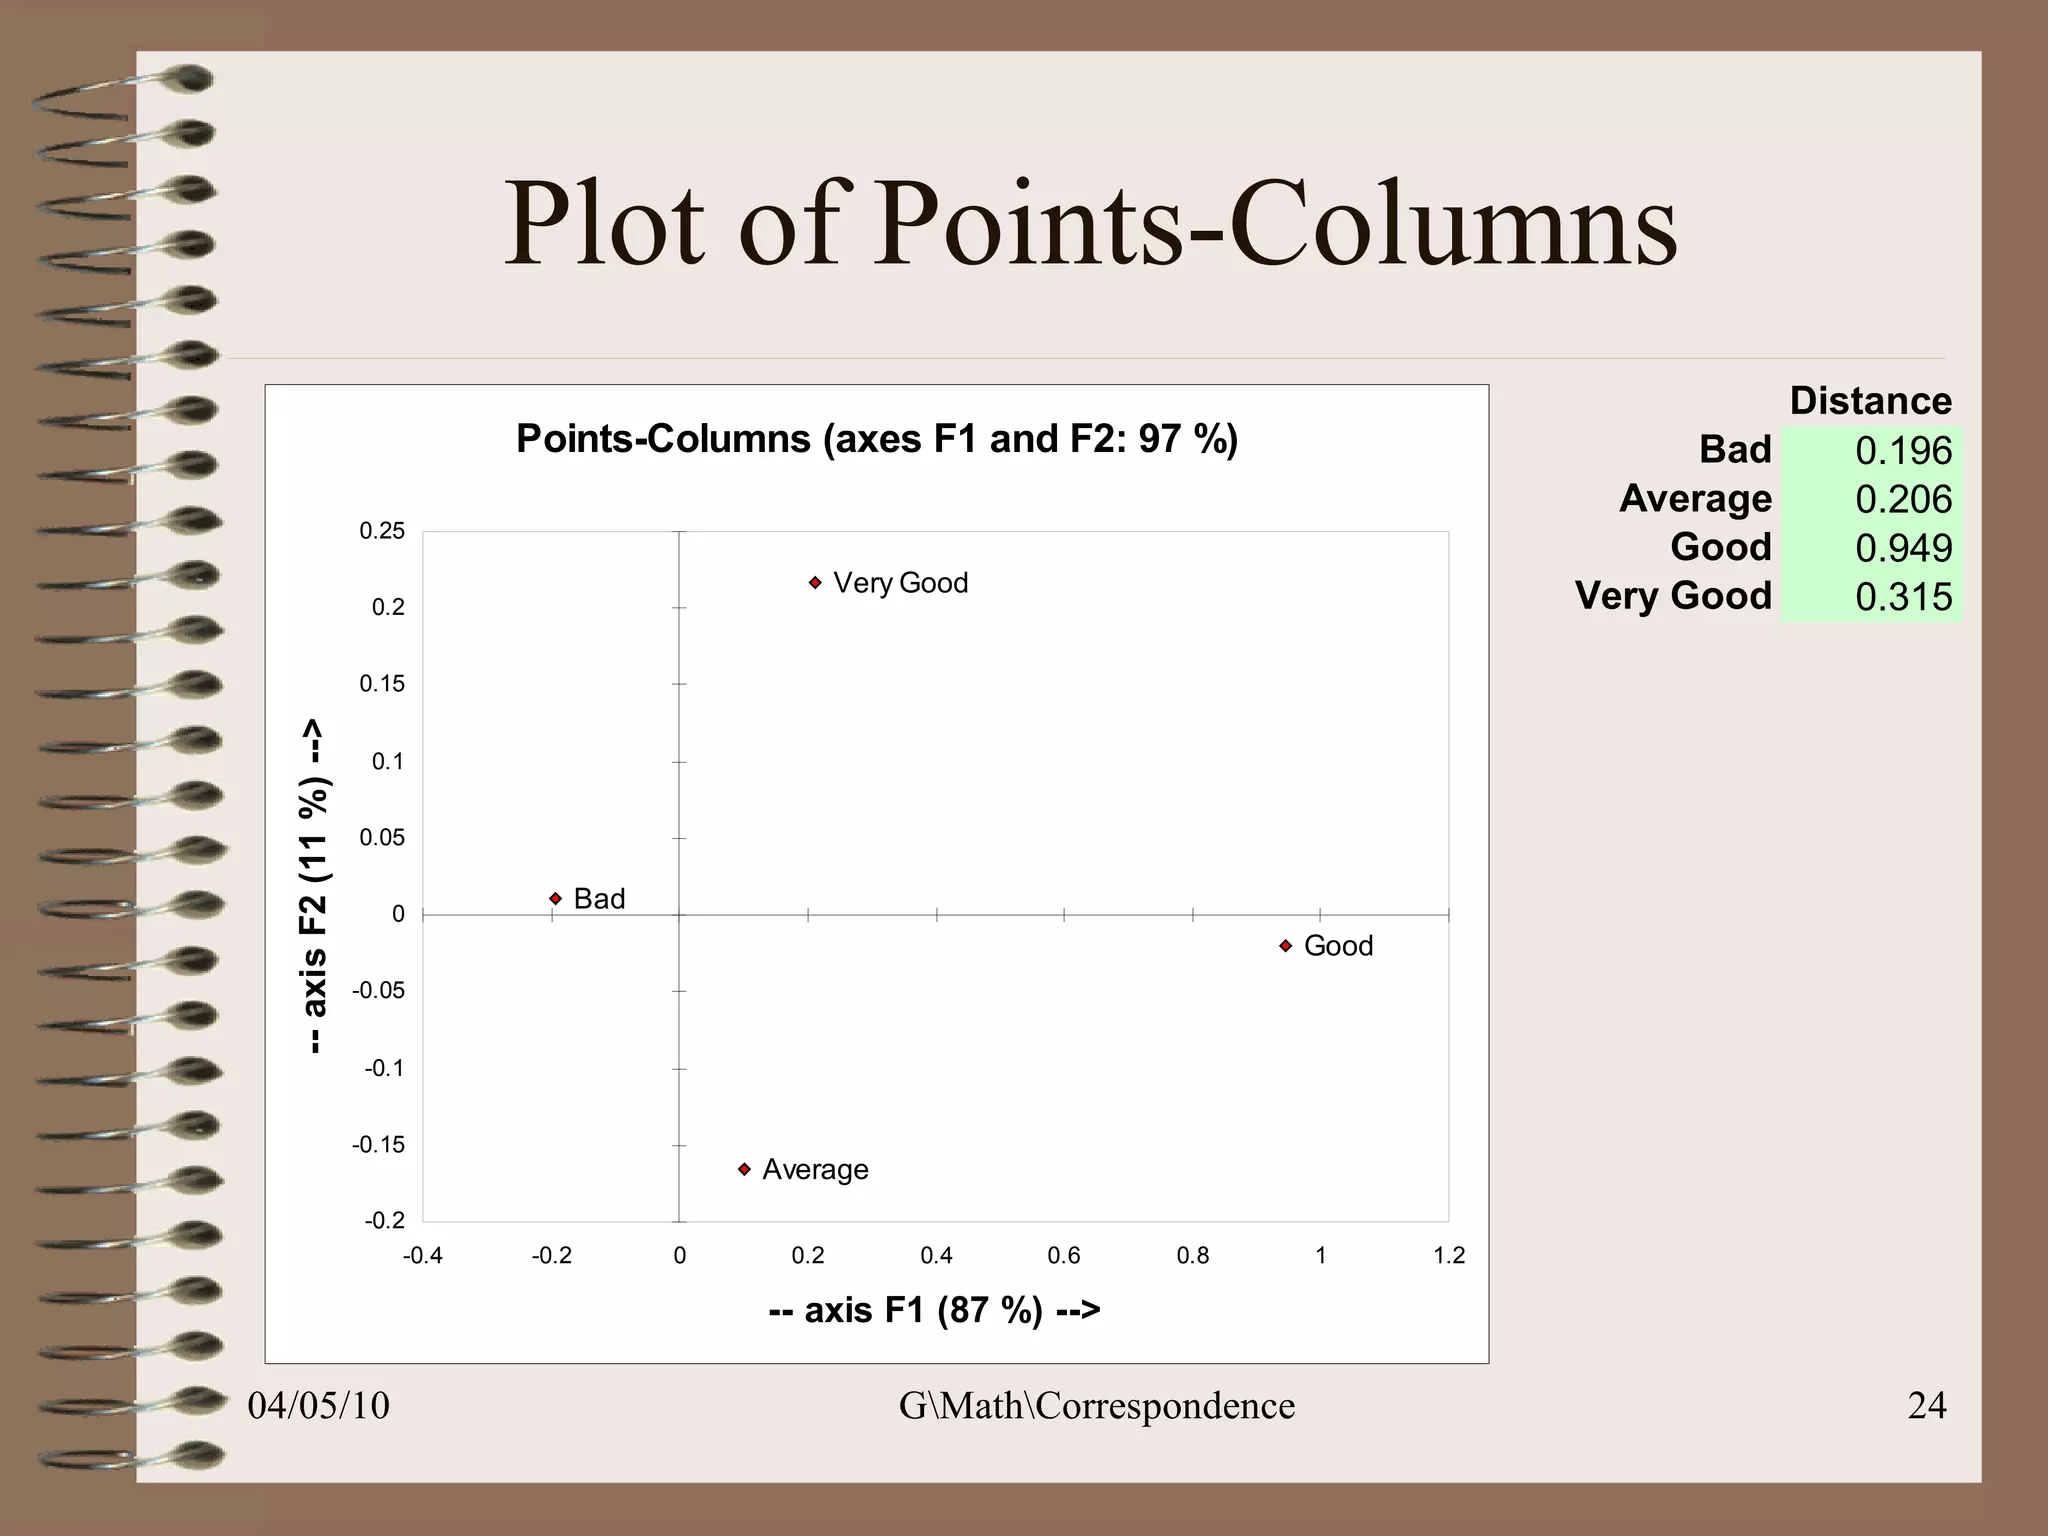
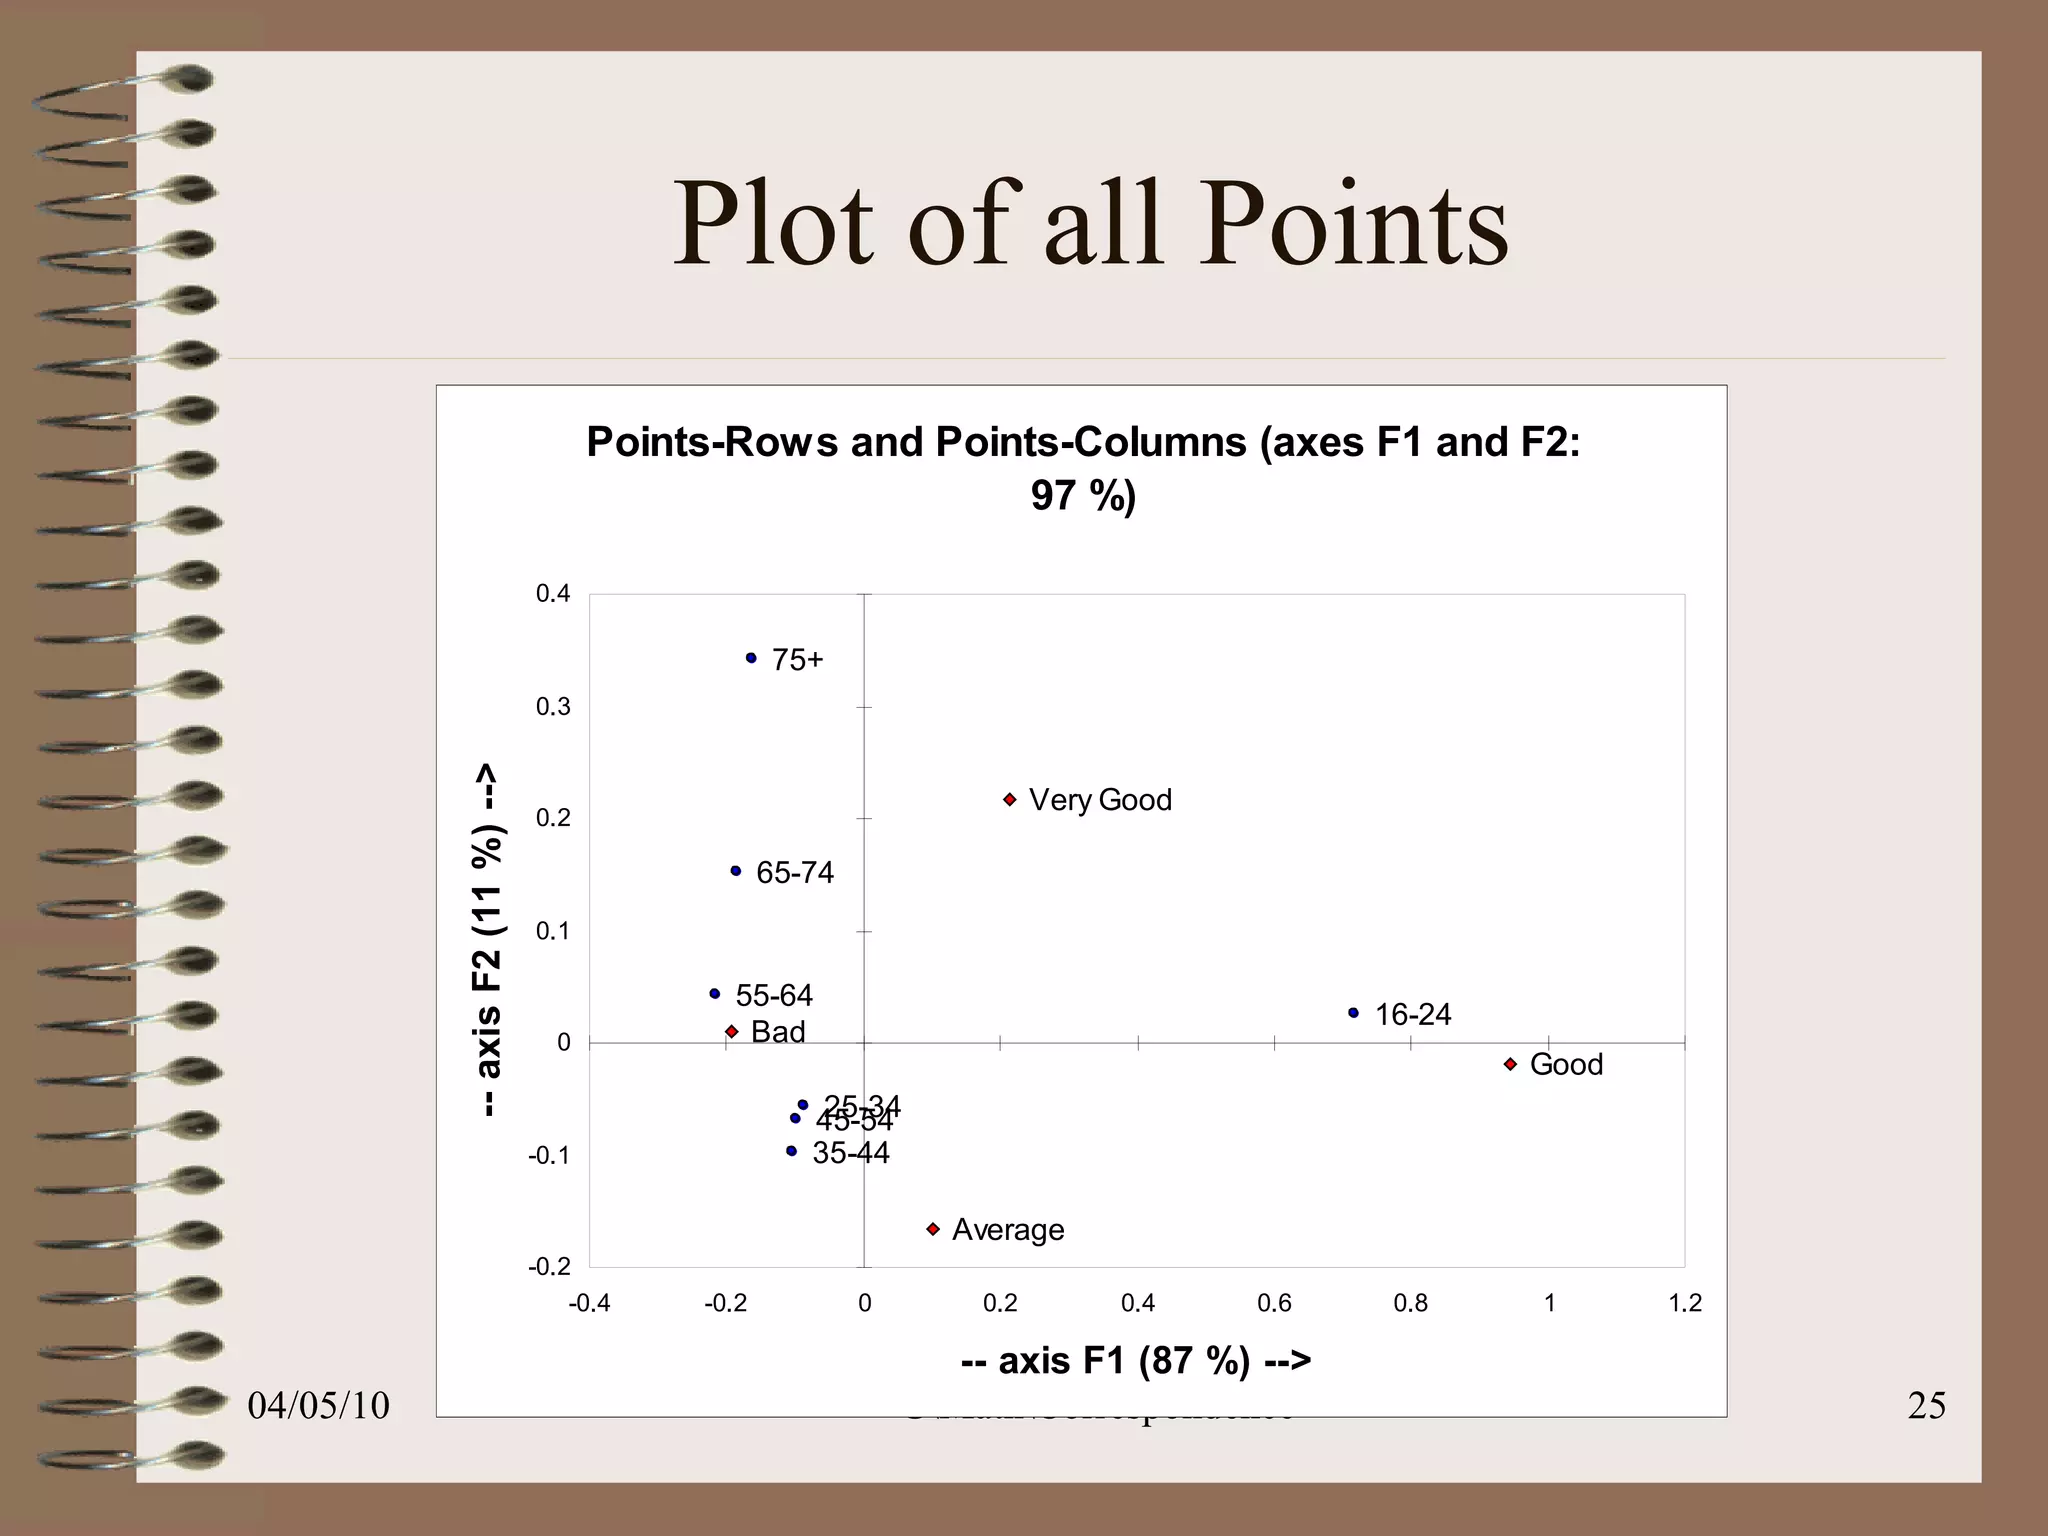
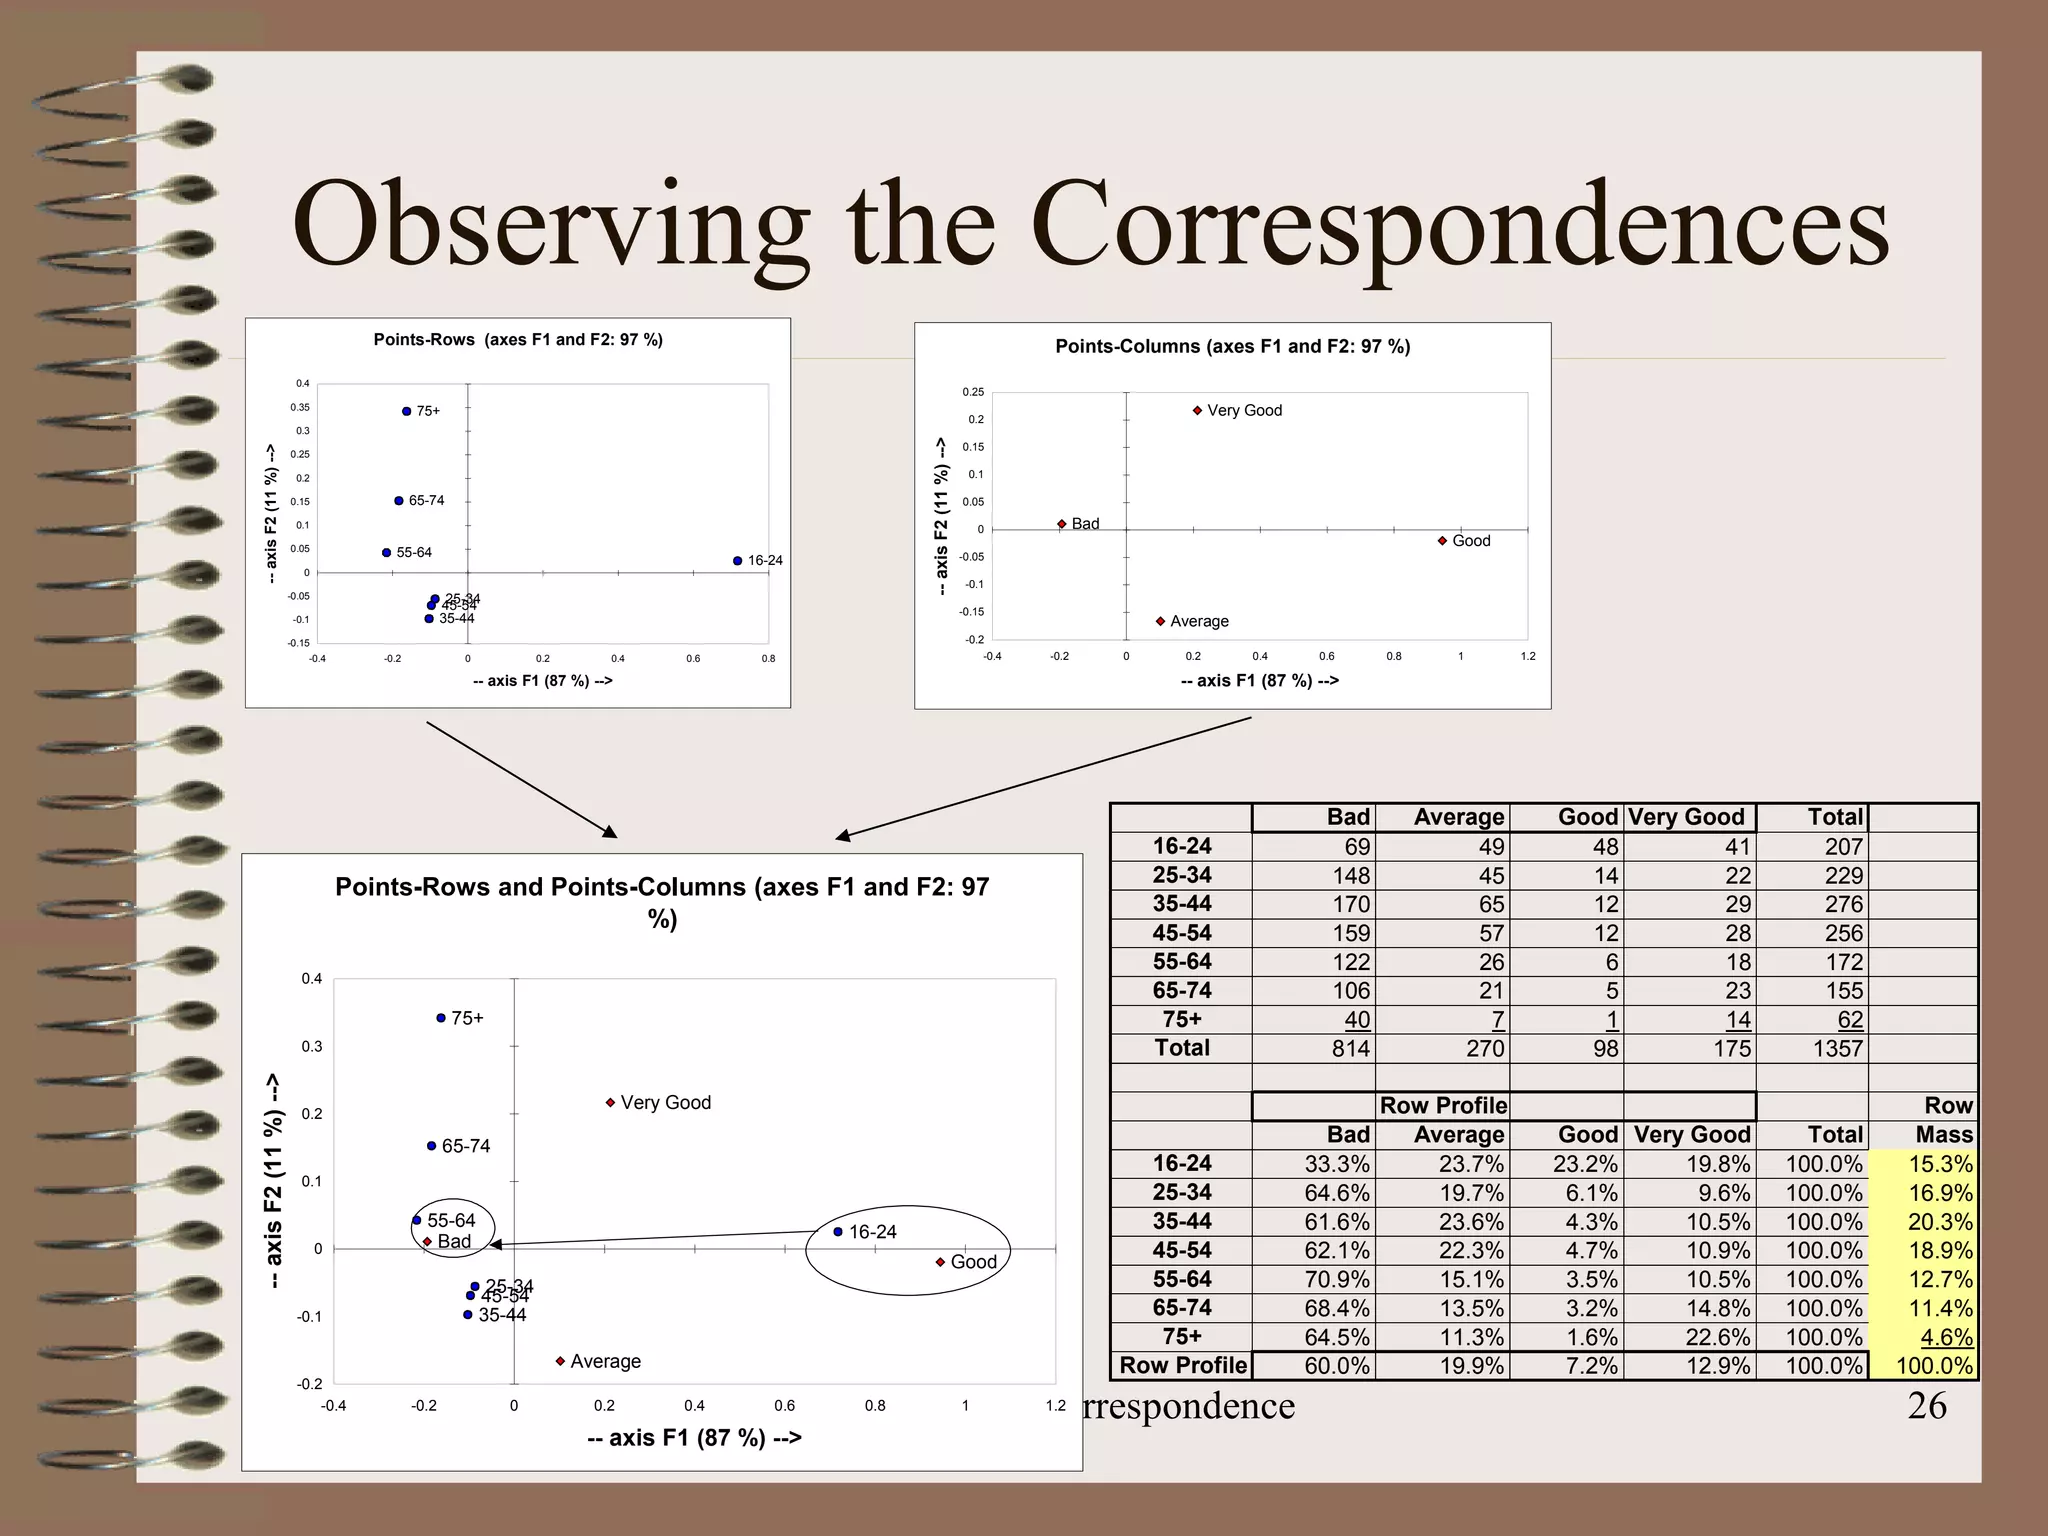
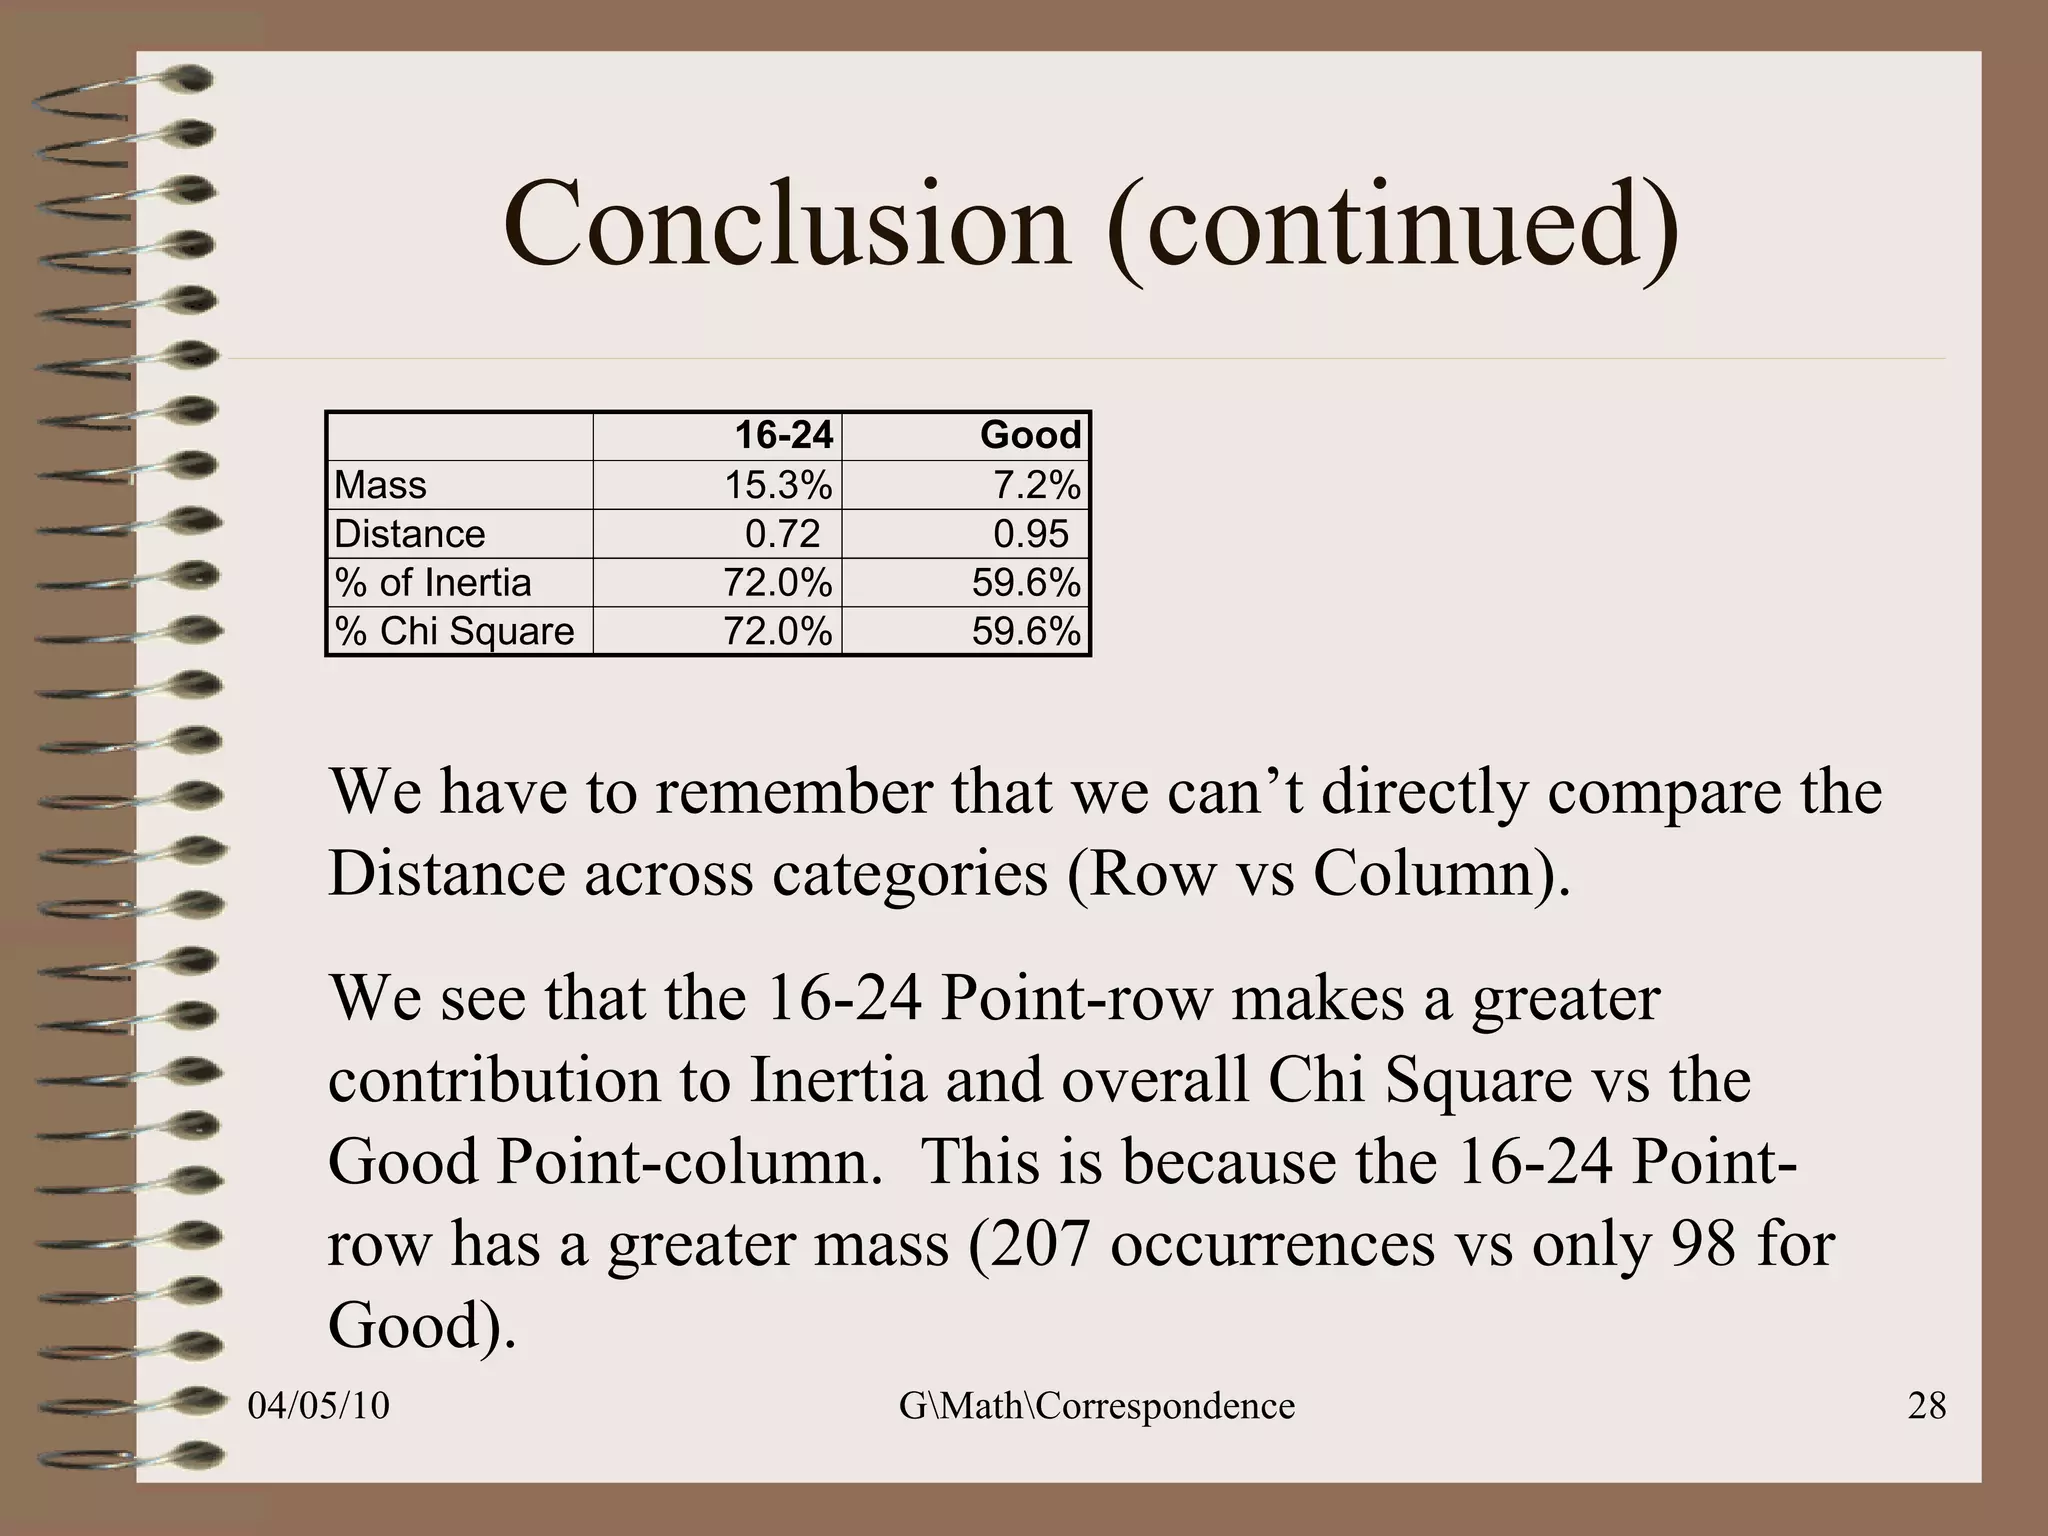

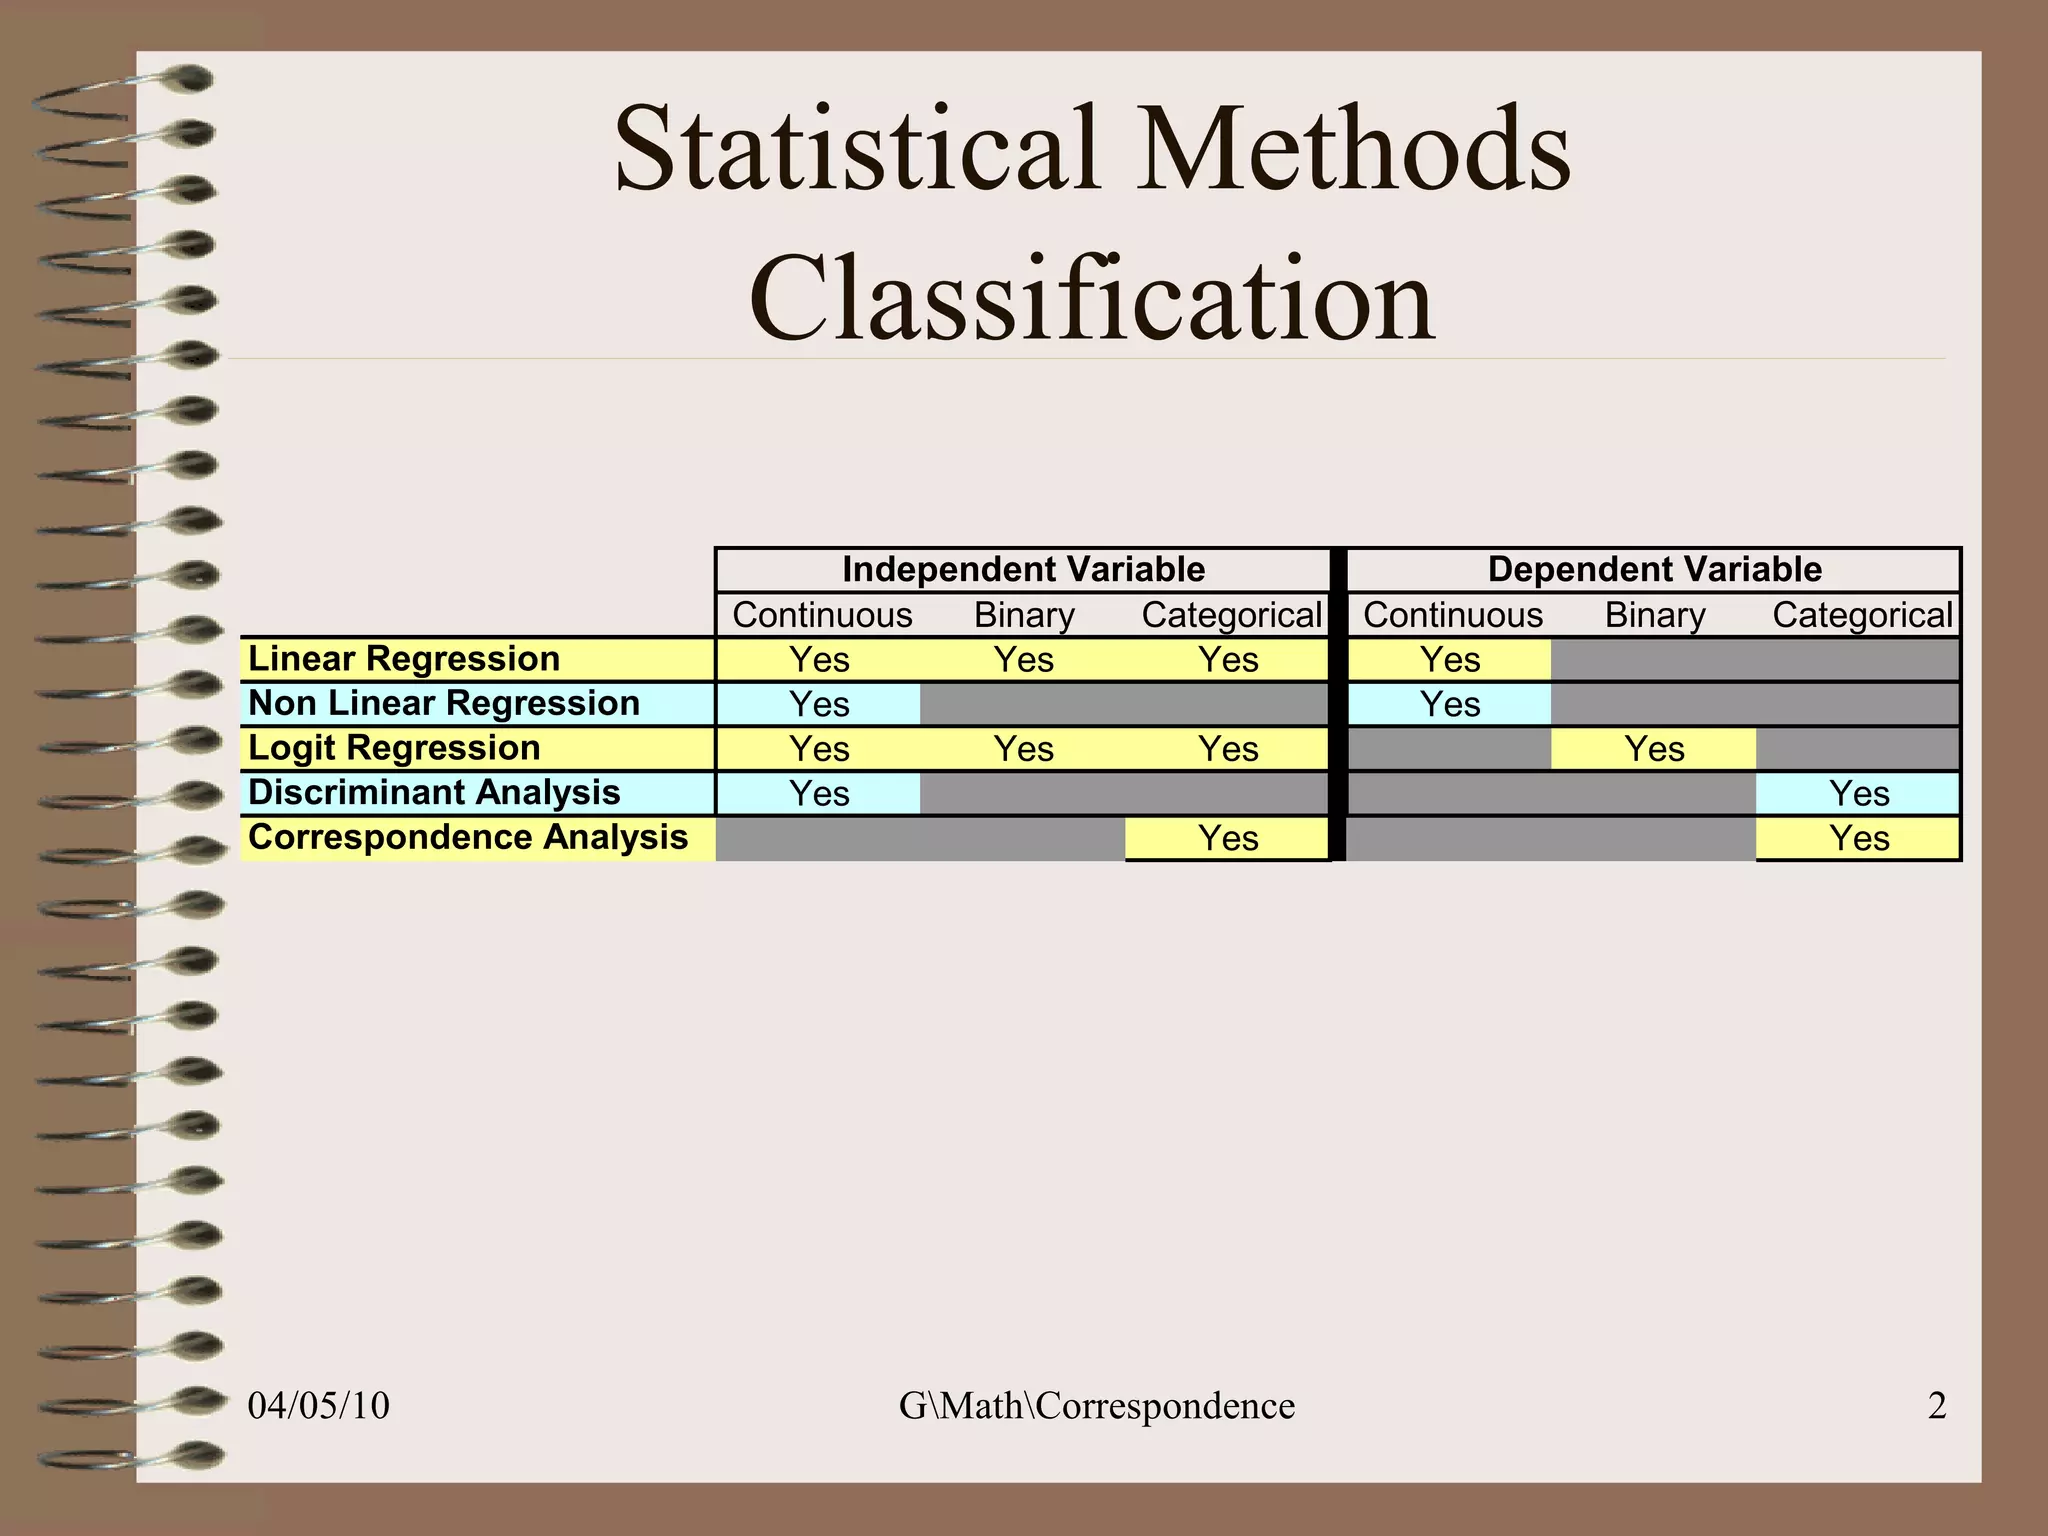
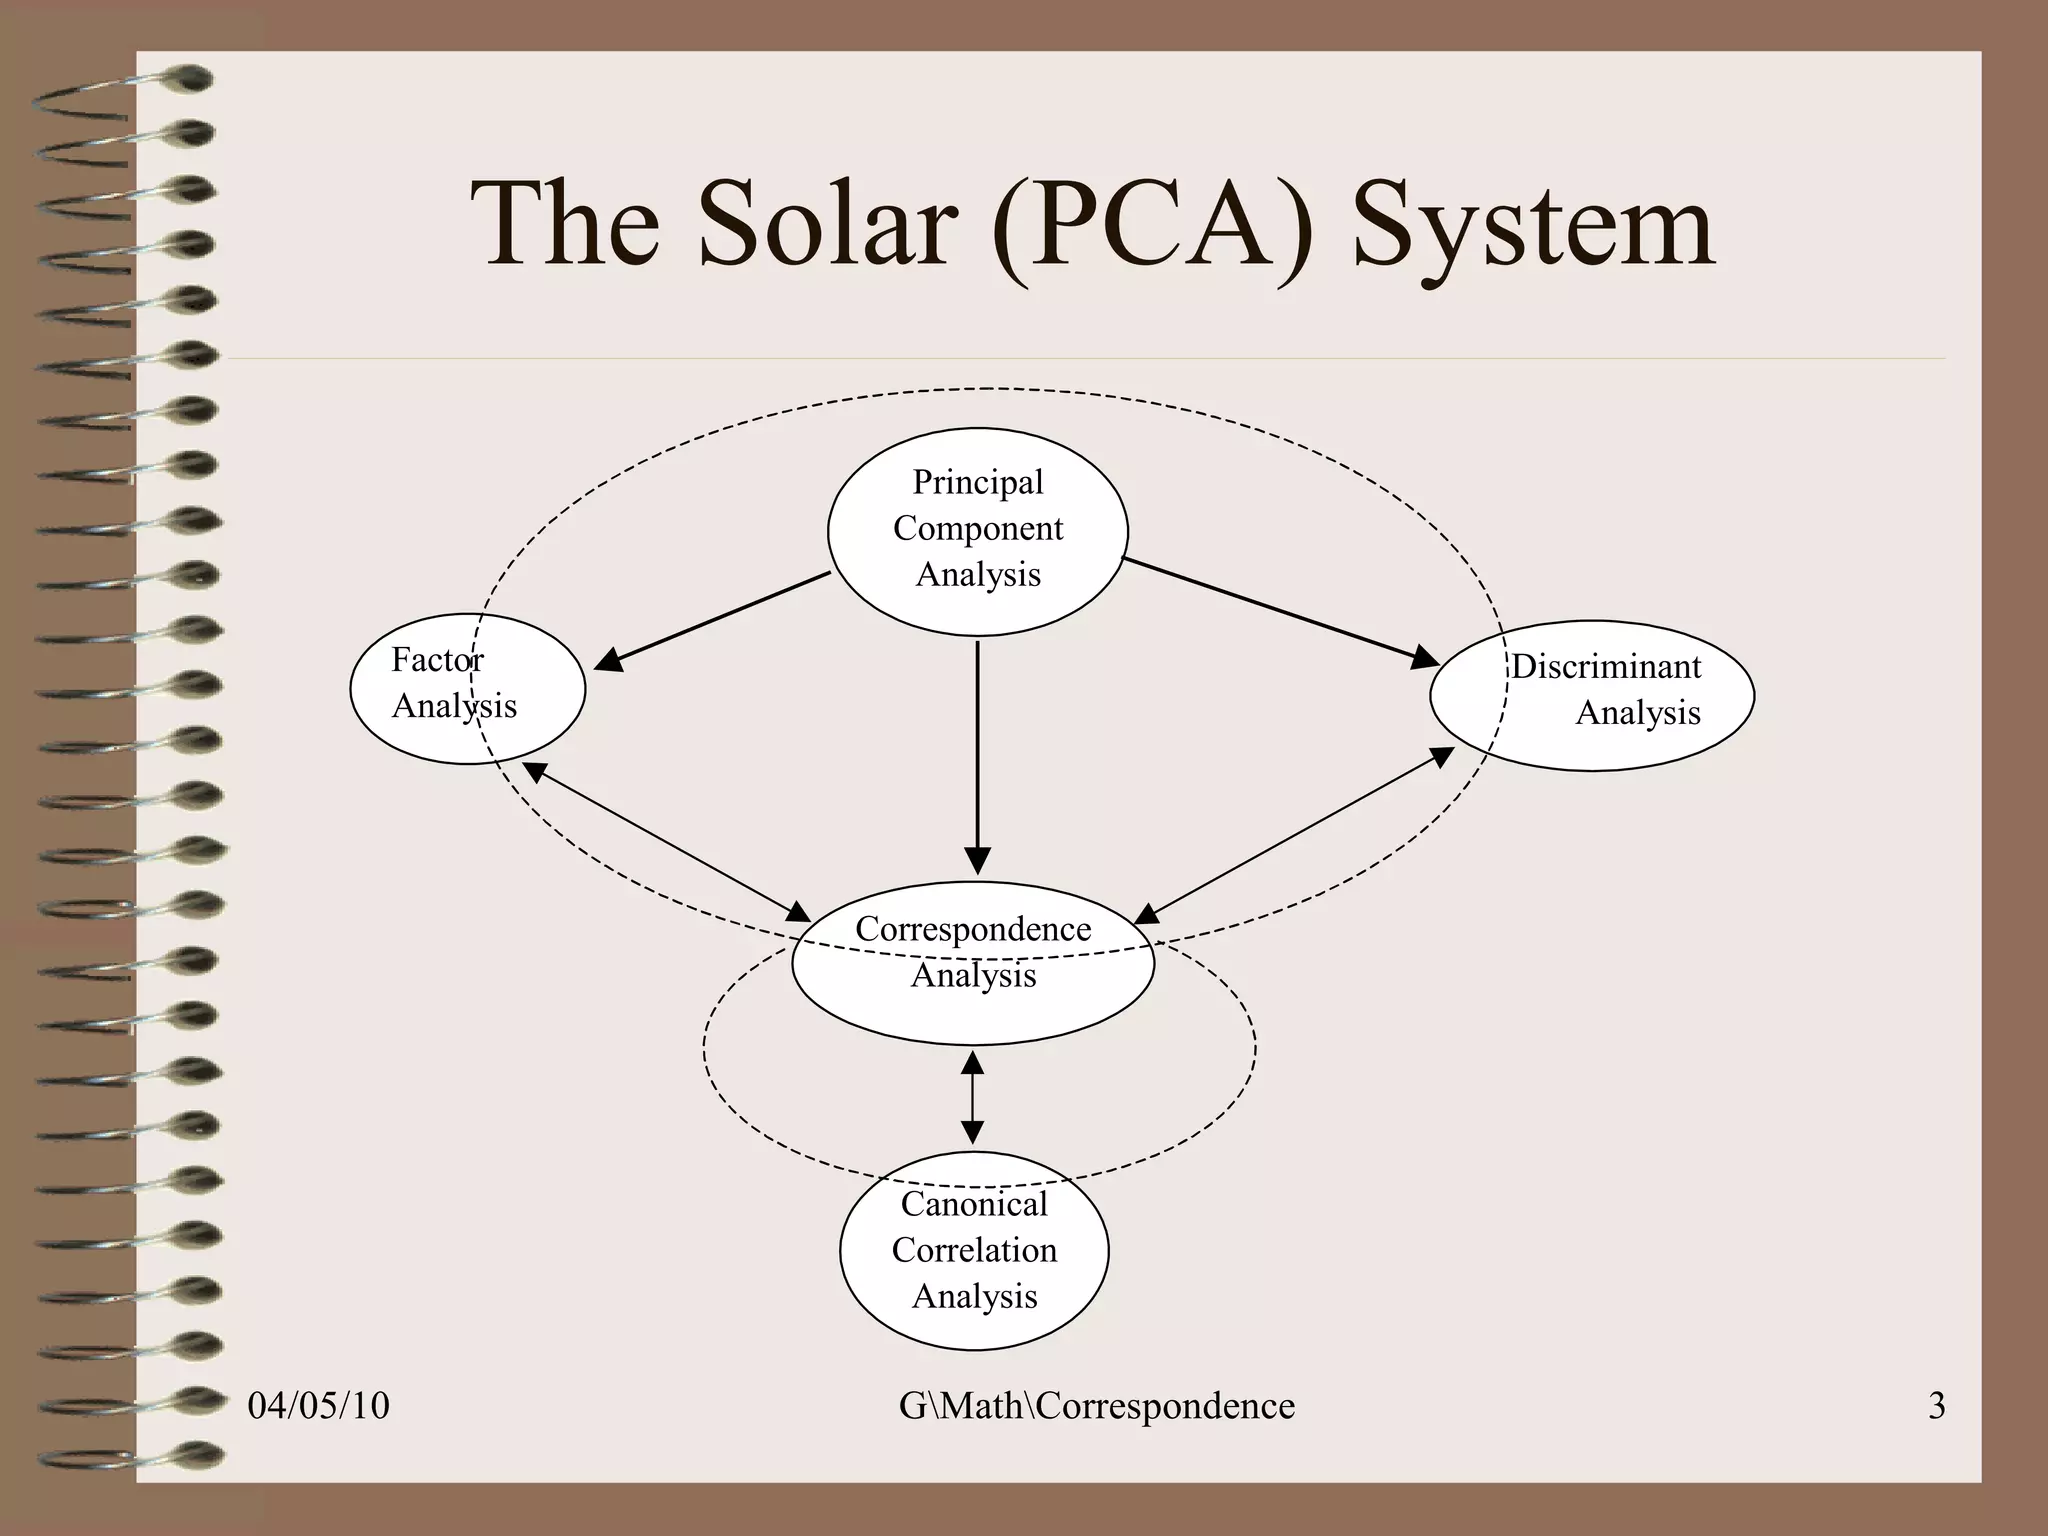
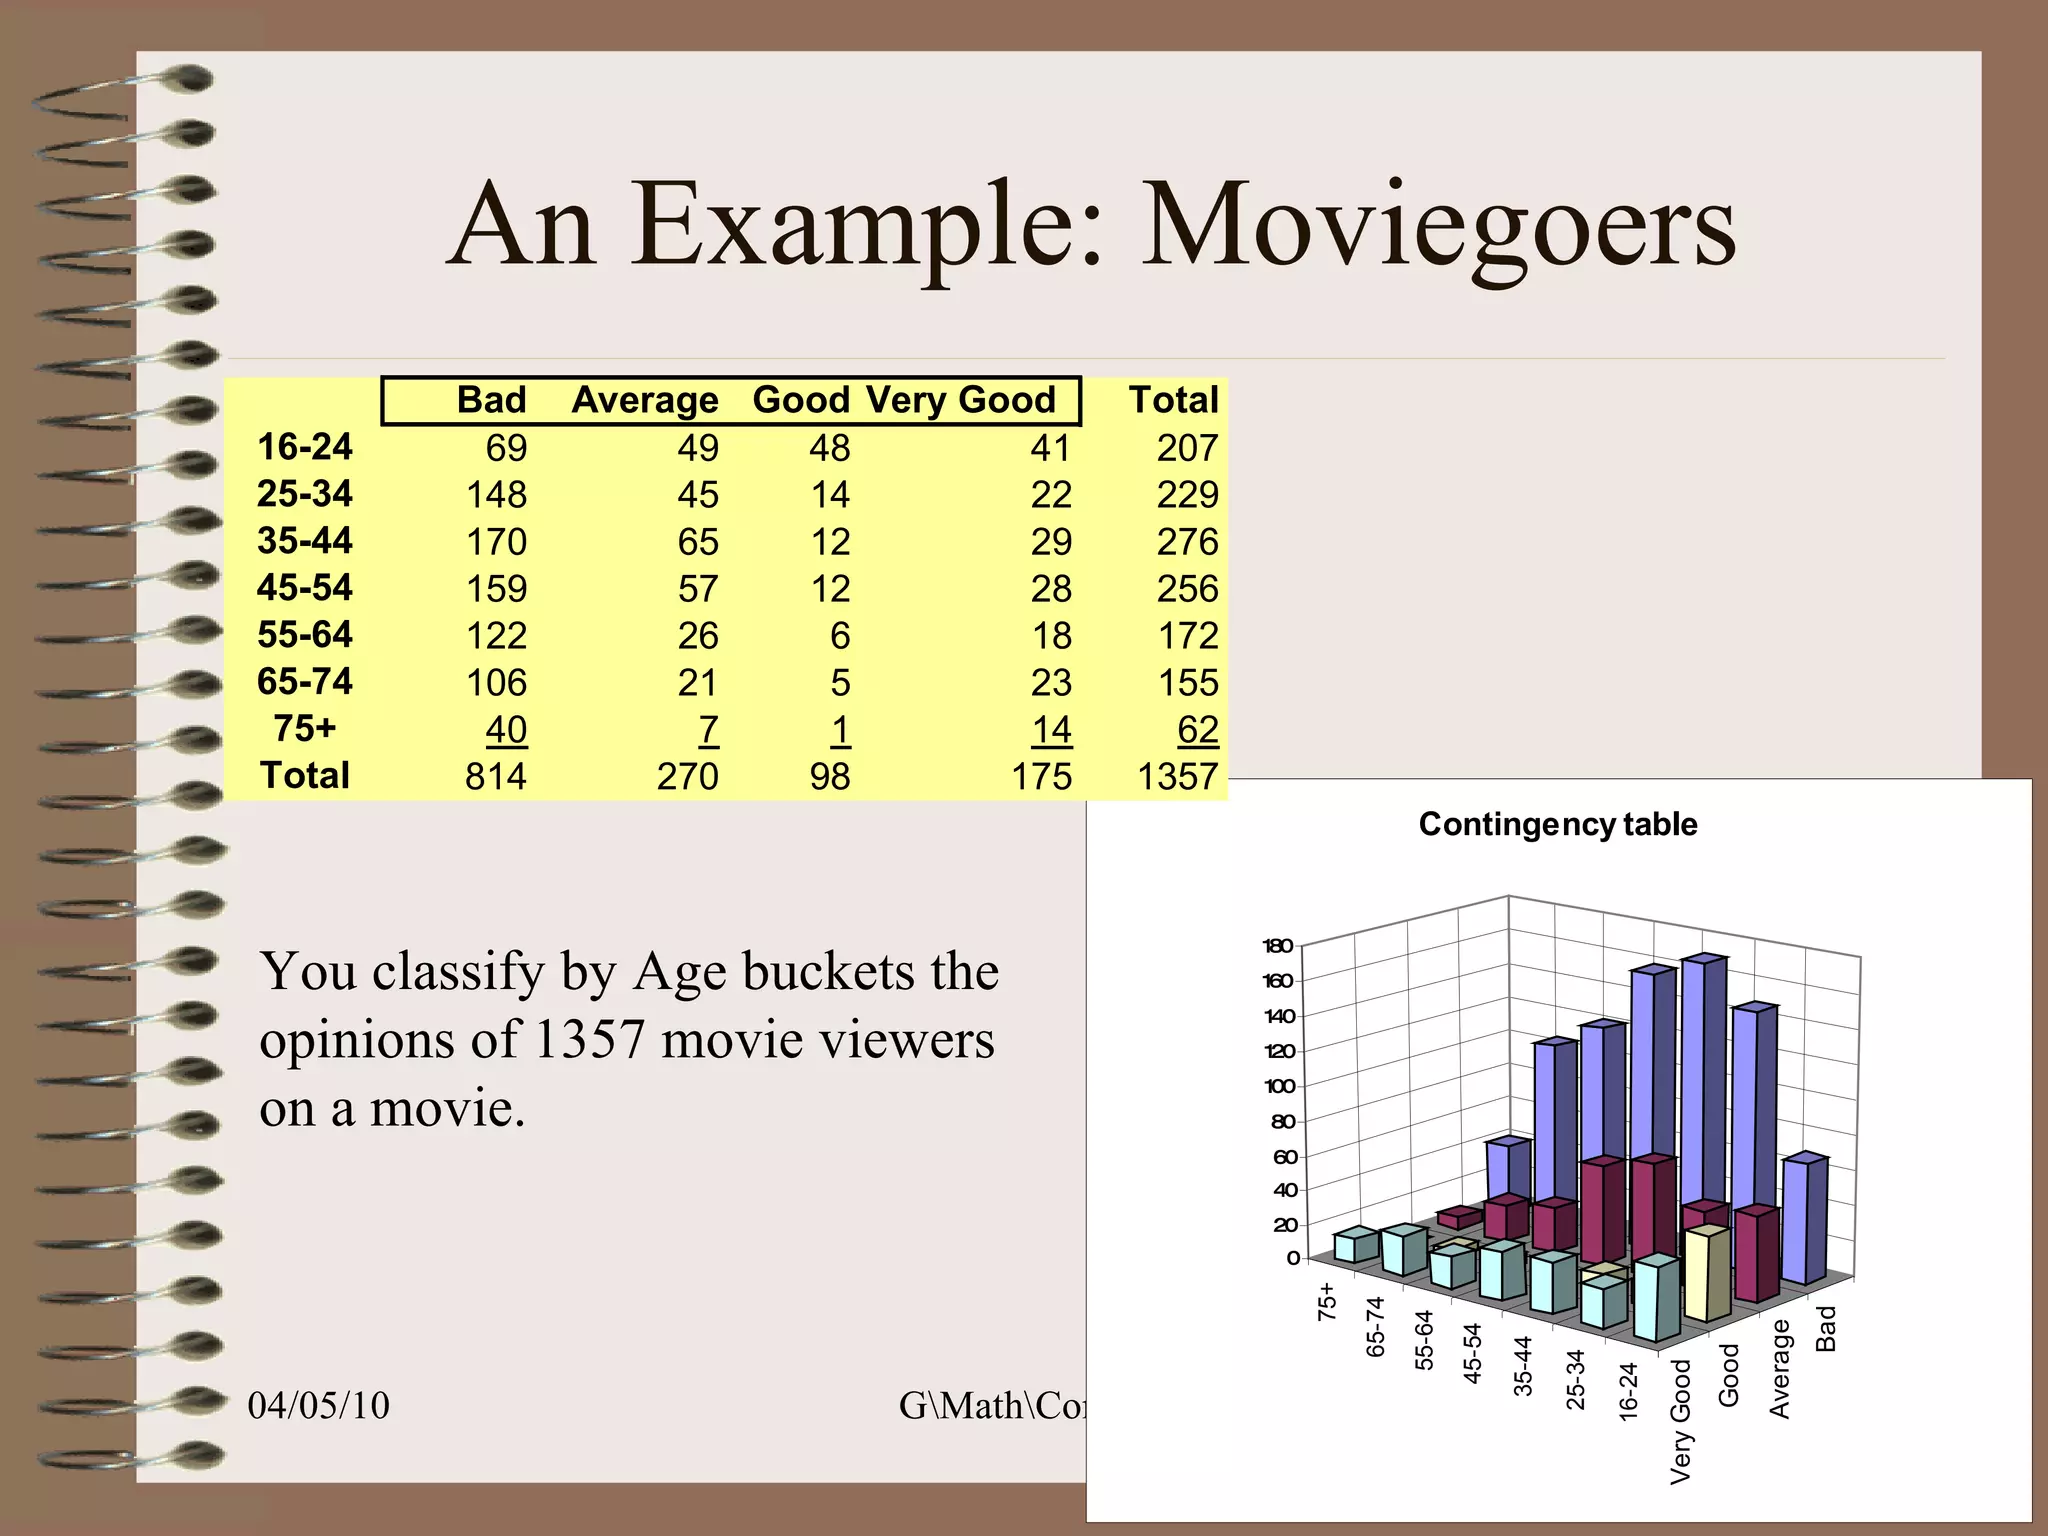
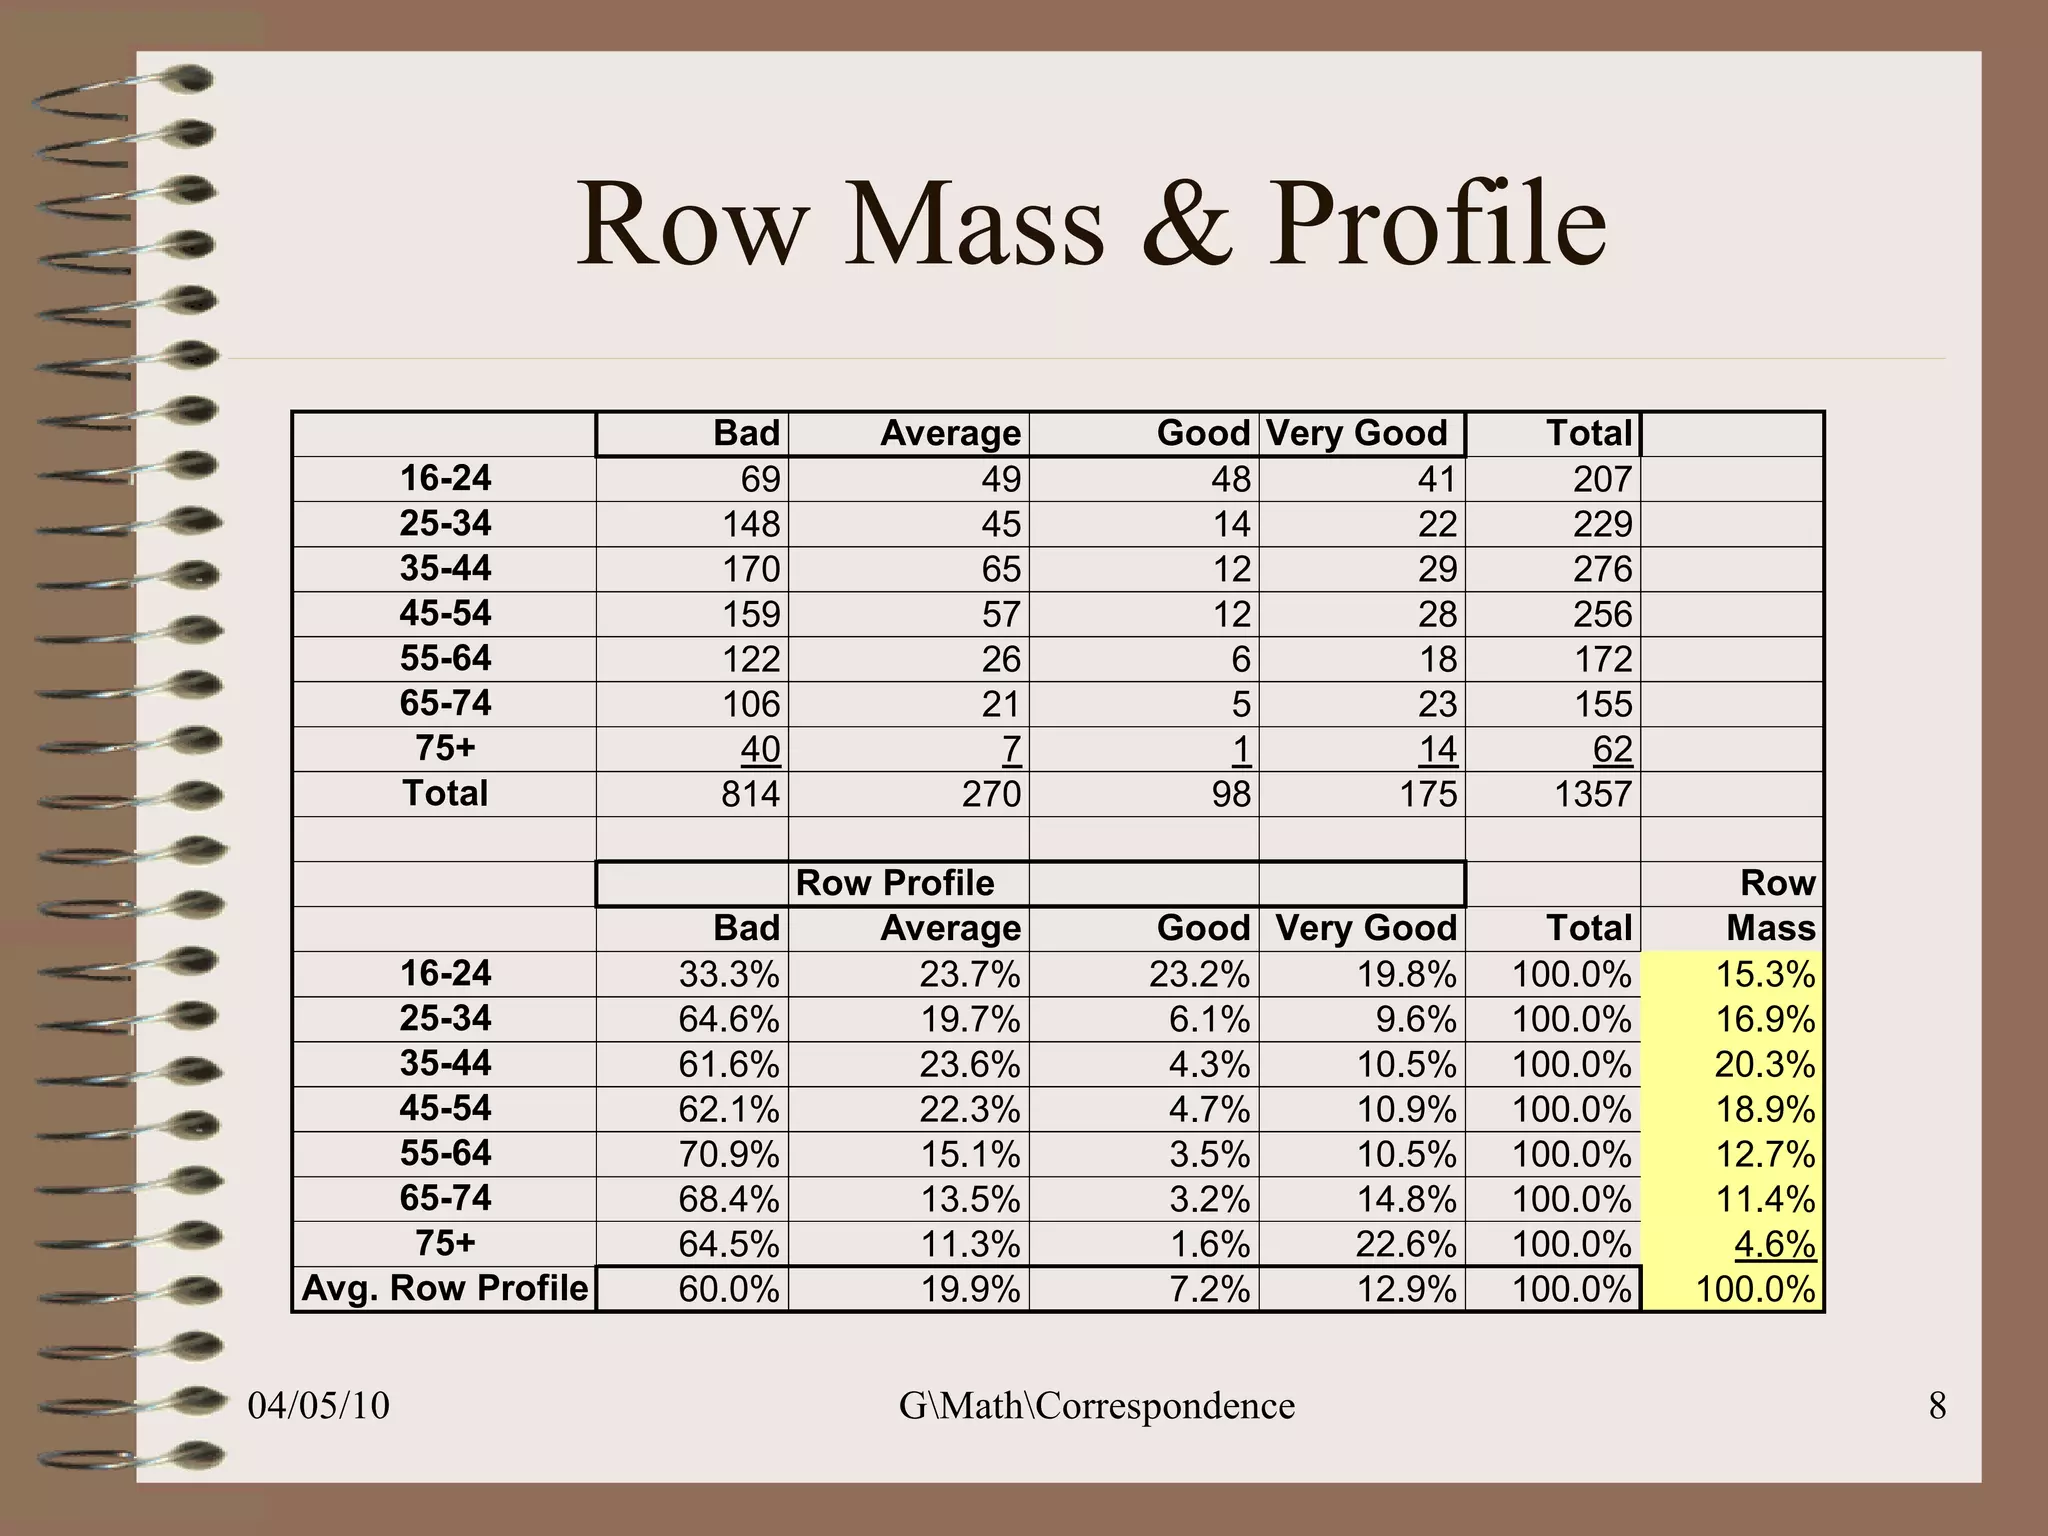
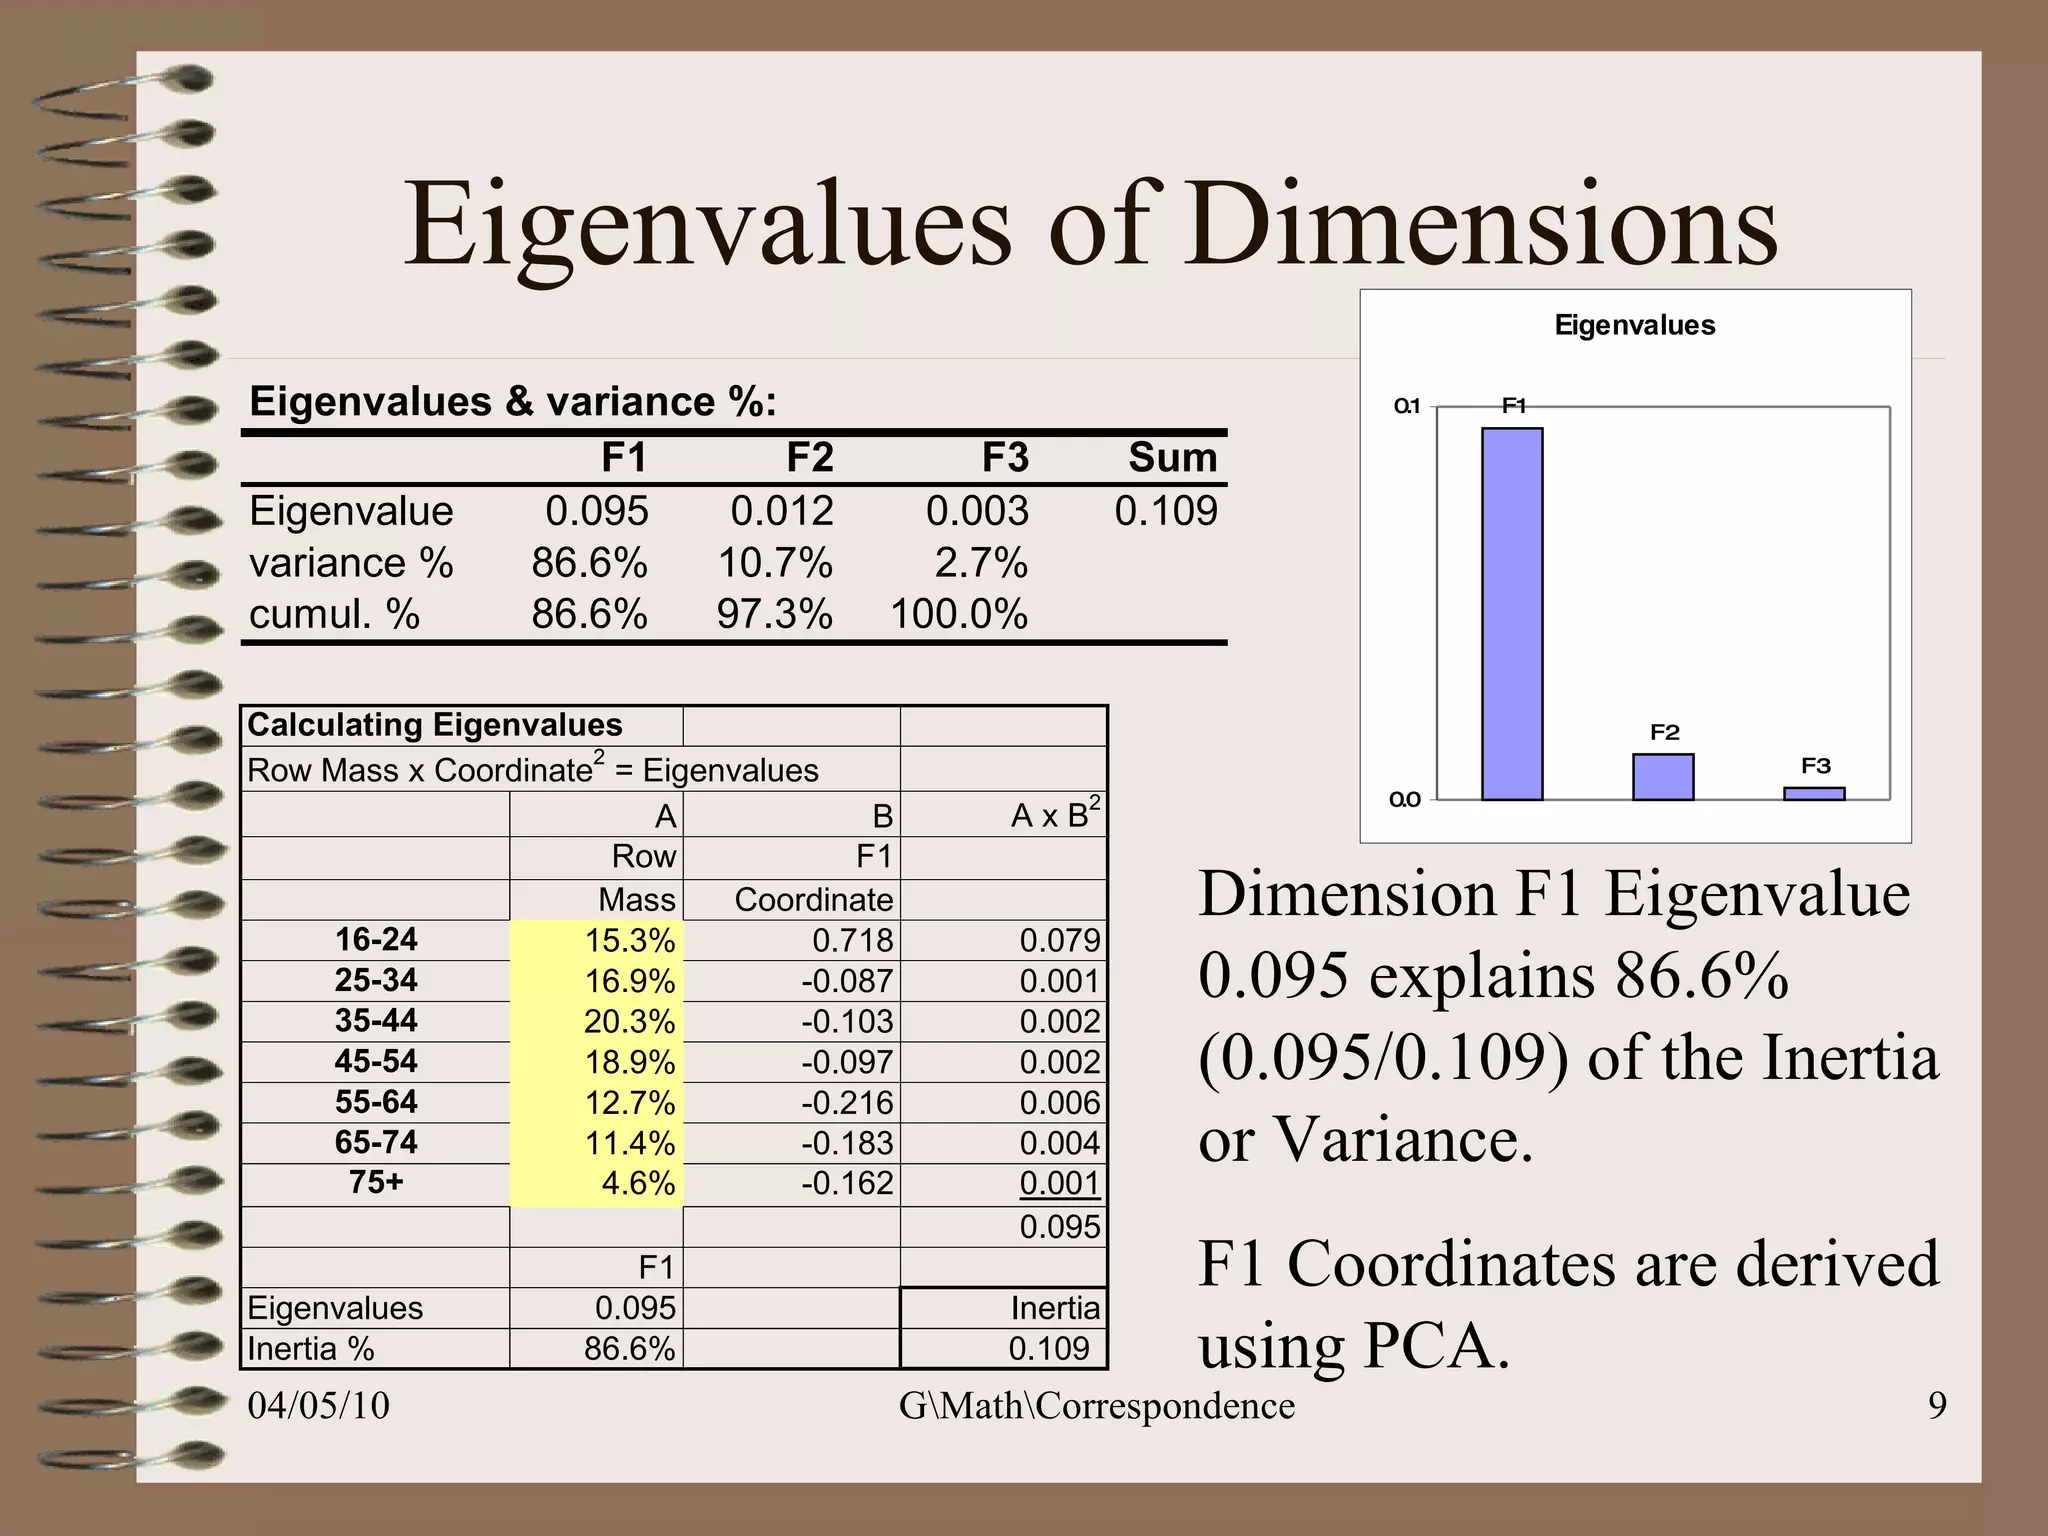
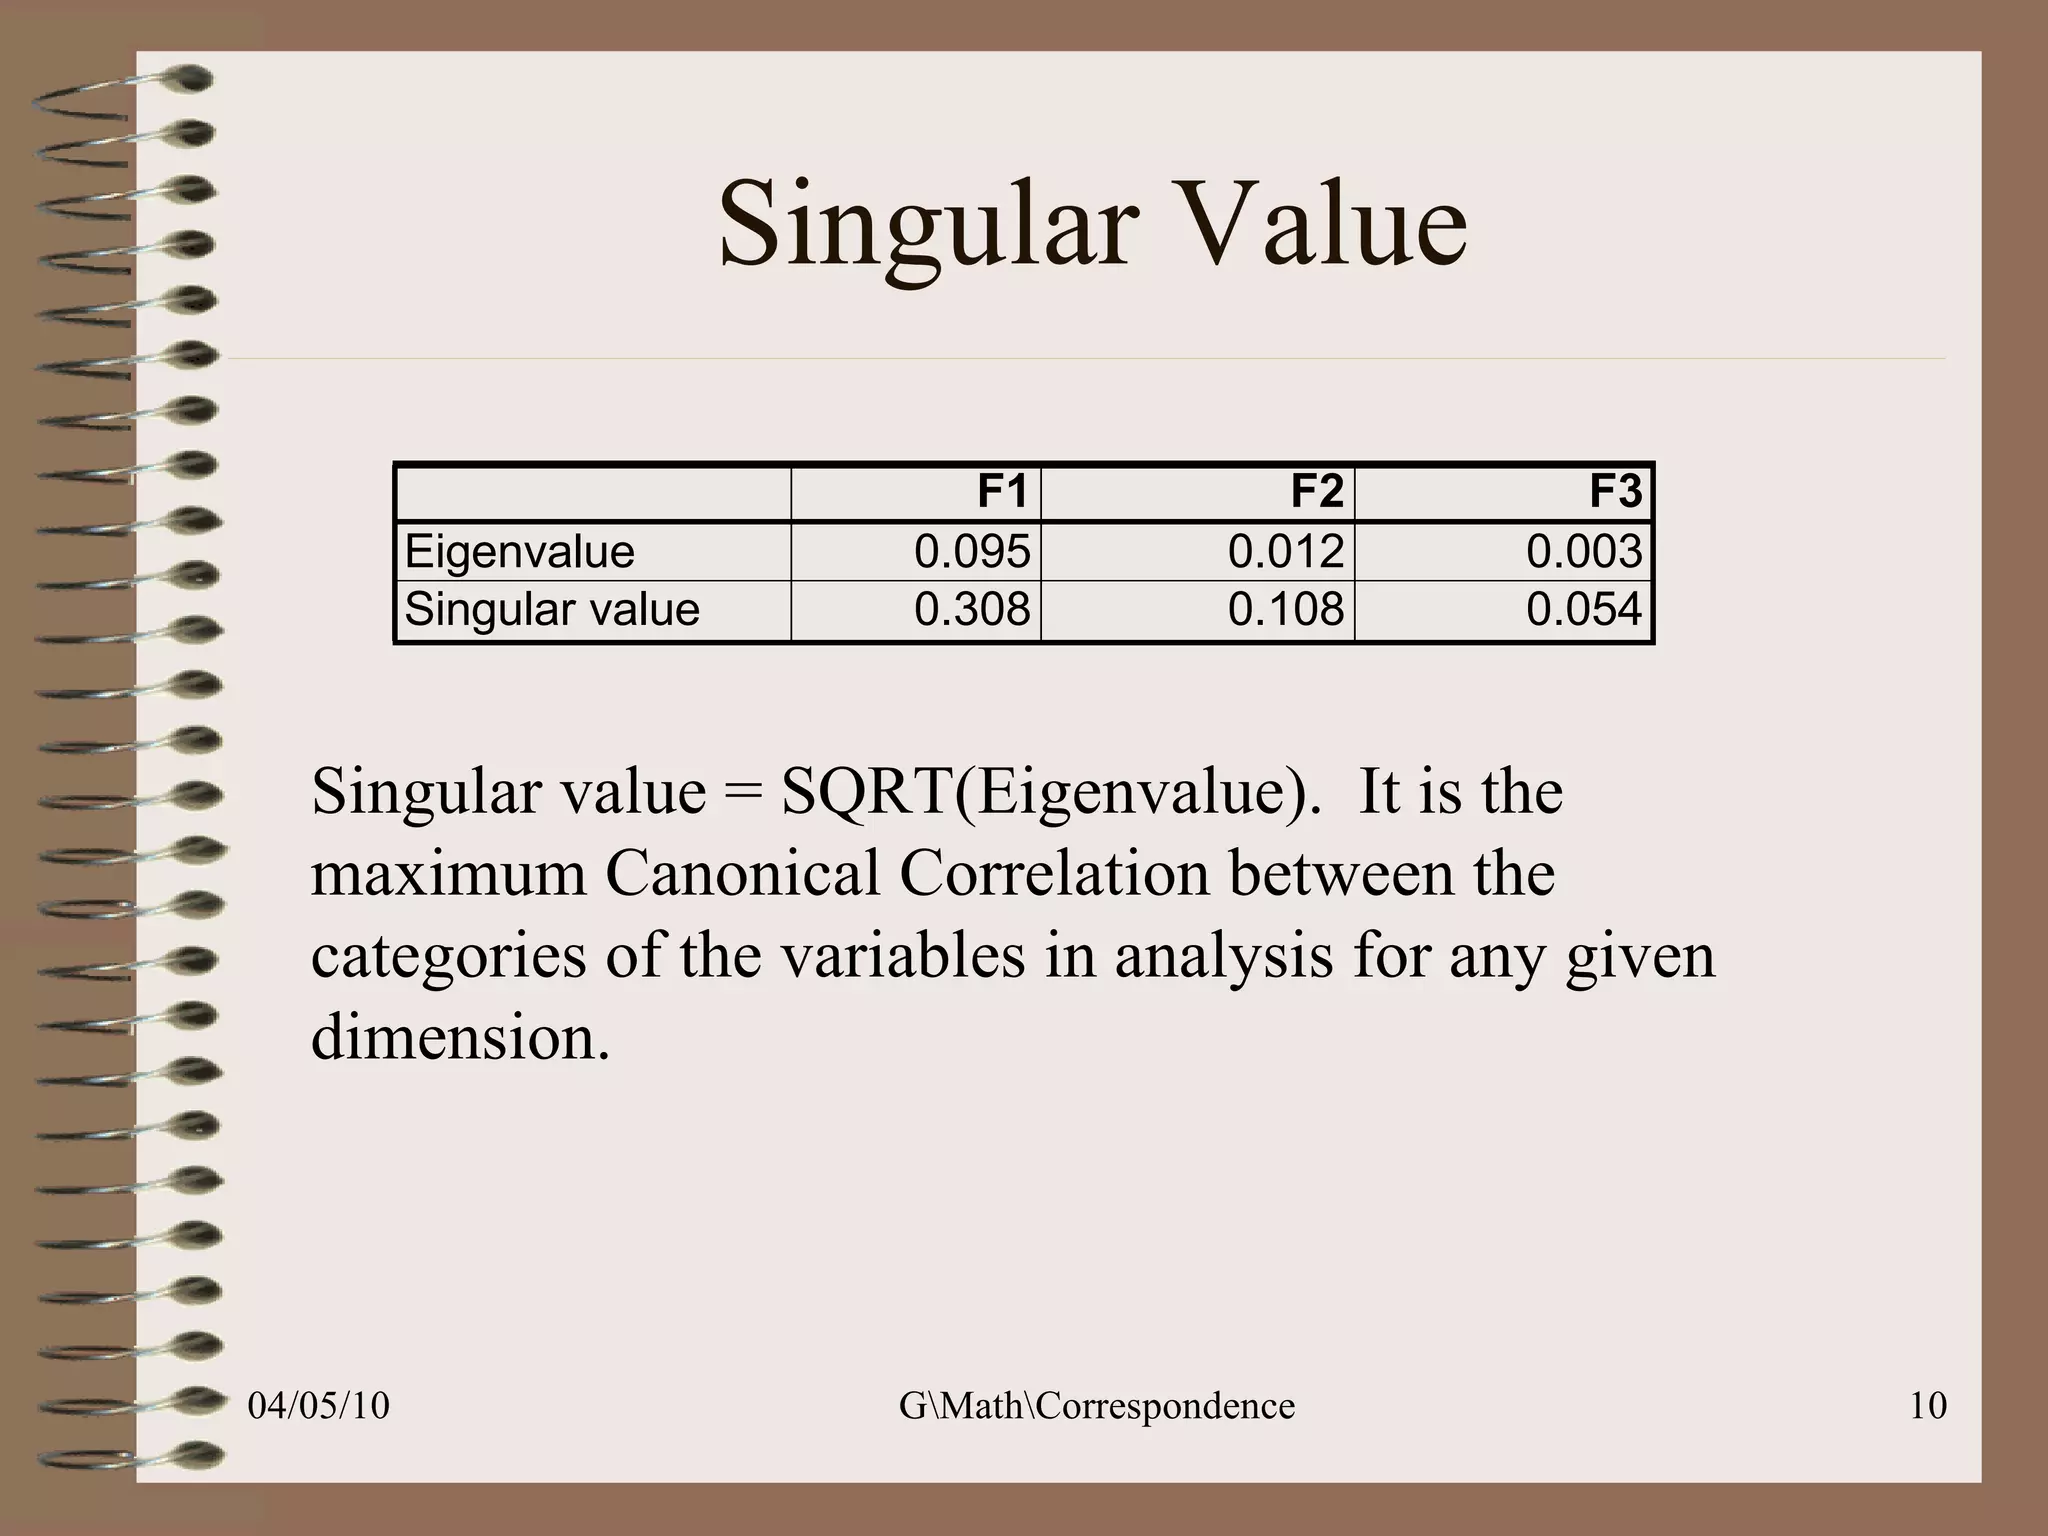
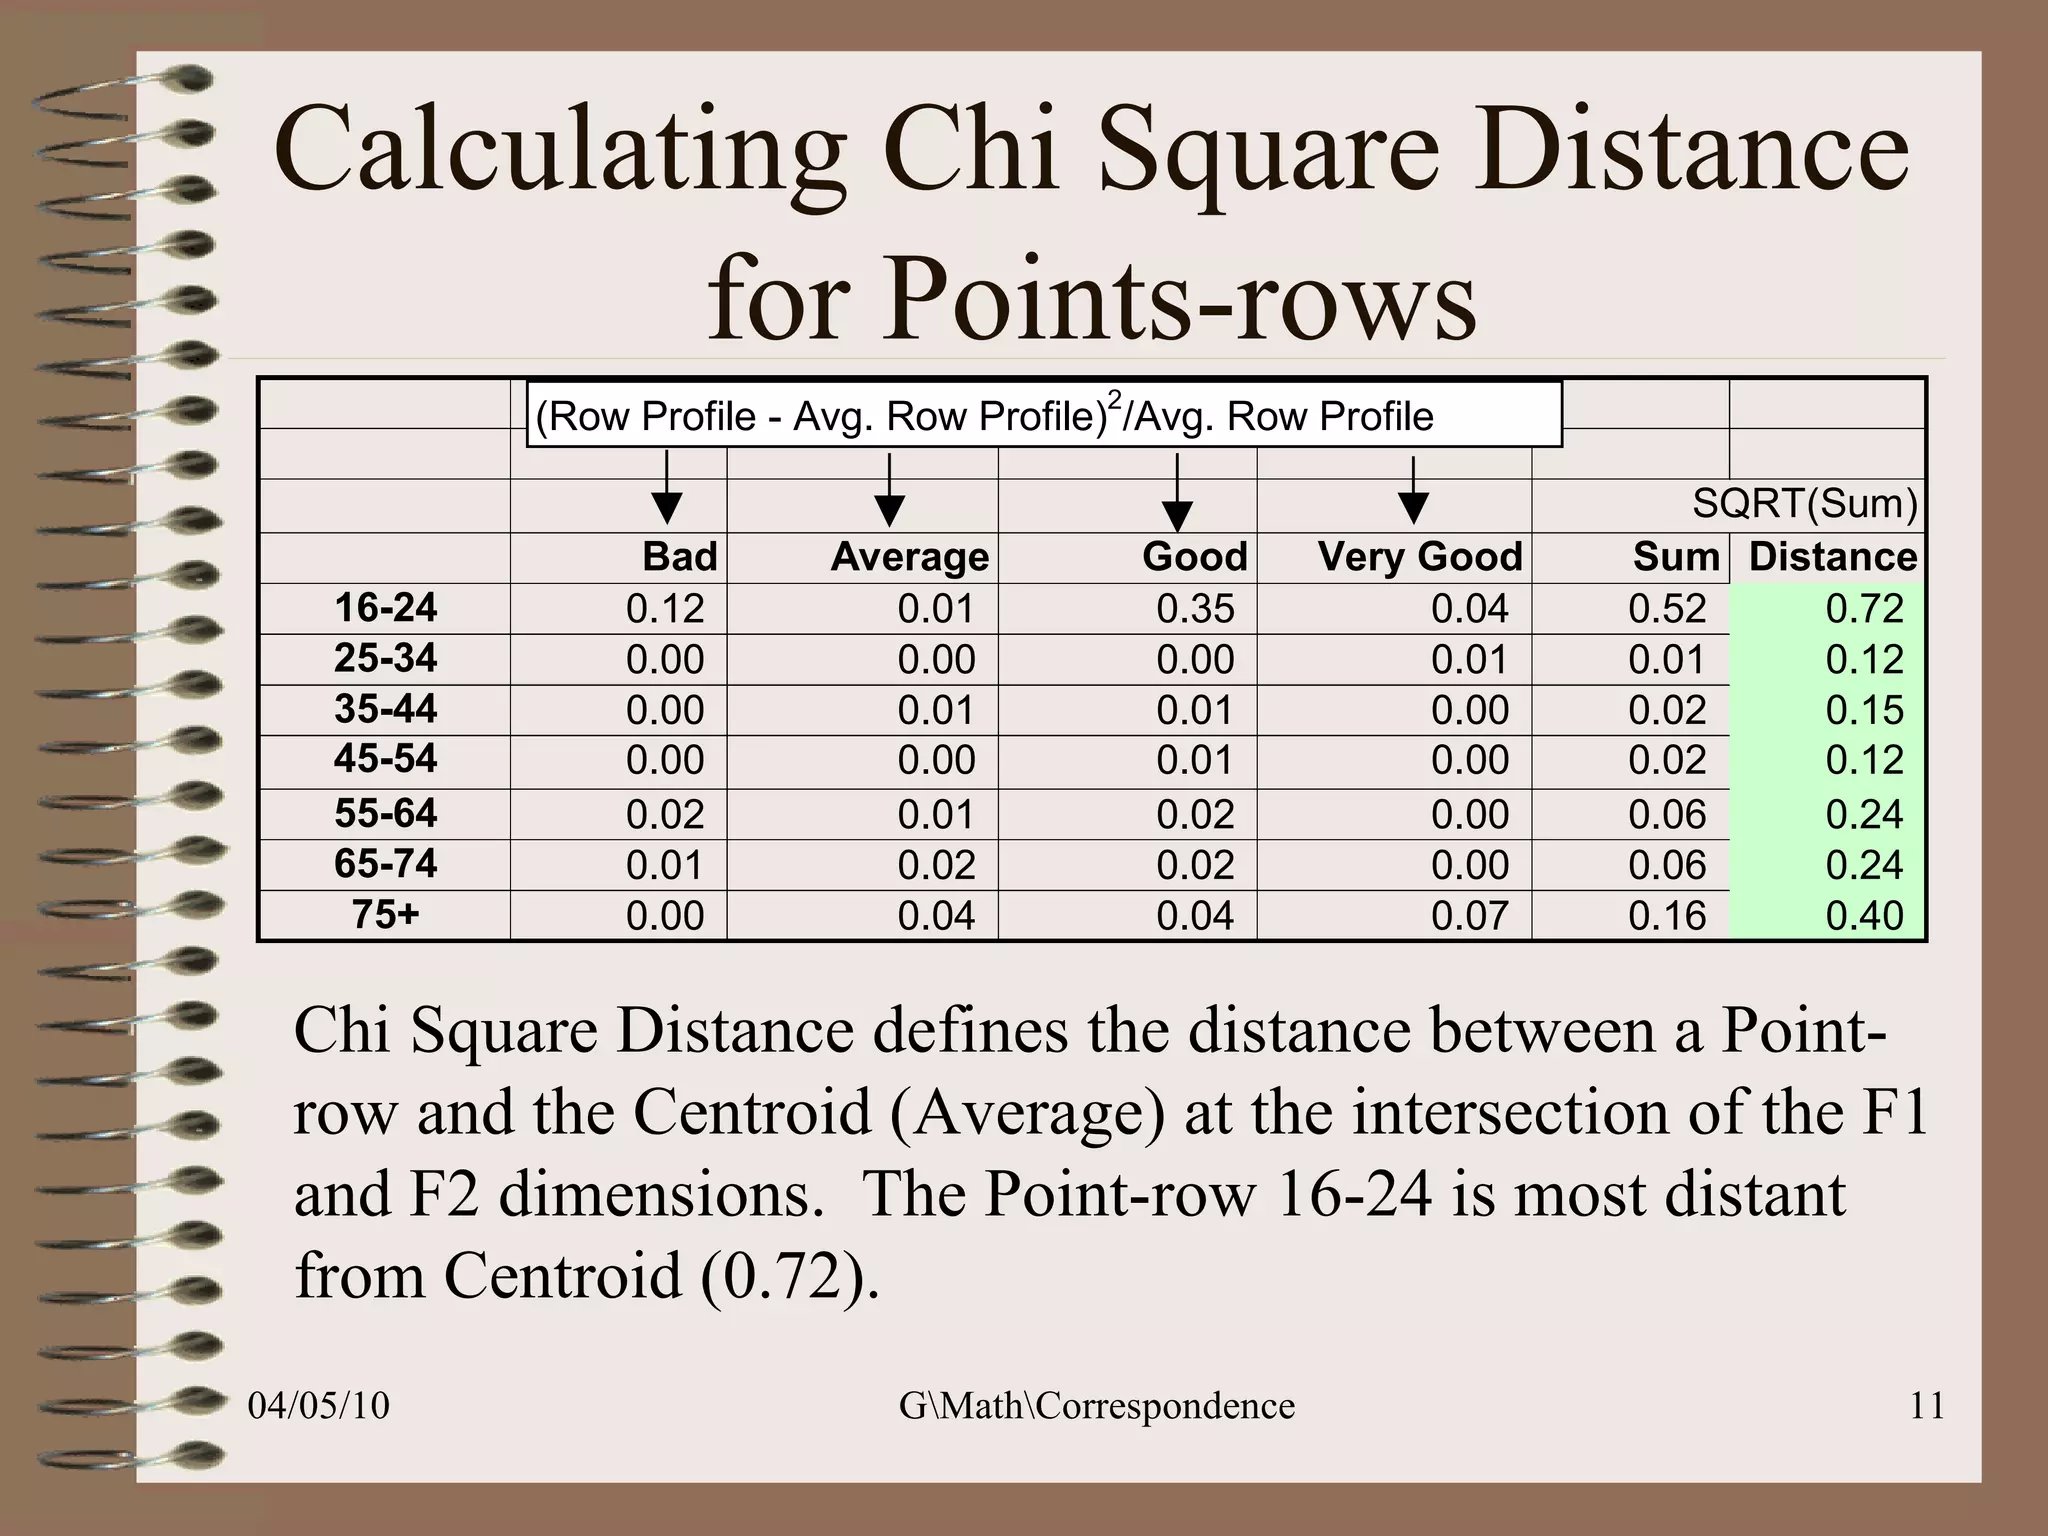
This document discusses correspondence analysis (CA), a technique that analyzes the association between two categorical variables. It provides an example of using CA to analyze the relationship between age groups and opinions on a movie from a survey of 1357 respondents. The analysis finds that the 16-24 age group and the "Good" opinion category contribute most to the variation in the data and are the most distant from the average categories. CA represents the data in a two-dimensional space to visualize these relationships between the categorical variables.