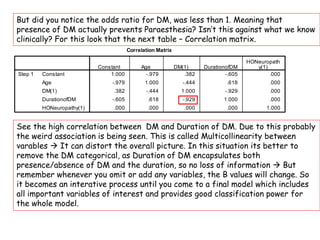
Downloaded 108 times


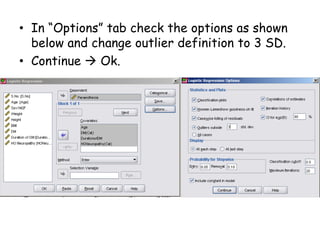
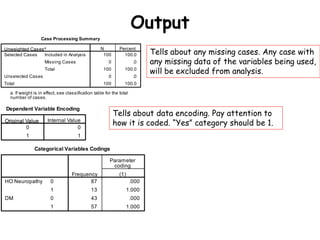
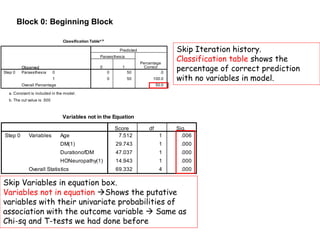
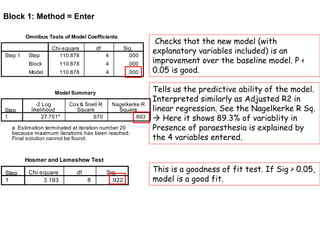
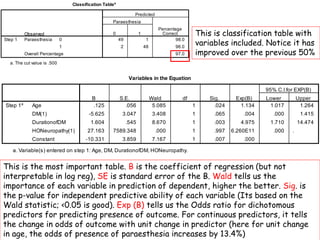

Binary logistic regression analysis is used to predict a dichotomous dependent variable from continuous and/or categorical independent variables. SPSS is used to conduct binary logistic regression by entering the dependent variable as 1/0 and independent variables as predictors, and the output provides coefficients, odds ratios, classification tables, and goodness of fit tests. Factors like multicollinearity between predictors and sample size need to be considered to develop the best fitting and most predictive logistic regression model.