Download to read offline

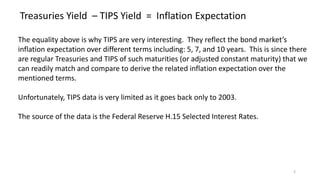
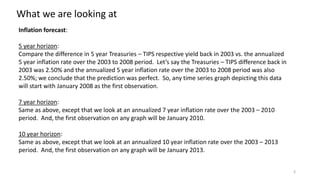
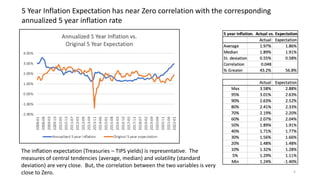
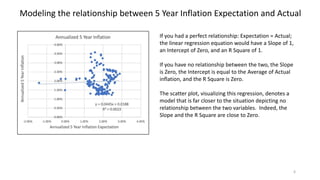
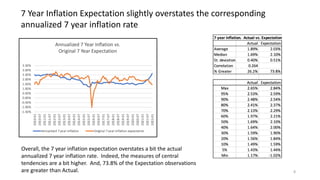

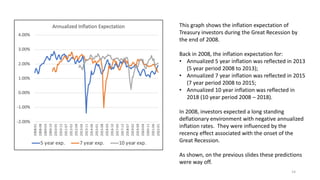
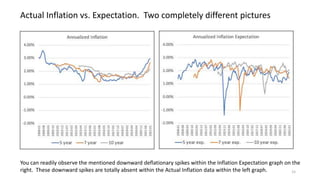
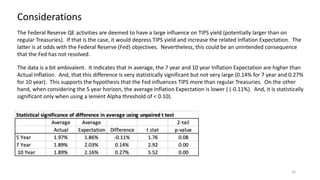

The document explores the predictive ability of Treasury Inflation Protected Securities (TIPS) concerning inflation expectations across 5, 7, and 10 year horizons, noting the limited correlation with actual inflation rates. It concludes that while TIPS expectations tend to slightly overstate future inflation, the linear regression models used to analyze these relationships generally indicate a weak relationship. Additionally, the influence of Federal Reserve activities on TIPS yields is discussed, suggesting significant but nuanced effects on inflation expectations.


