Downloaded 24 times
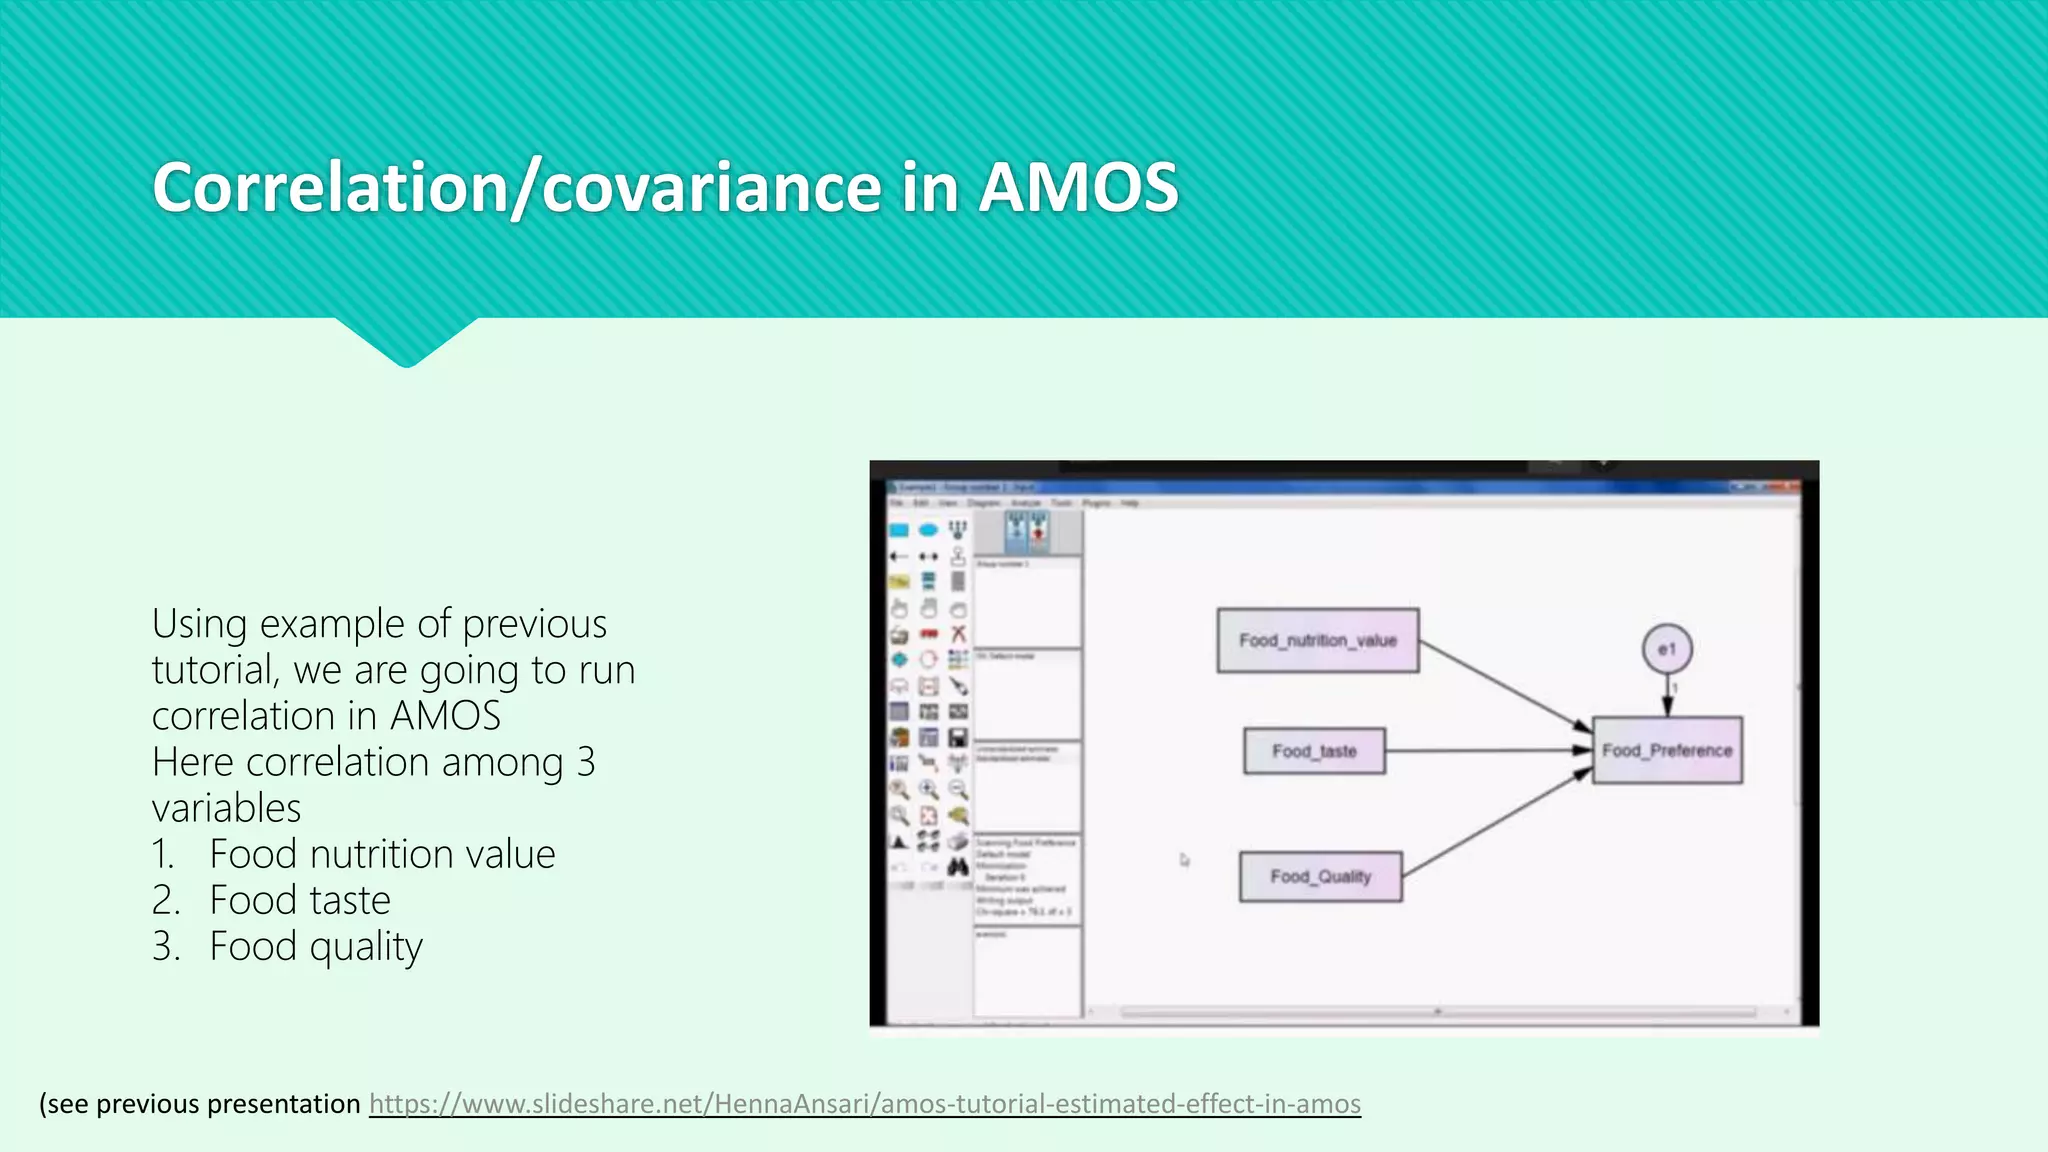
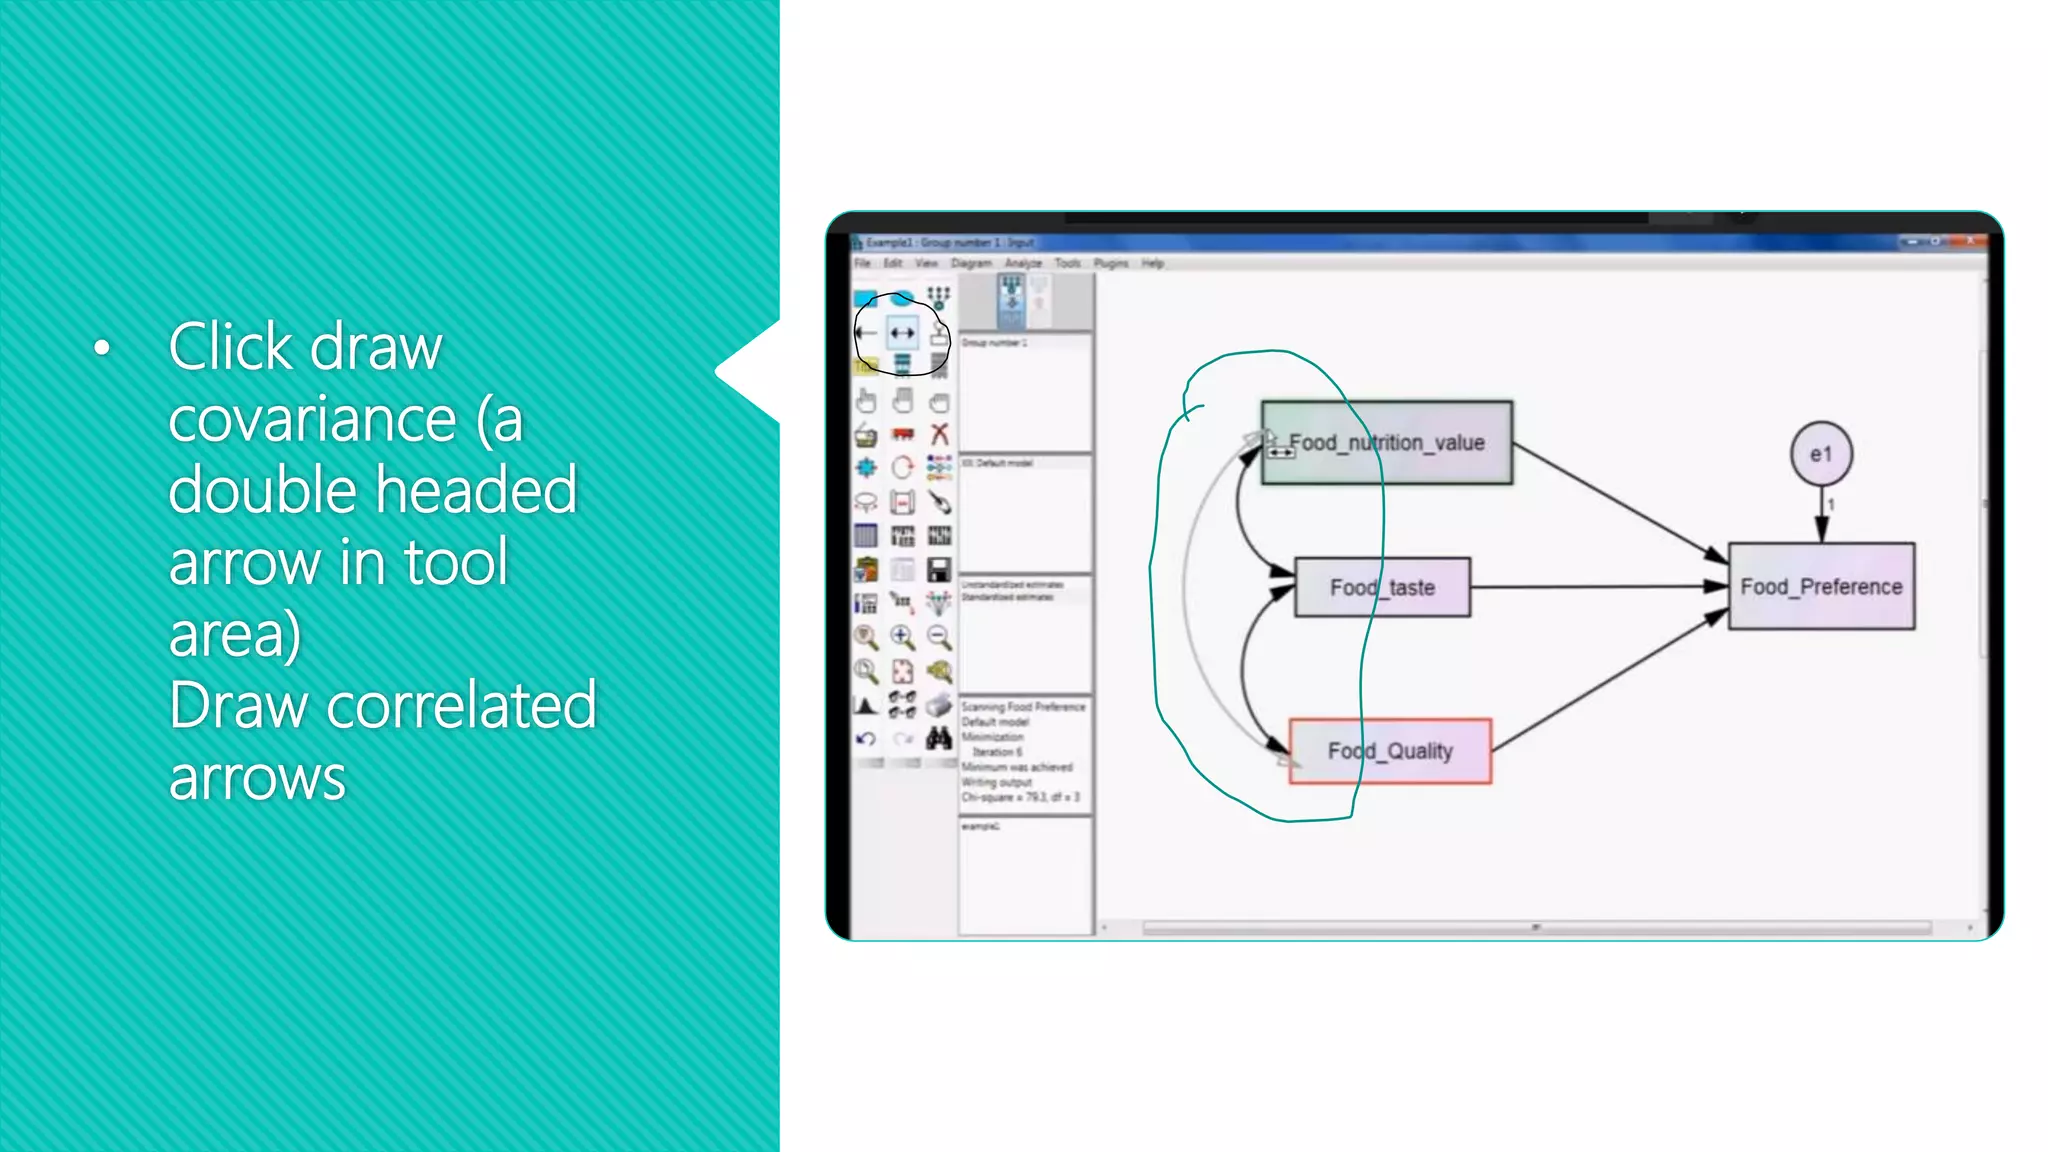
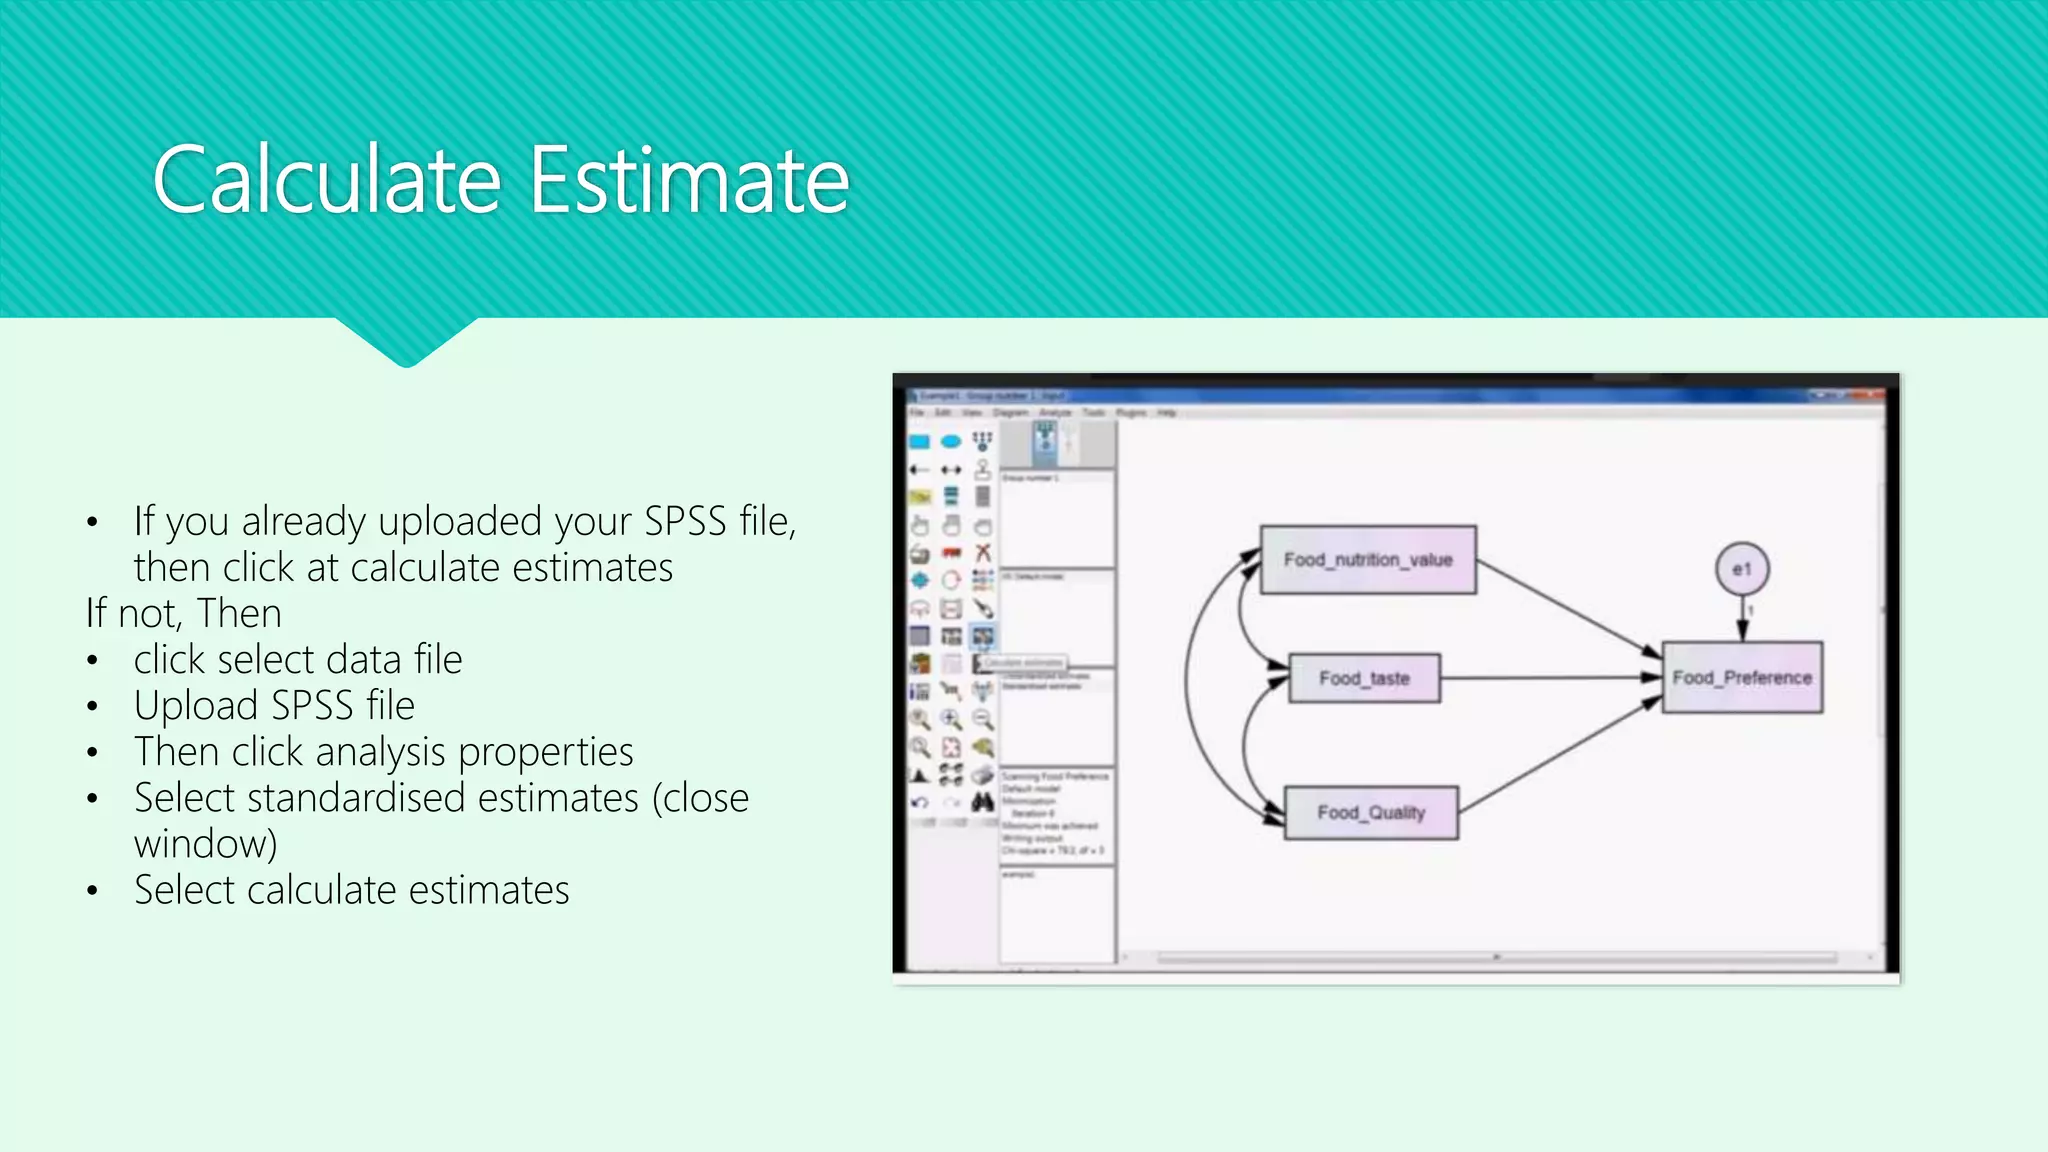
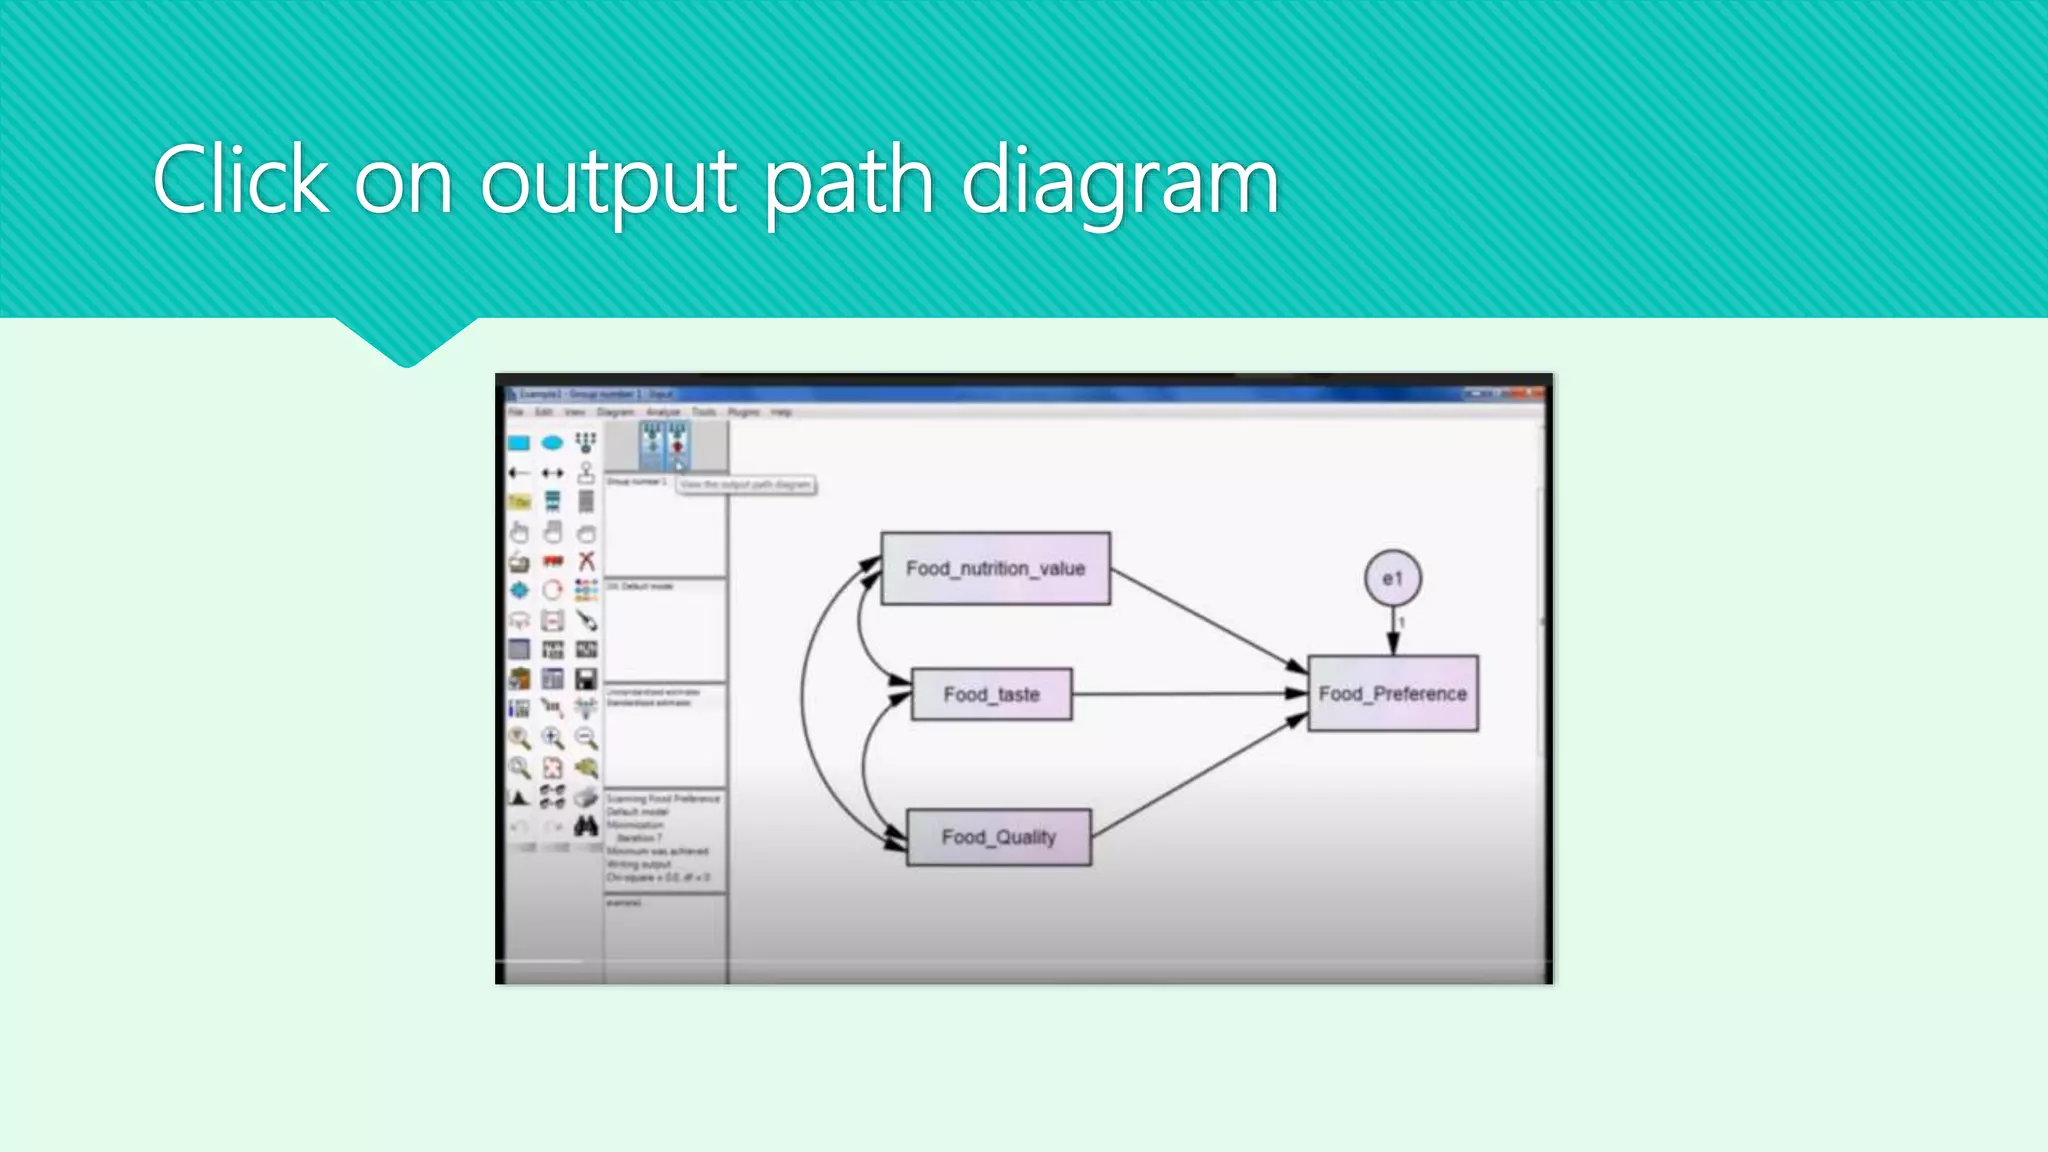
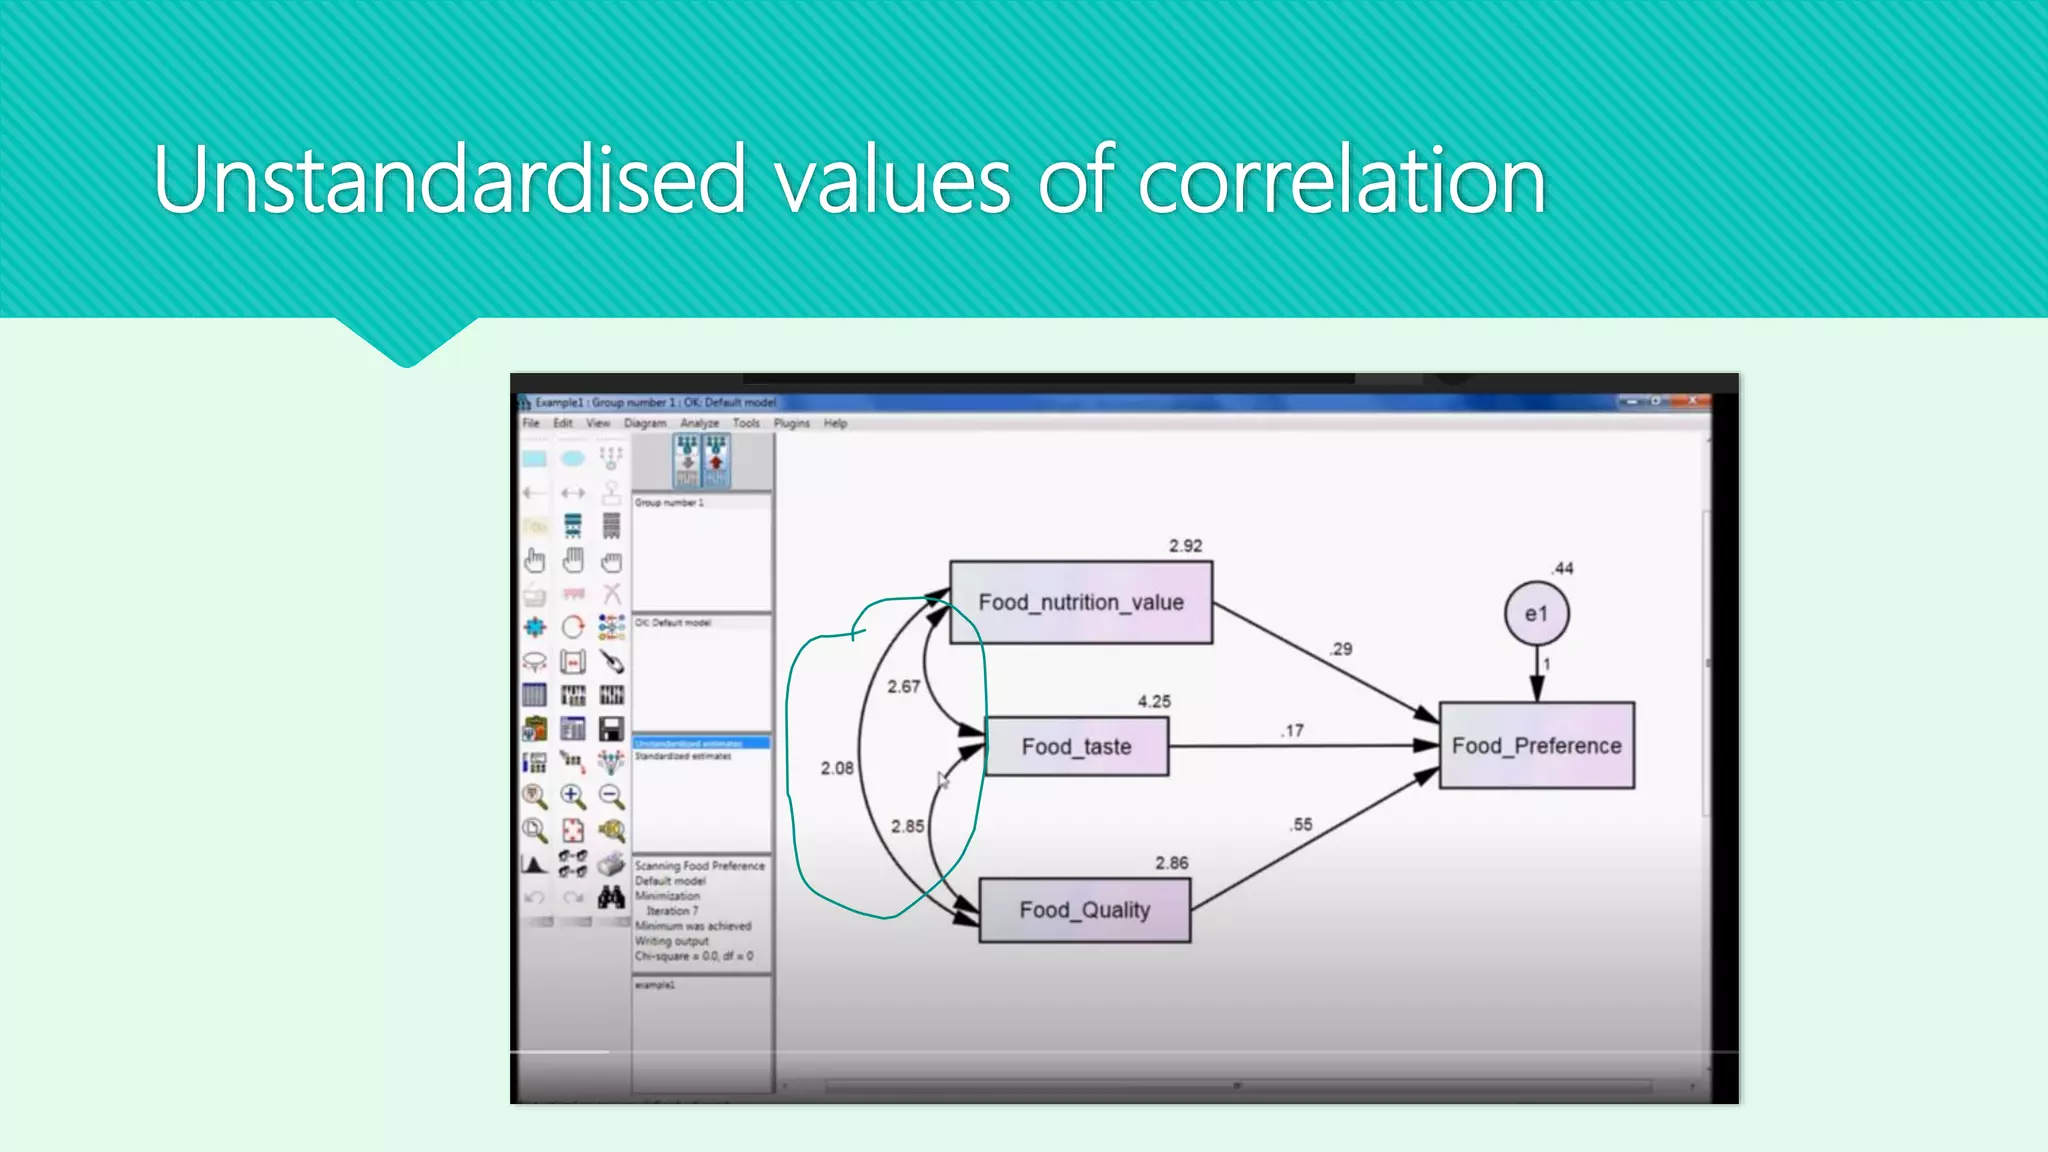
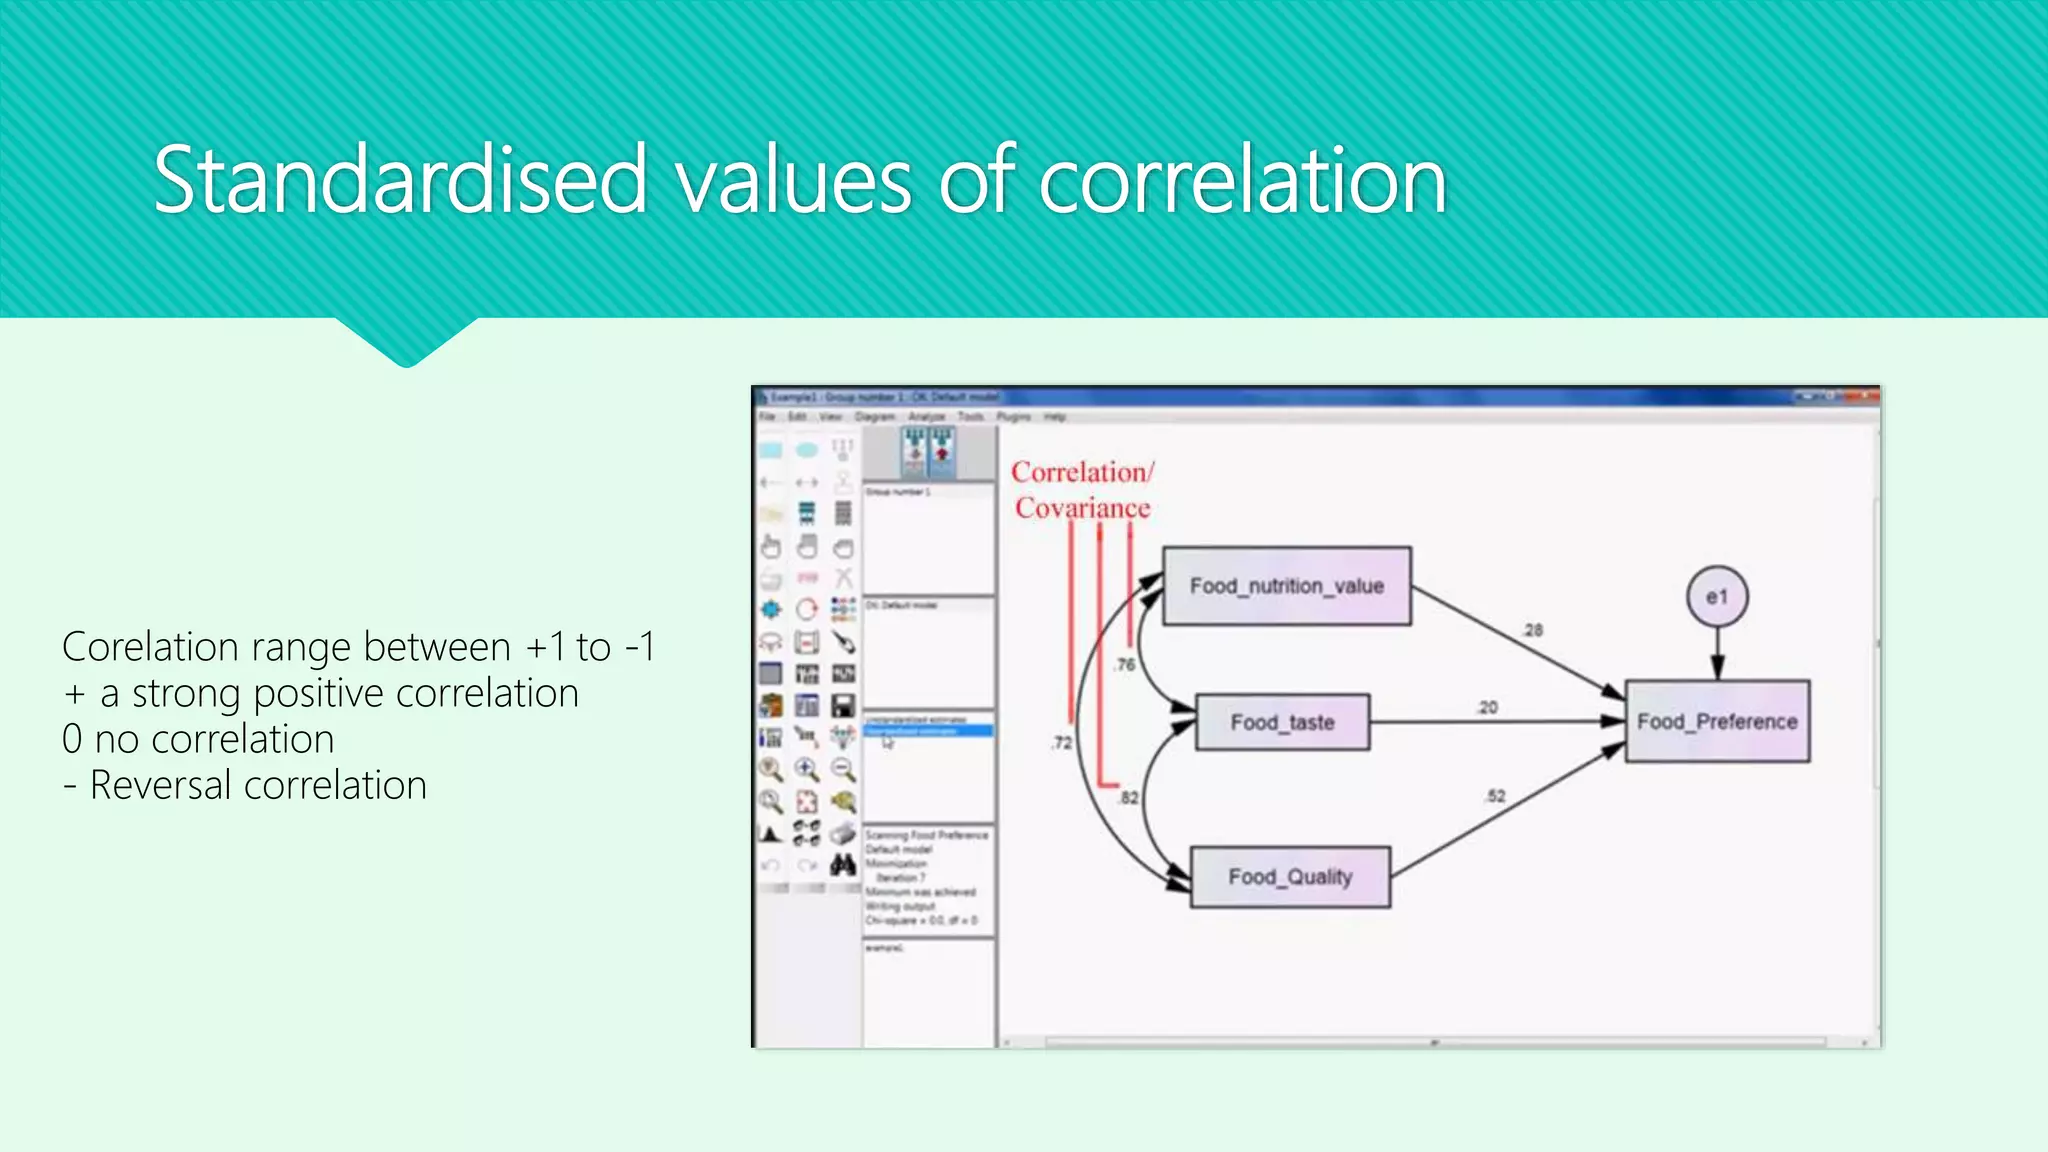


This document provides instructions for running a correlation analysis in AMOS using data on the nutrition, taste, and quality of foods. It explains how to draw covariance arrows between the three variables in AMOS, calculate estimates by uploading an SPSS data file, and view the unstandardized and standardized correlation values in the output path diagram. The correlation values can range from +1 for a strong positive correlation to -1 for a reversal correlation, with 0 indicating no correlation.