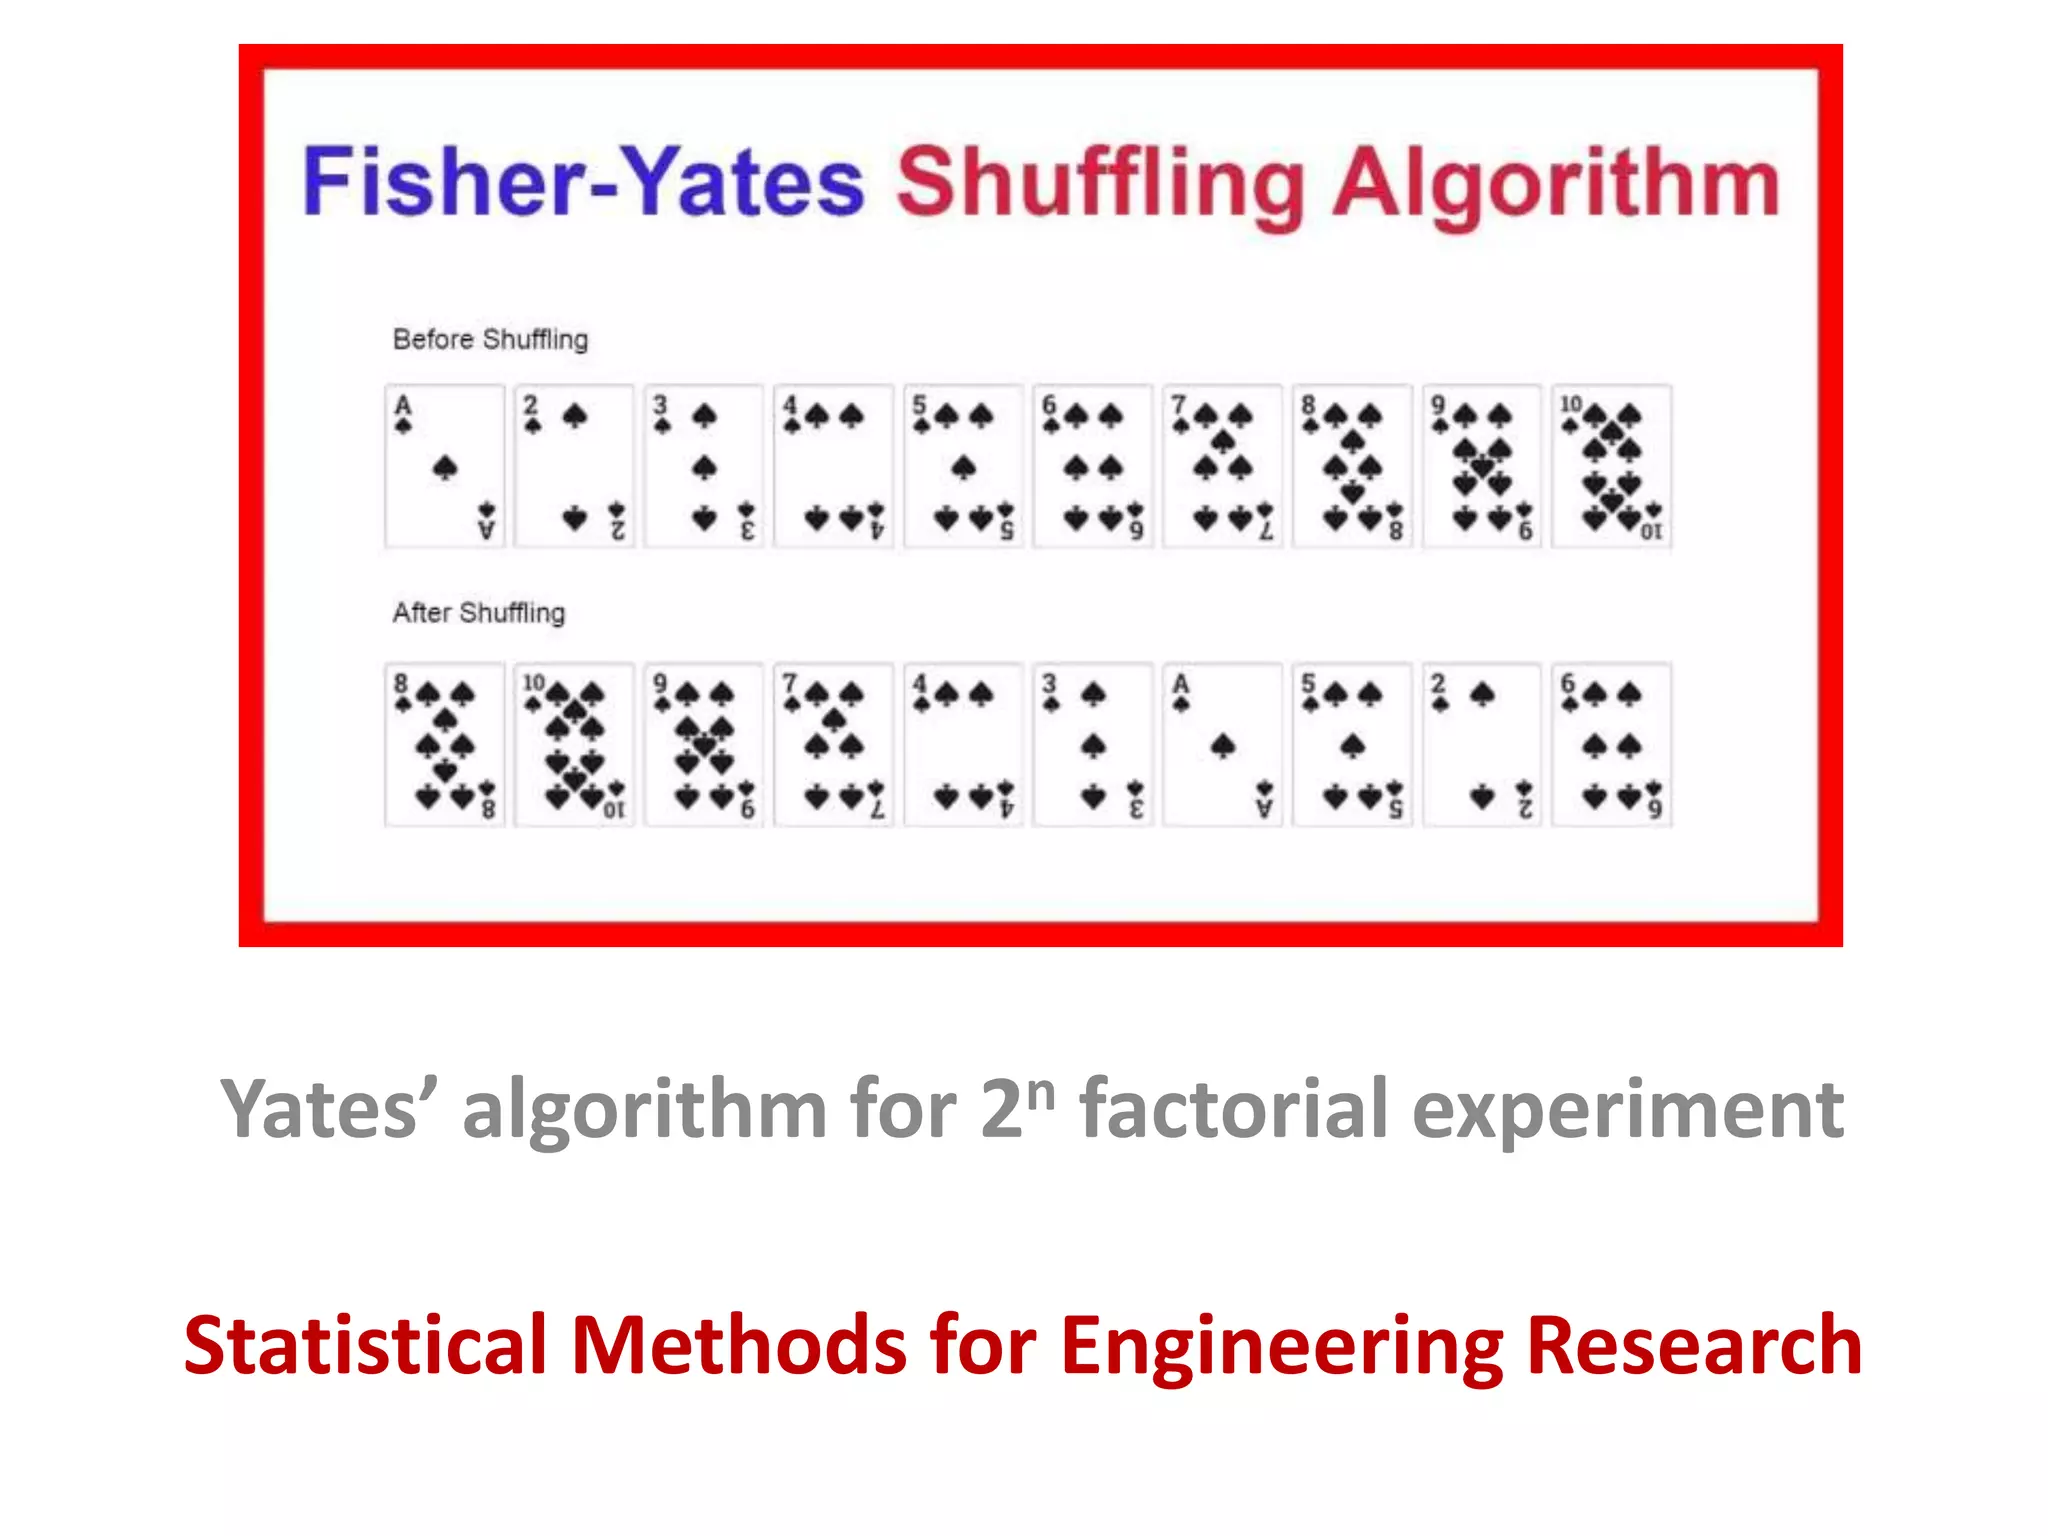
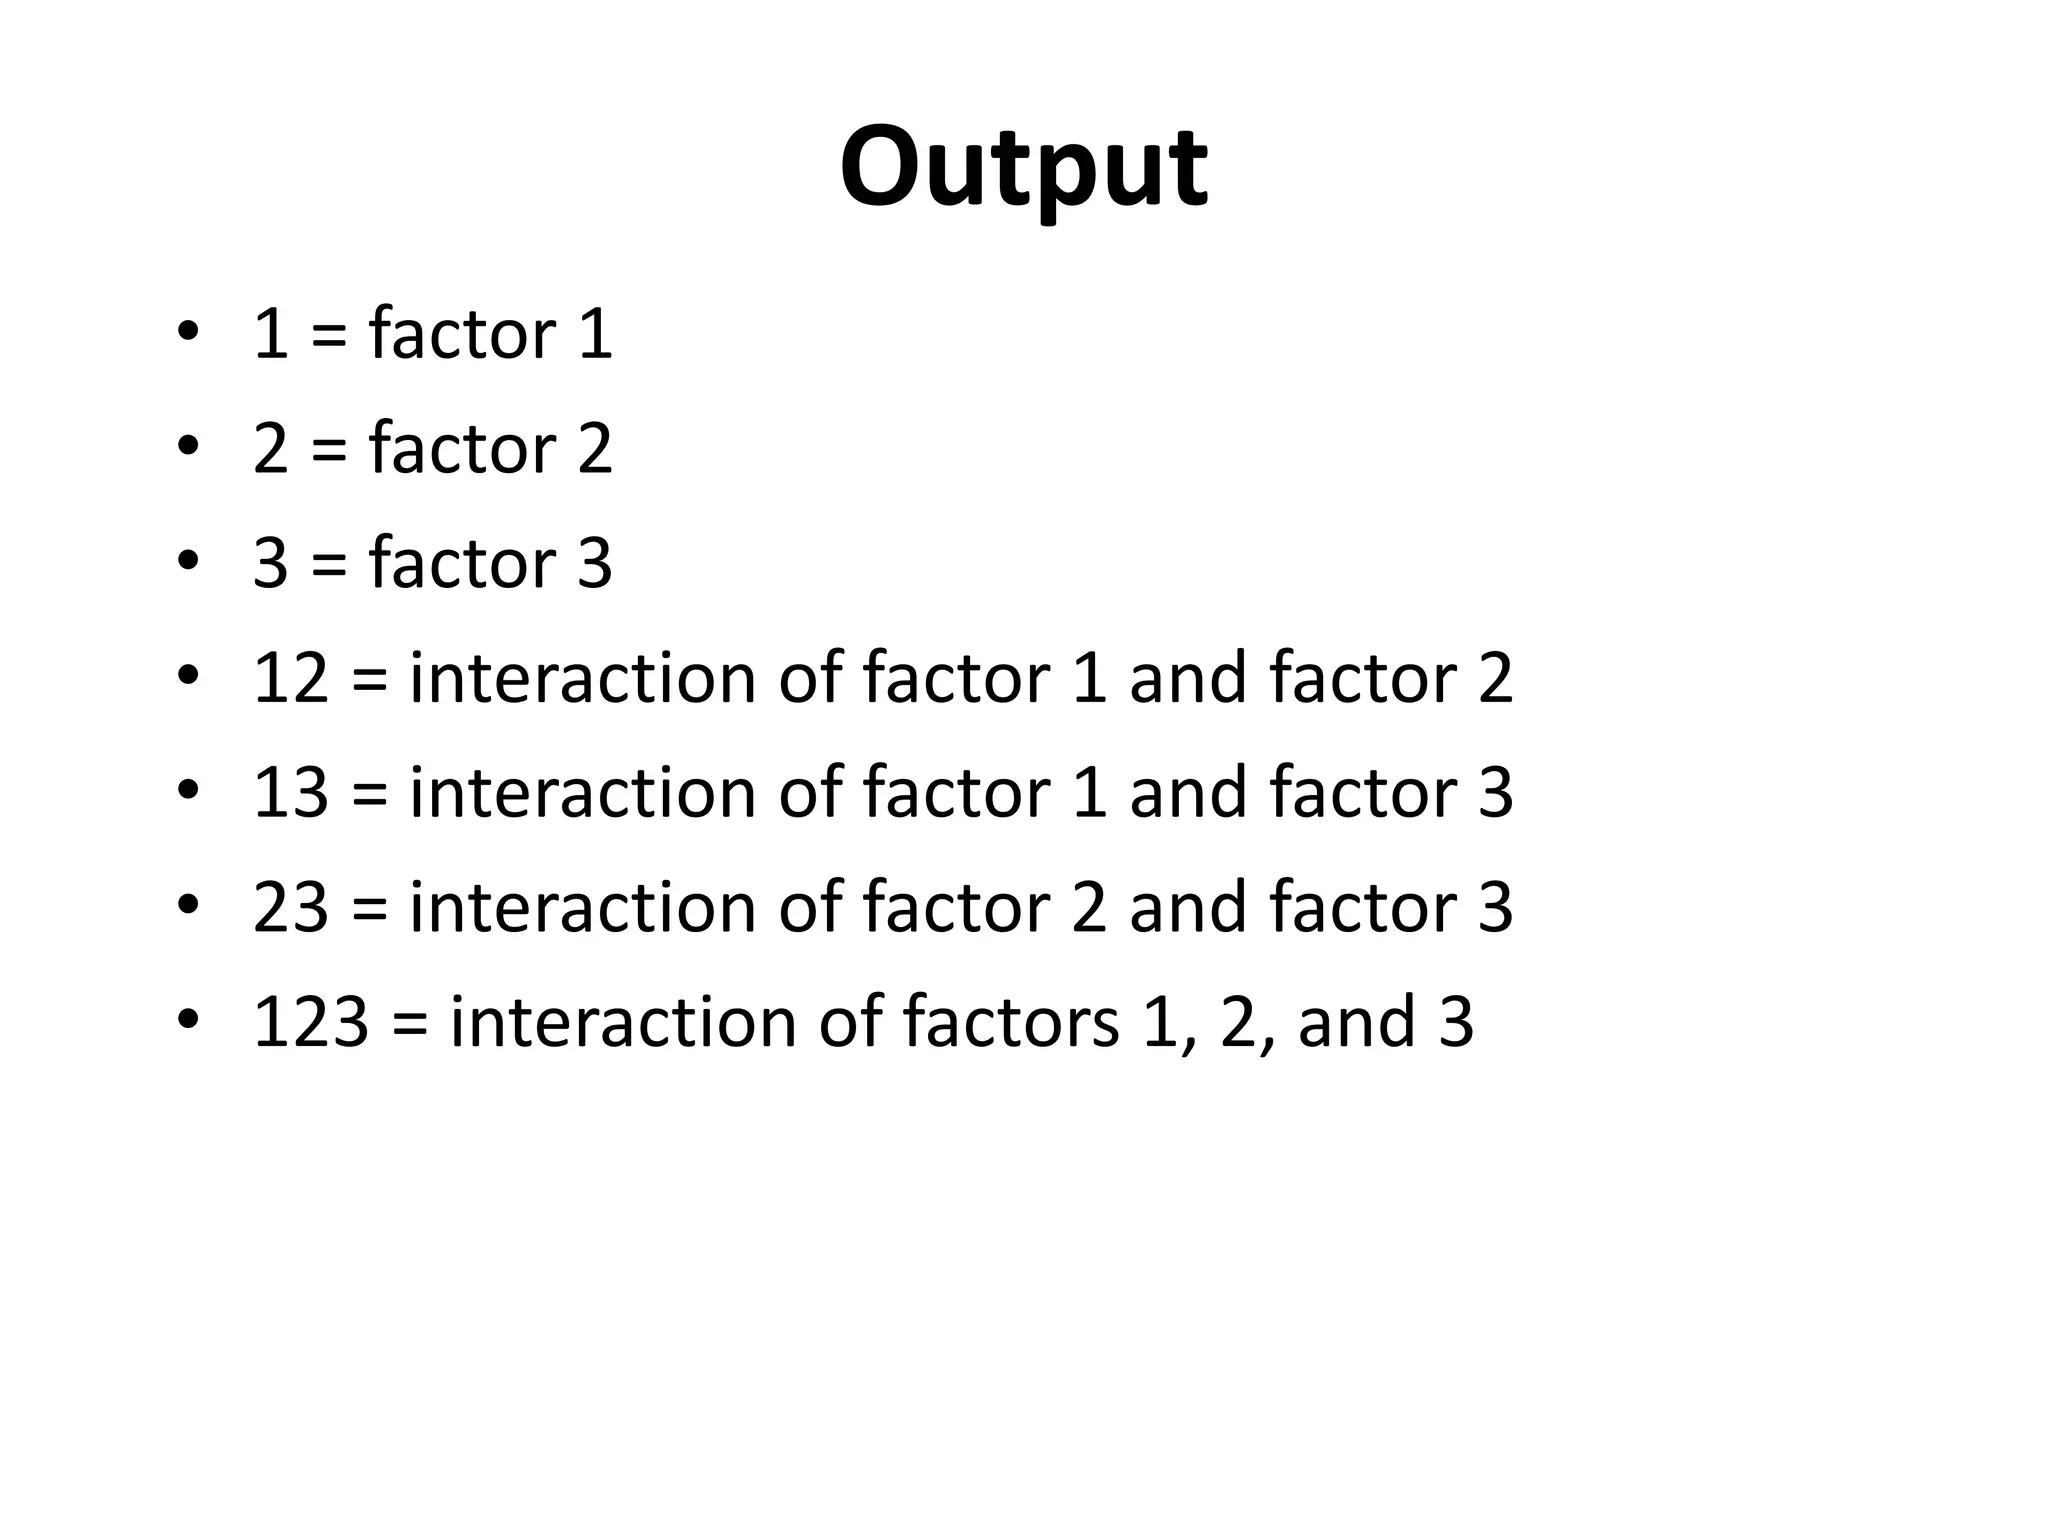
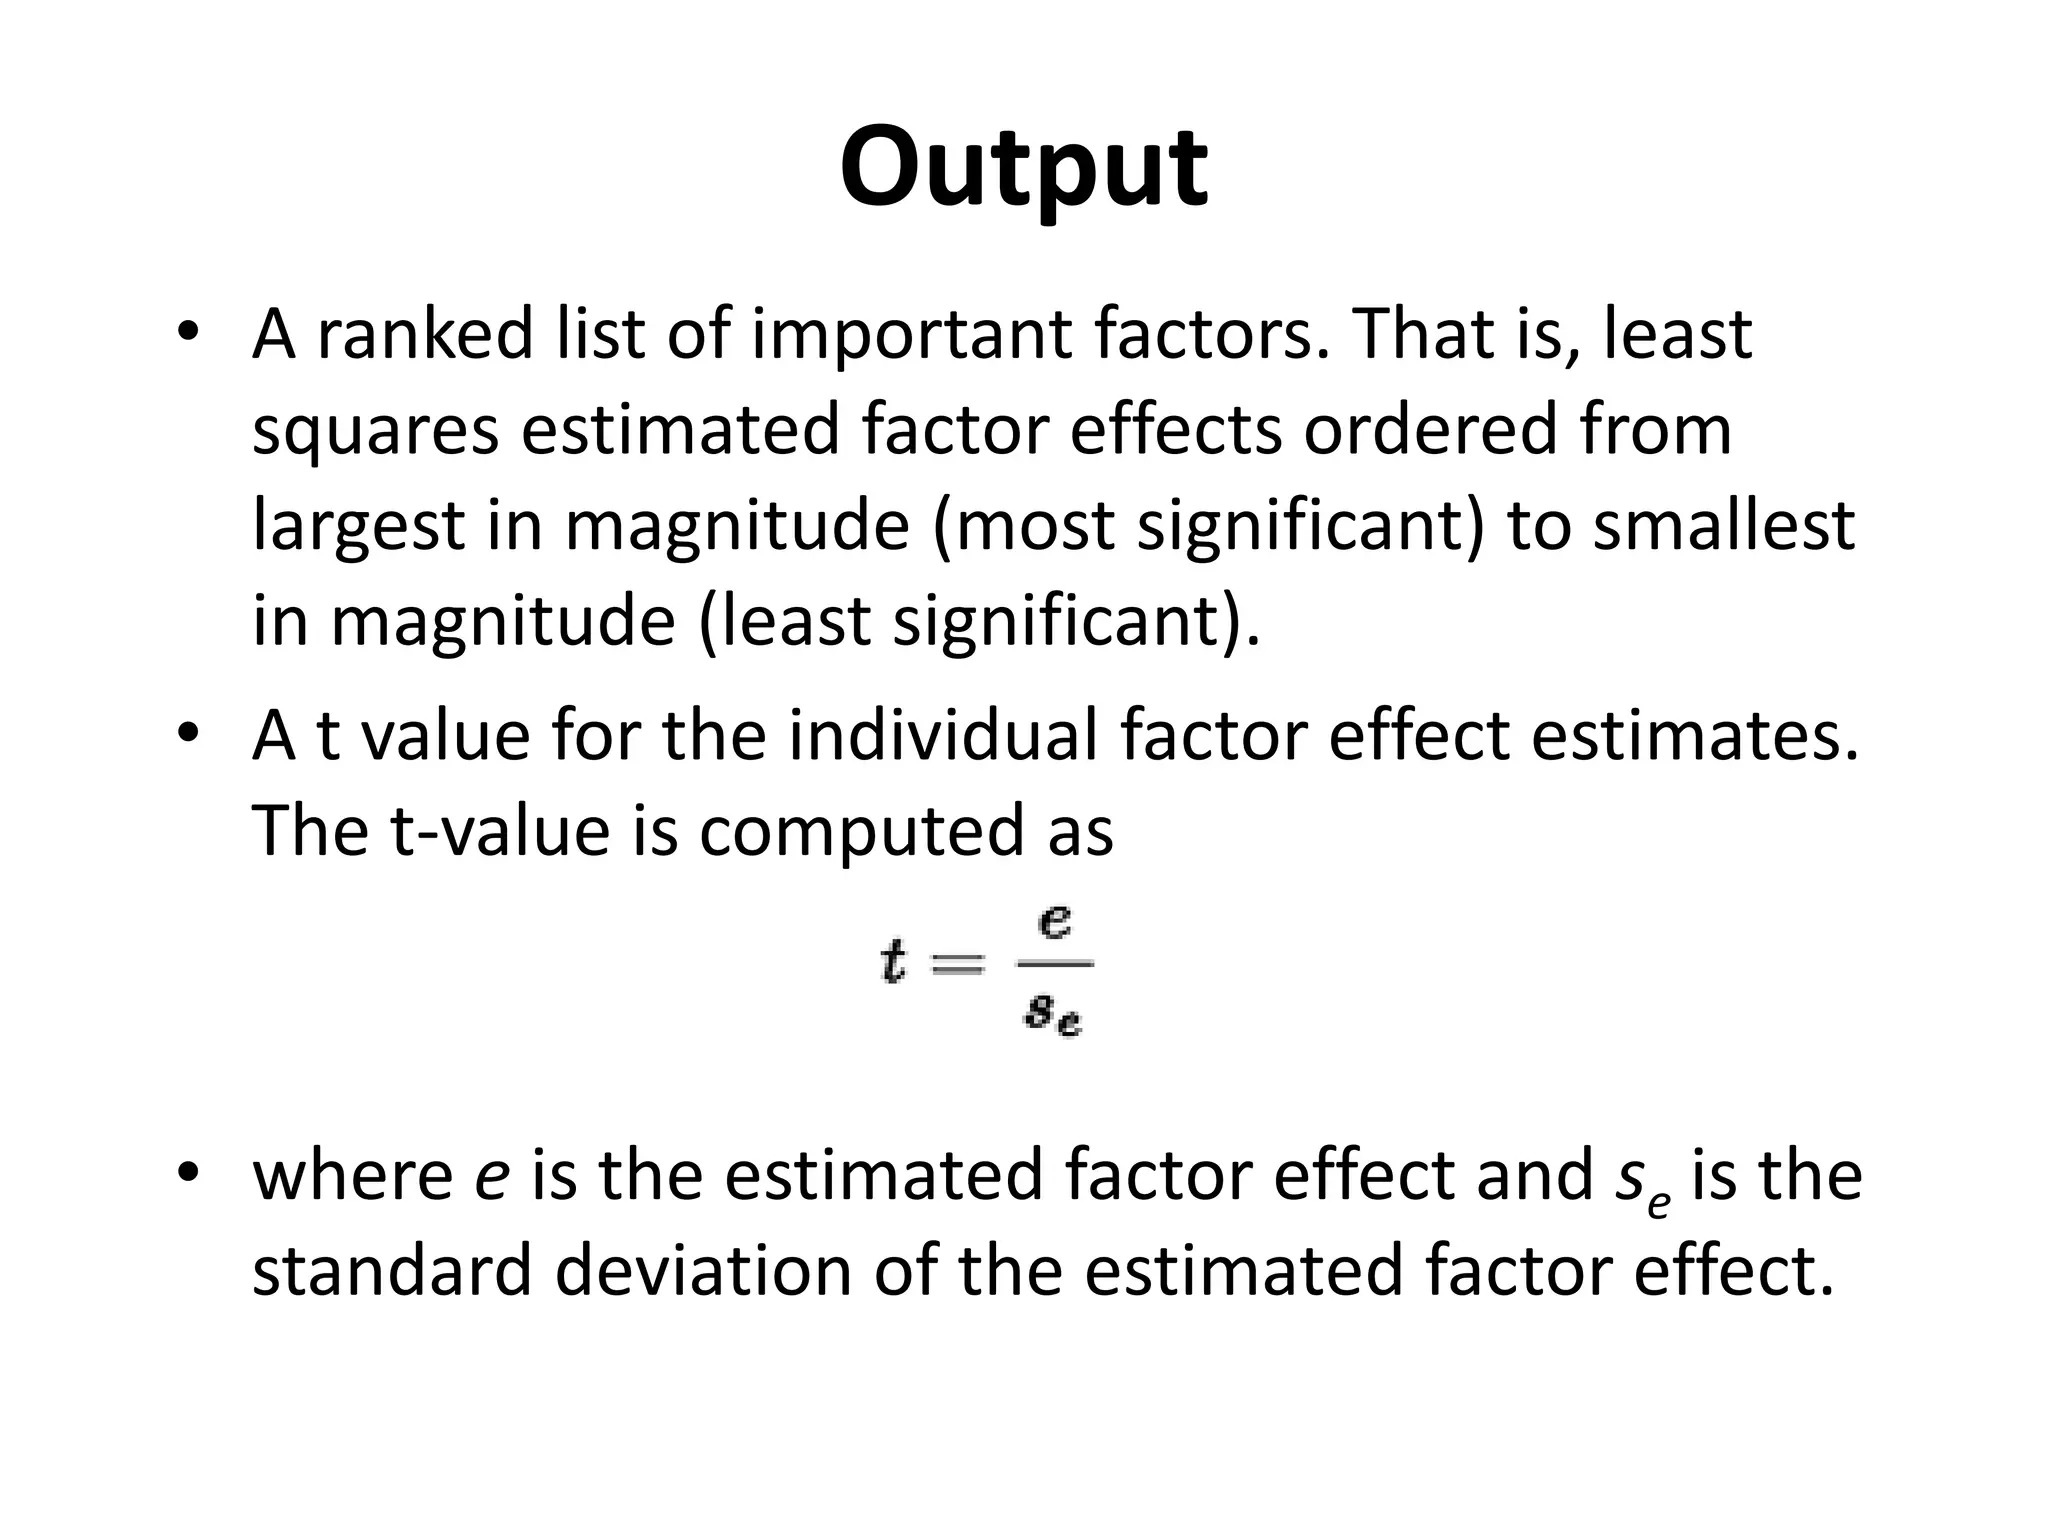
Statistical Methods for Engineering Research
Yates’ algorithm for 2n factorial experiment
Prepared By
Dr. Manu Melwin Joy
Assistant Professor
School of Management Studies
Cochin University of Science and Technology
Kerala, India.
Phone – 9744551114
Mail – manumelwinjoy@cusat.ac.in
Kindly restrict the use of slides for personal purpose.
Please seek permission to reproduce the same in public forms and
presentations.
Yates’ algorithm for 2n factorial
experiment
• In statistics, a Yates analysis is an approach to
analyzing data obtained from a designed experiment,
where a factorial design has been used.
• This algorithm was named after the English
statistician Frank Yates and is called Yates' algorithm.
Yates’ algorithm for 2n factorial
experiment
• In statistics, a Yates analysis is an approach to
analyzing data obtained from a designed experiment,
where a factorial design has been used.
• This algorithm was named after the English
statistician Frank Yates and is called Yates' algorithm.
Yates’ algorithm for 2n factorial
experiment
• Full- and fractional-factorial designs are common in
designed experiments for engineering and scientific
applications. In these designs, each factor is assigned
two levels. These are typically called the low and
high levels.
• For computational purposes, the factors are scaled
so that the low level is assigned a value of -1 and the
high level is assigned a value of +1. These are also
commonly referred to as "-" and "+".
Yates’ algorithm for 2n factorial
experiment
• A full factorial design contains all possible
combinations of low/high levels for all the factors. A
fractional factorial design contains a carefully chosen
subset of these combinations.
• Formalized by Frank Yates, a Yates analysis exploits
the special structure of these designs to generate
least squares estimates for factor effects for all
factors and all relevant interactions.
Yates’ algorithm for 2n factorial
experiment
• The Yates analysis can be used to answer the
following questions:
– What is the ranked list of factors?
– What is the goodness-of-fit (as measured by the residual
standard deviation) for the various models?
Yates Order
• Before performing a Yates analysis, the data should
be arranged in "Yates order". That is, given k factors,
the kth column consists of 2(k - 1) minus signs (i.e., the
low level of the factor) followed by 2(k - 1) plus signs
(i.e., the high level of the factor).
Yates Order
• For example, for a full factorial design with three
factors, the design matrix is
Output
• A Yates analysis generates the following output.
• A factor identifier (from Yates order). The specific
identifier will vary depending on the program
used to generate the Yates analysis. Dataplot for
example, uses the following for a 3-factor model.
Output
• 1 = factor 1
• 2 = factor 2
• 3 = factor 3
• 12 = interaction of factor 1 and factor 2
• 13 = interaction of factor 1 and factor 3
• 23 = interaction of factor 2 and factor 3
• 123 = interaction of factors 1, 2, and 3
Output
• A ranked list of important factors. That is, least
squares estimated factor effects ordered from
largest in magnitude (most significant) to smallest
in magnitude (least significant).
• A t value for the individual factor effect estimates.
The t-value is computed as
• where e is the estimated factor effect and se is the
standard deviation of the estimated factor effect.
Yates’ algorithm for 2n factorial experiment - Dr. Manu Melwin Joy - School of Management Studies, Cochin University of Science and Technology

Yates’ algorithm for 2n factorial experiment - Dr. Manu Melwin Joy - School of Management Studies, Cochin University of Science and Technology

  • 1.
    Statistical Methods forEngineering Research Yates’ algorithm for 2n factorial experiment
  • 2.
    Prepared By Dr. ManuMelwin Joy Assistant Professor School of Management Studies Cochin University of Science and Technology Kerala, India. Phone – 9744551114 Mail – manumelwinjoy@cusat.ac.in Kindly restrict the use of slides for personal purpose. Please seek permission to reproduce the same in public forms and presentations.
  • 3.
    Yates’ algorithm for2n factorial experiment • In statistics, a Yates analysis is an approach to analyzing data obtained from a designed experiment, where a factorial design has been used. • This algorithm was named after the English statistician Frank Yates and is called Yates' algorithm.
  • 4.
    Yates’ algorithm for2n factorial experiment • In statistics, a Yates analysis is an approach to analyzing data obtained from a designed experiment, where a factorial design has been used. • This algorithm was named after the English statistician Frank Yates and is called Yates' algorithm.
  • 5.
    Yates’ algorithm for2n factorial experiment • Full- and fractional-factorial designs are common in designed experiments for engineering and scientific applications. In these designs, each factor is assigned two levels. These are typically called the low and high levels. • For computational purposes, the factors are scaled so that the low level is assigned a value of -1 and the high level is assigned a value of +1. These are also commonly referred to as "-" and "+".
  • 6.
    Yates’ algorithm for2n factorial experiment • A full factorial design contains all possible combinations of low/high levels for all the factors. A fractional factorial design contains a carefully chosen subset of these combinations. • Formalized by Frank Yates, a Yates analysis exploits the special structure of these designs to generate least squares estimates for factor effects for all factors and all relevant interactions.
  • 7.
    Yates’ algorithm for2n factorial experiment • The Yates analysis can be used to answer the following questions: – What is the ranked list of factors? – What is the goodness-of-fit (as measured by the residual standard deviation) for the various models?
  • 8.
    Yates Order • Beforeperforming a Yates analysis, the data should be arranged in "Yates order". That is, given k factors, the kth column consists of 2(k - 1) minus signs (i.e., the low level of the factor) followed by 2(k - 1) plus signs (i.e., the high level of the factor).
  • 9.
    Yates Order • Forexample, for a full factorial design with three factors, the design matrix is
  • 10.
    Output • A Yatesanalysis generates the following output. • A factor identifier (from Yates order). The specific identifier will vary depending on the program used to generate the Yates analysis. Dataplot for example, uses the following for a 3-factor model.
  • 11.
    Output • 1 =factor 1 • 2 = factor 2 • 3 = factor 3 • 12 = interaction of factor 1 and factor 2 • 13 = interaction of factor 1 and factor 3 • 23 = interaction of factor 2 and factor 3 • 123 = interaction of factors 1, 2, and 3
  • 12.
    Output • A rankedlist of important factors. That is, least squares estimated factor effects ordered from largest in magnitude (most significant) to smallest in magnitude (least significant). • A t value for the individual factor effect estimates. The t-value is computed as • where e is the estimated factor effect and se is the standard deviation of the estimated factor effect.