This document introduces 7 advanced quality tools: affinity diagrams, interrelationship diagrams, tree diagrams, matrix diagrams, matrix data analysis, process decision program charts, and arrow diagrams. It provides examples and step-by-step instructions for how to use each tool to organize ideas, identify relationships, plan processes, analyze data, and schedule projects. The tools can be used individually or together to improve quality, eliminate errors, effectively plan and prioritize tasks, and get things right the first time.
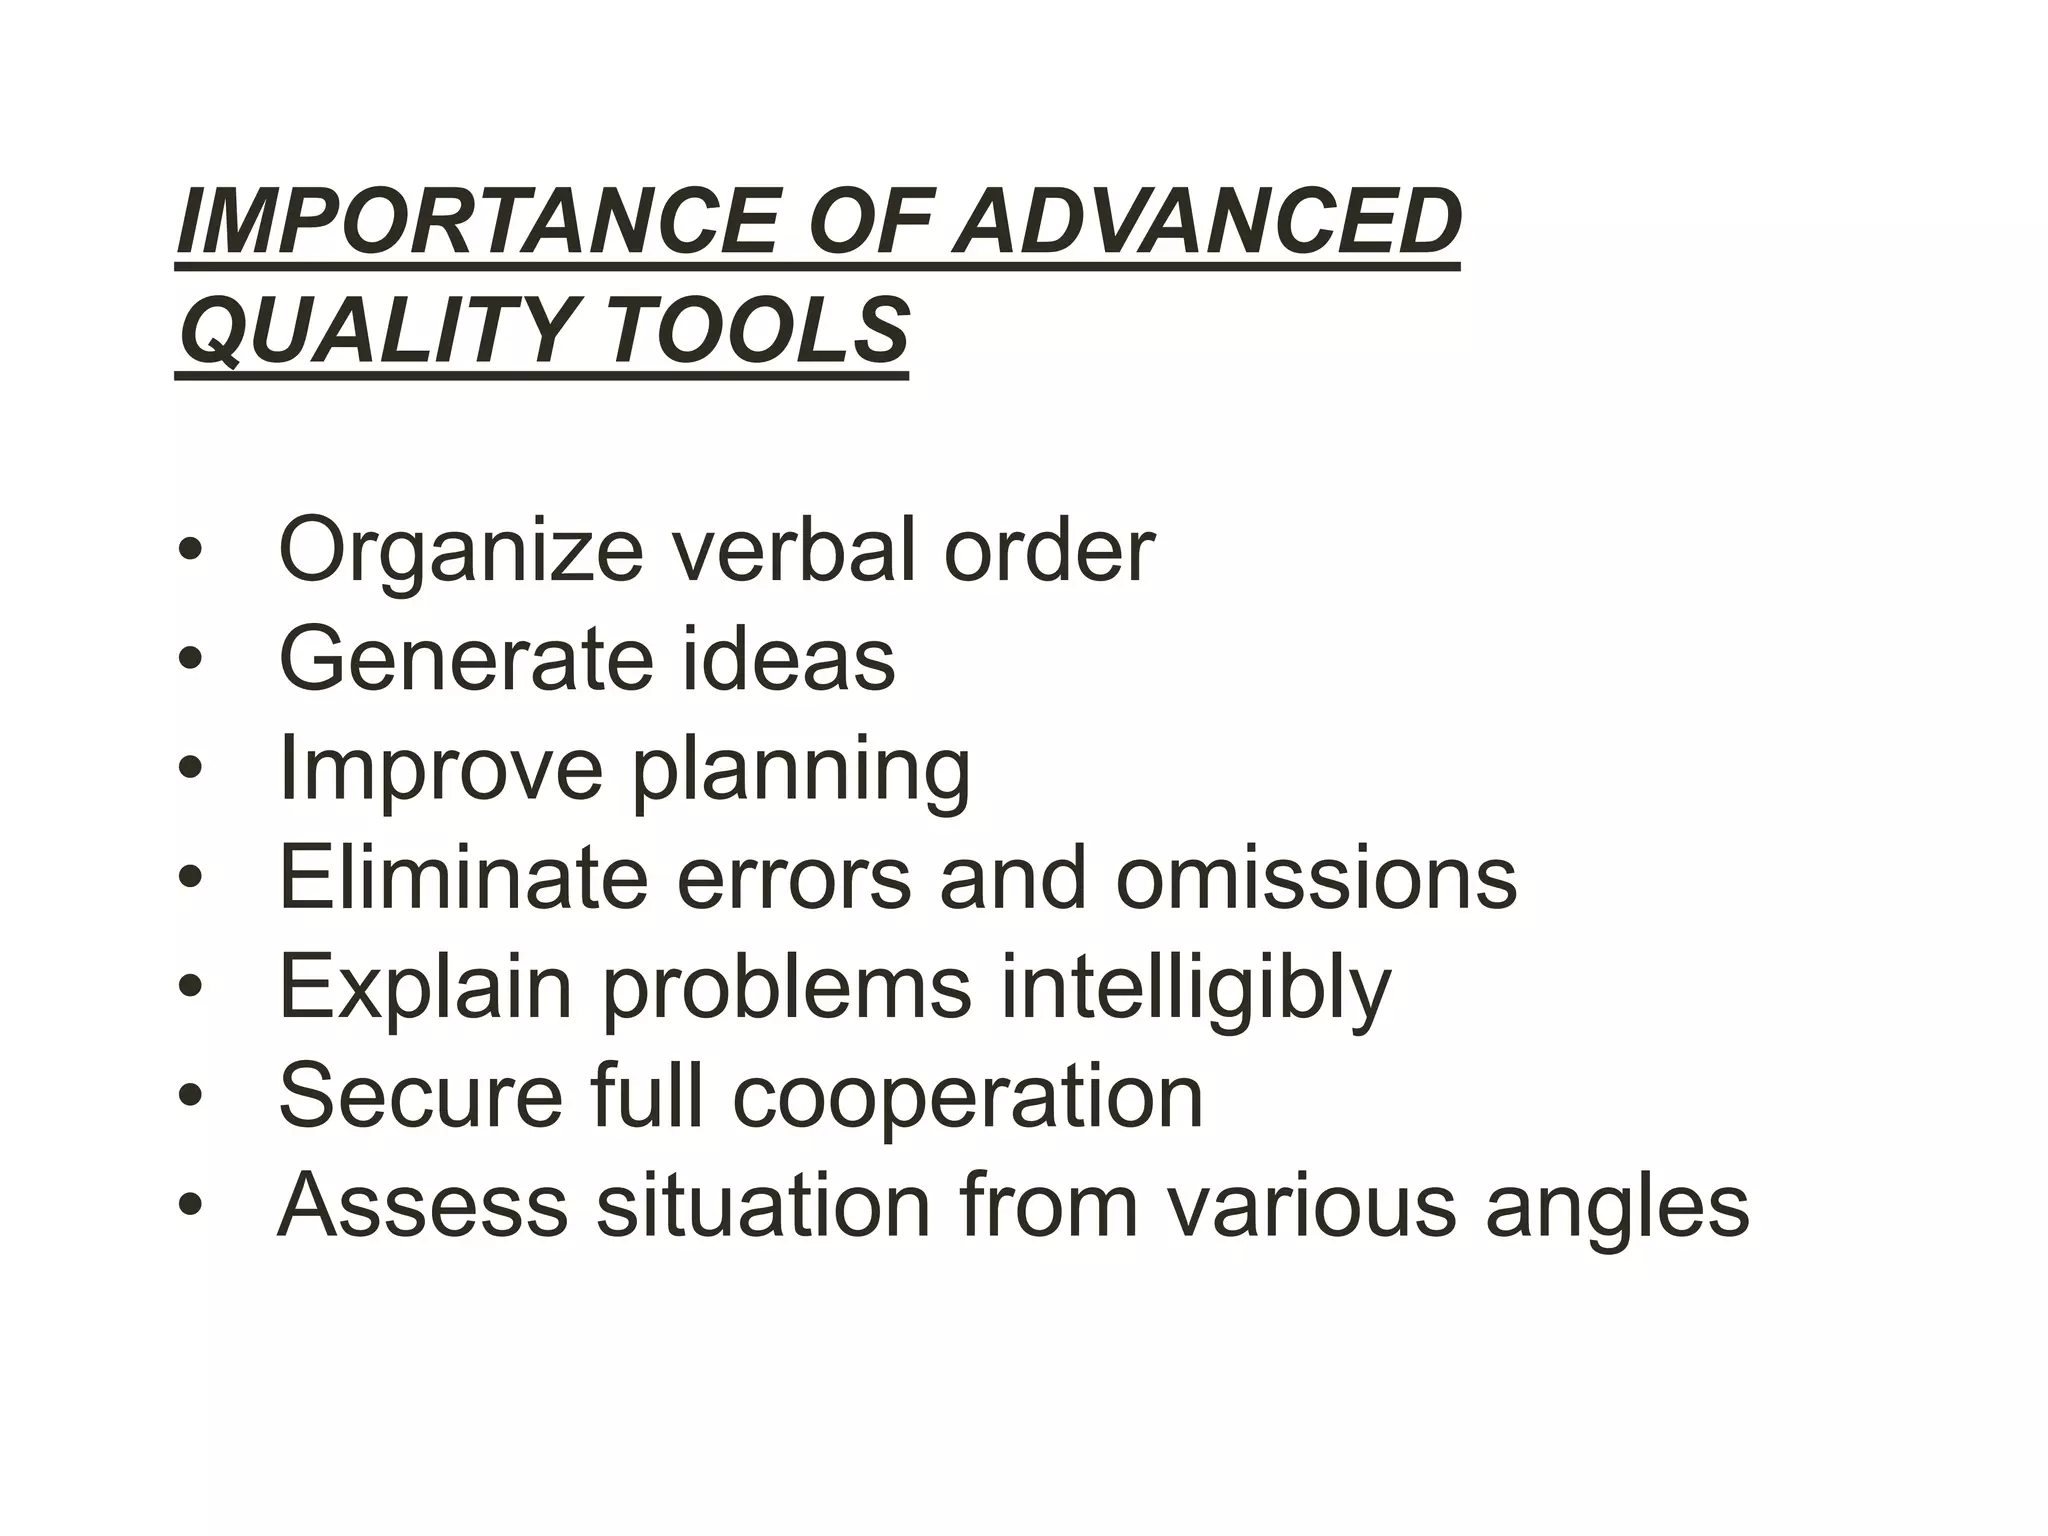
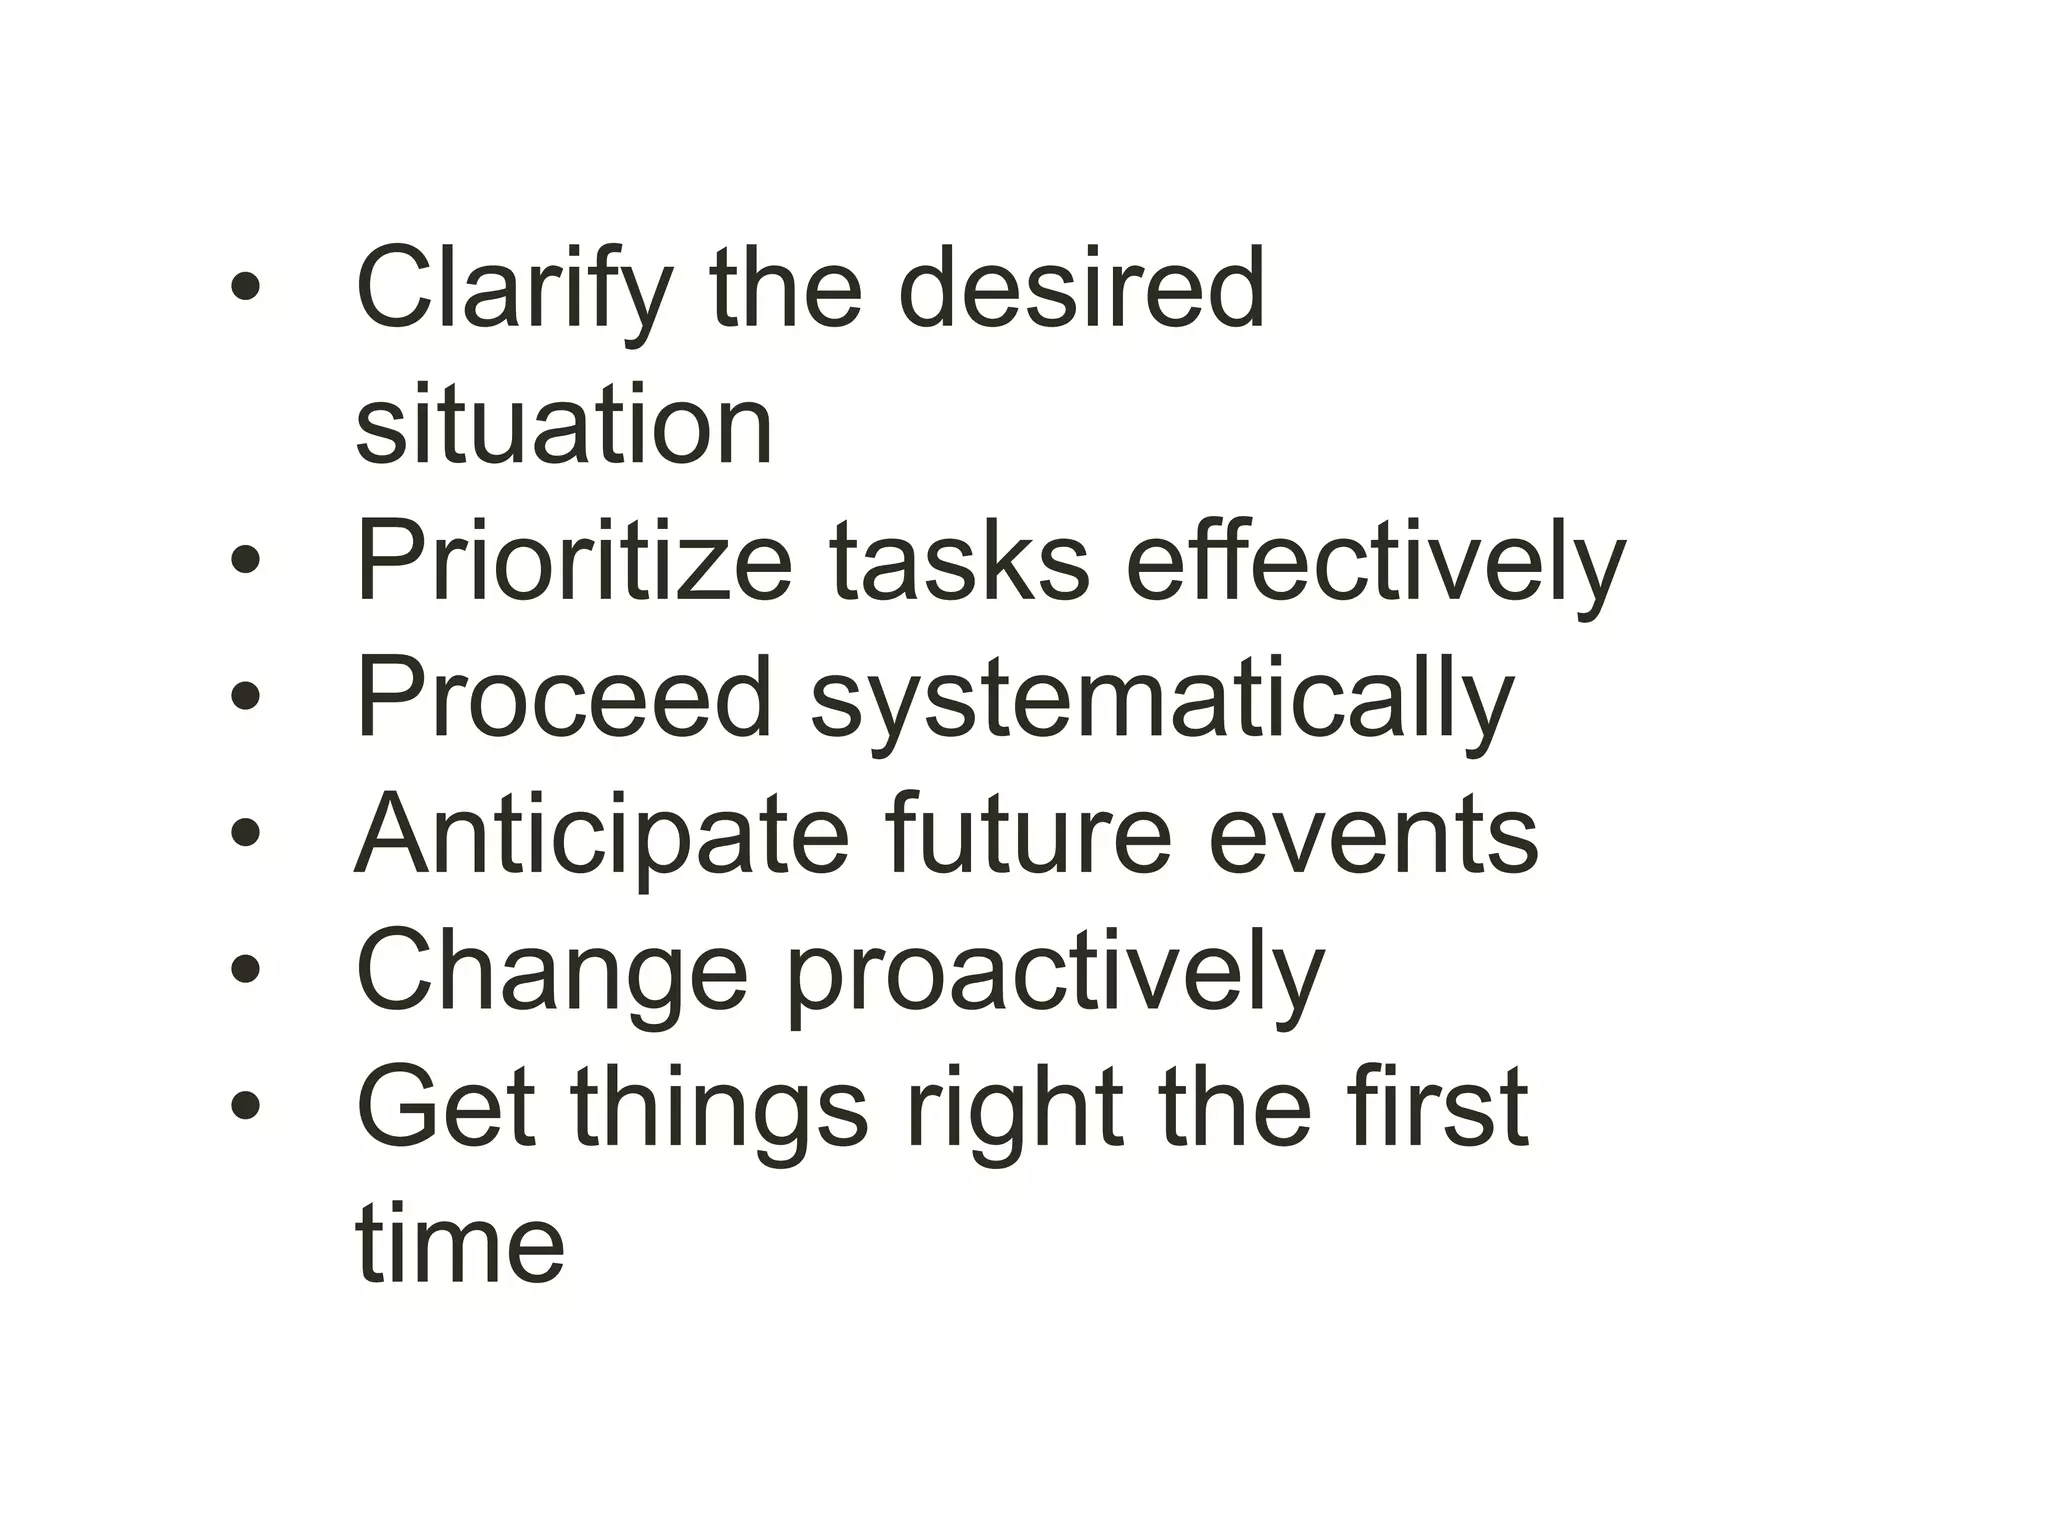
Introduction to advanced quality tools and their importance in organizing ideas, planning, and improving processes.
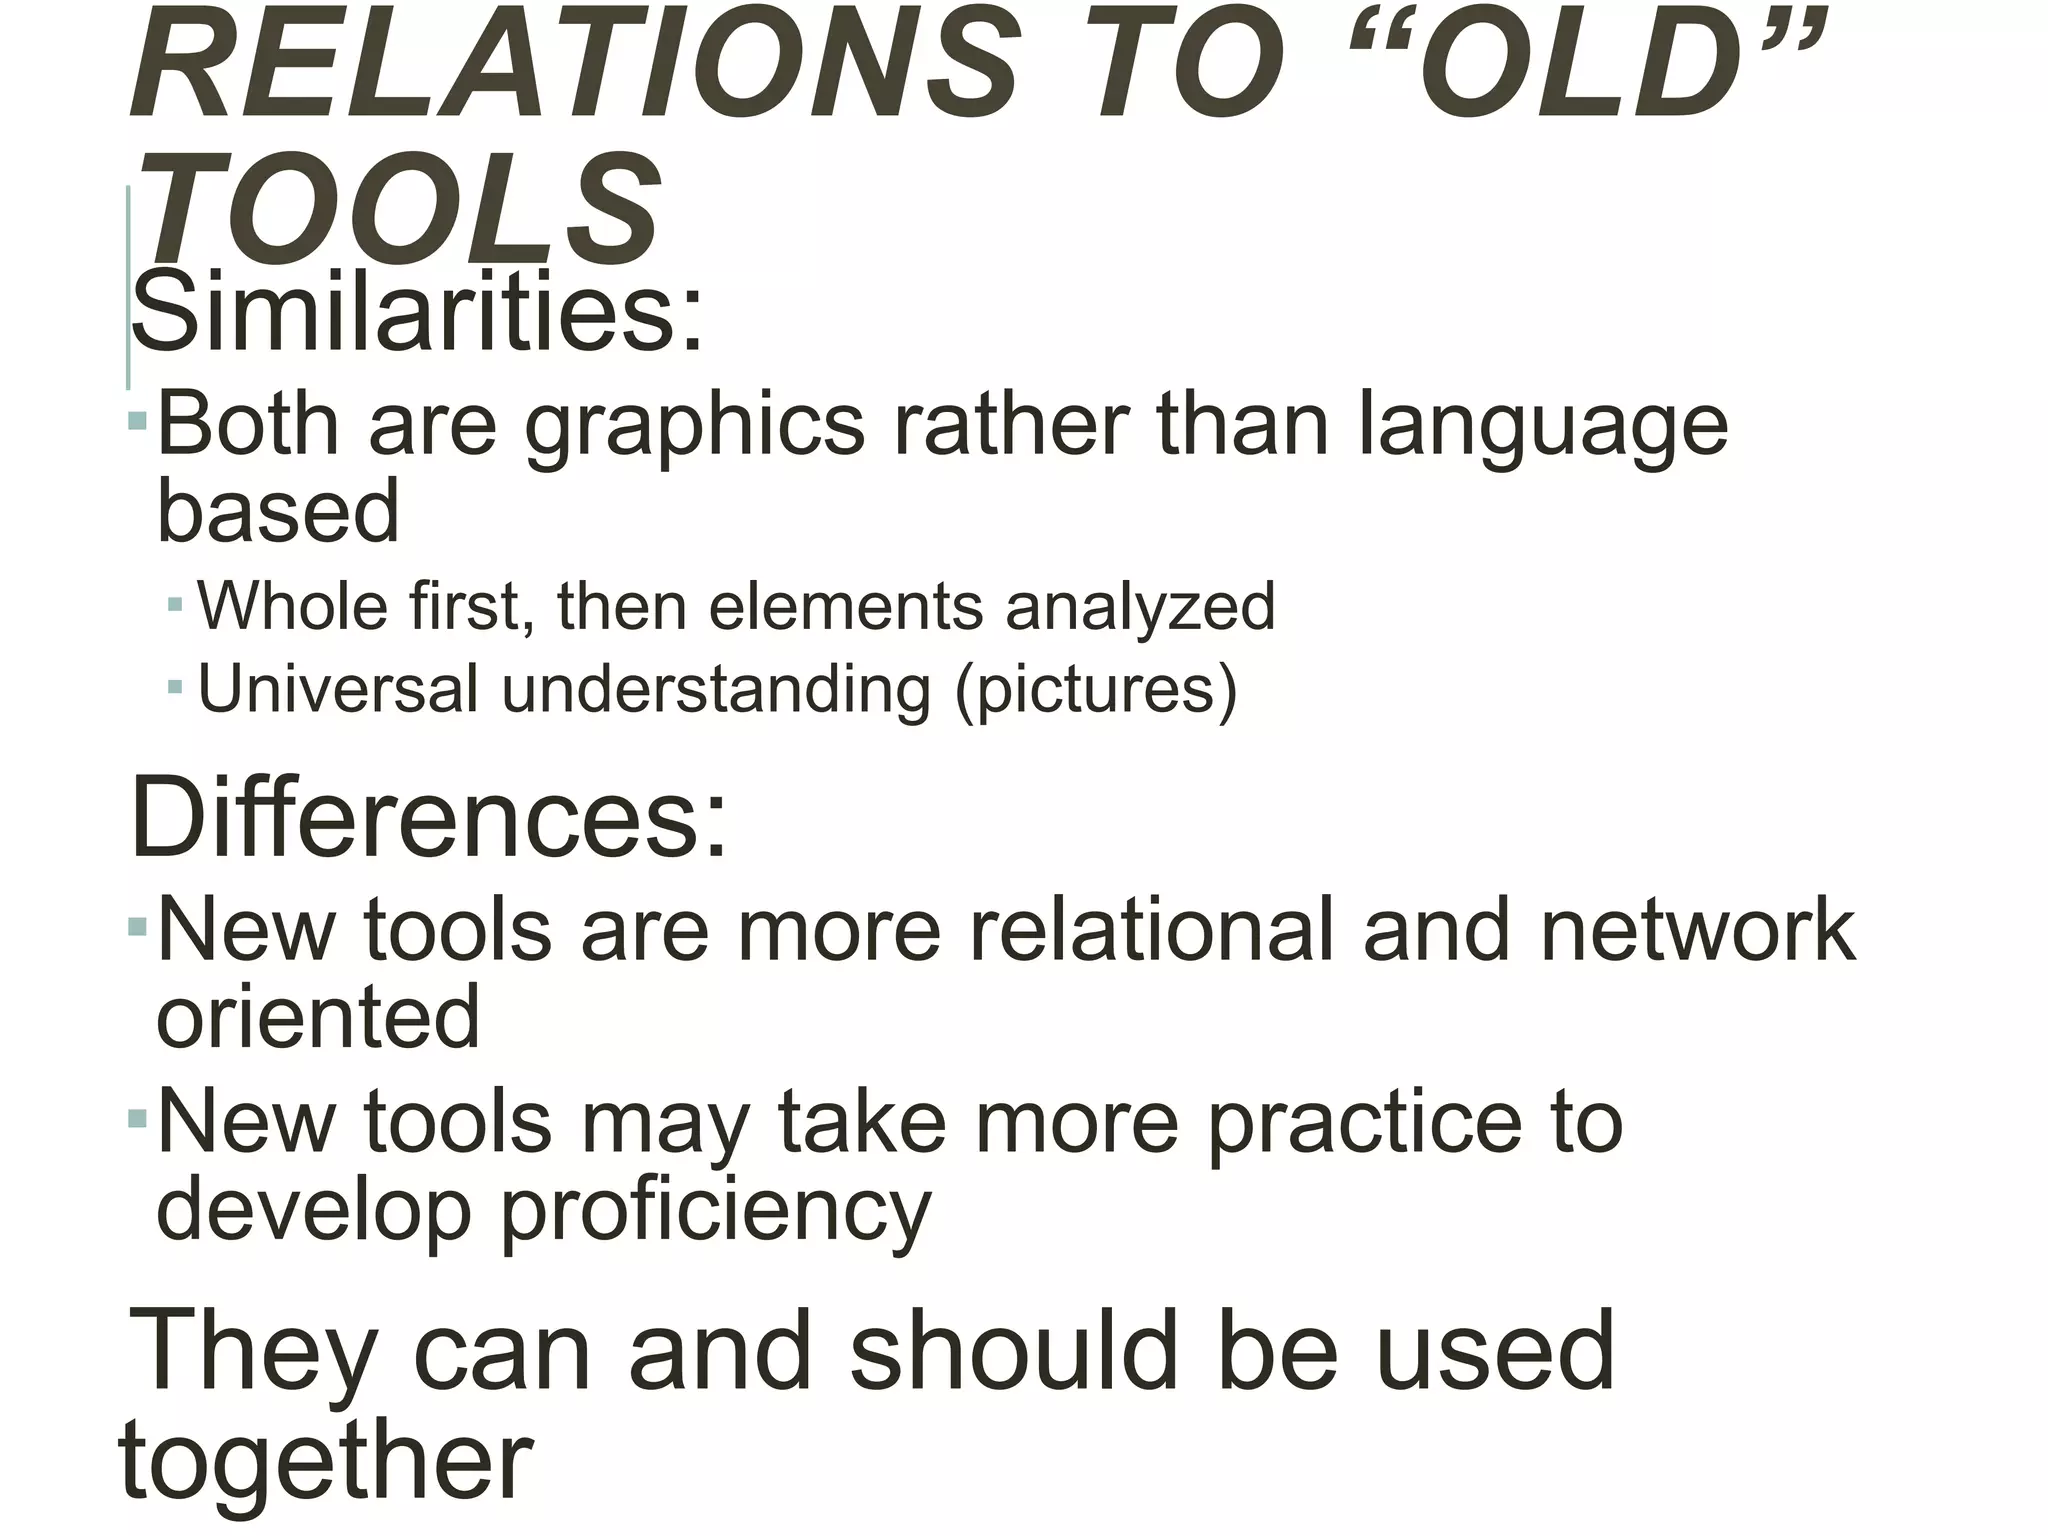
Comparison between old quality tools and new ones highlighting similarities, differences, and joint usage.
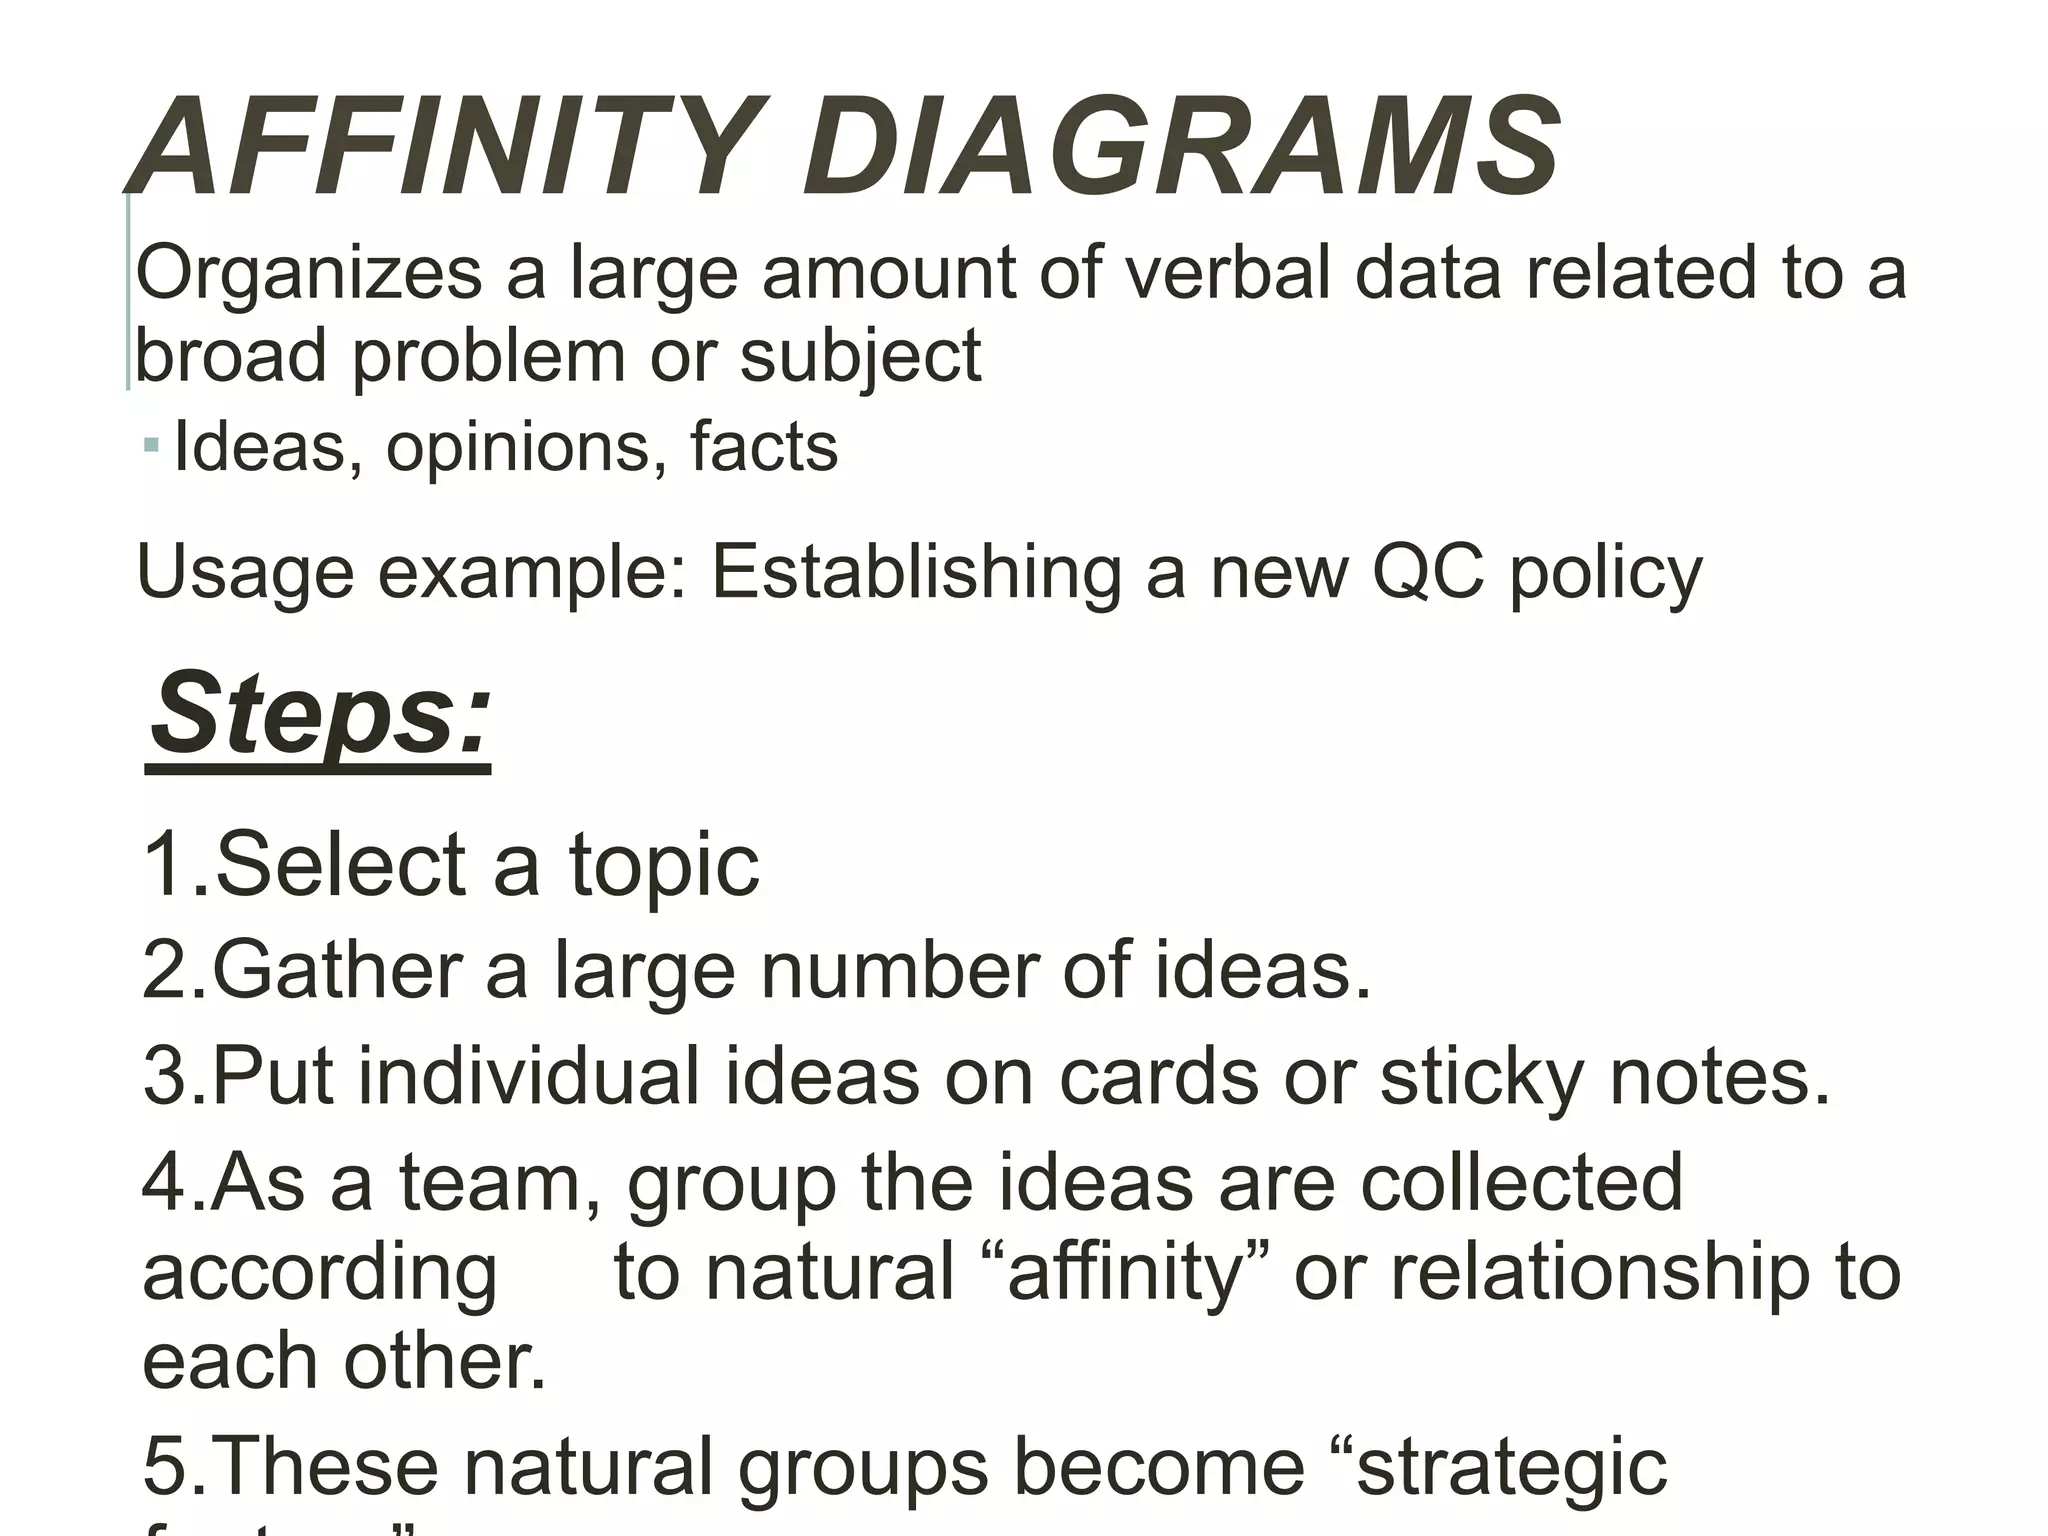
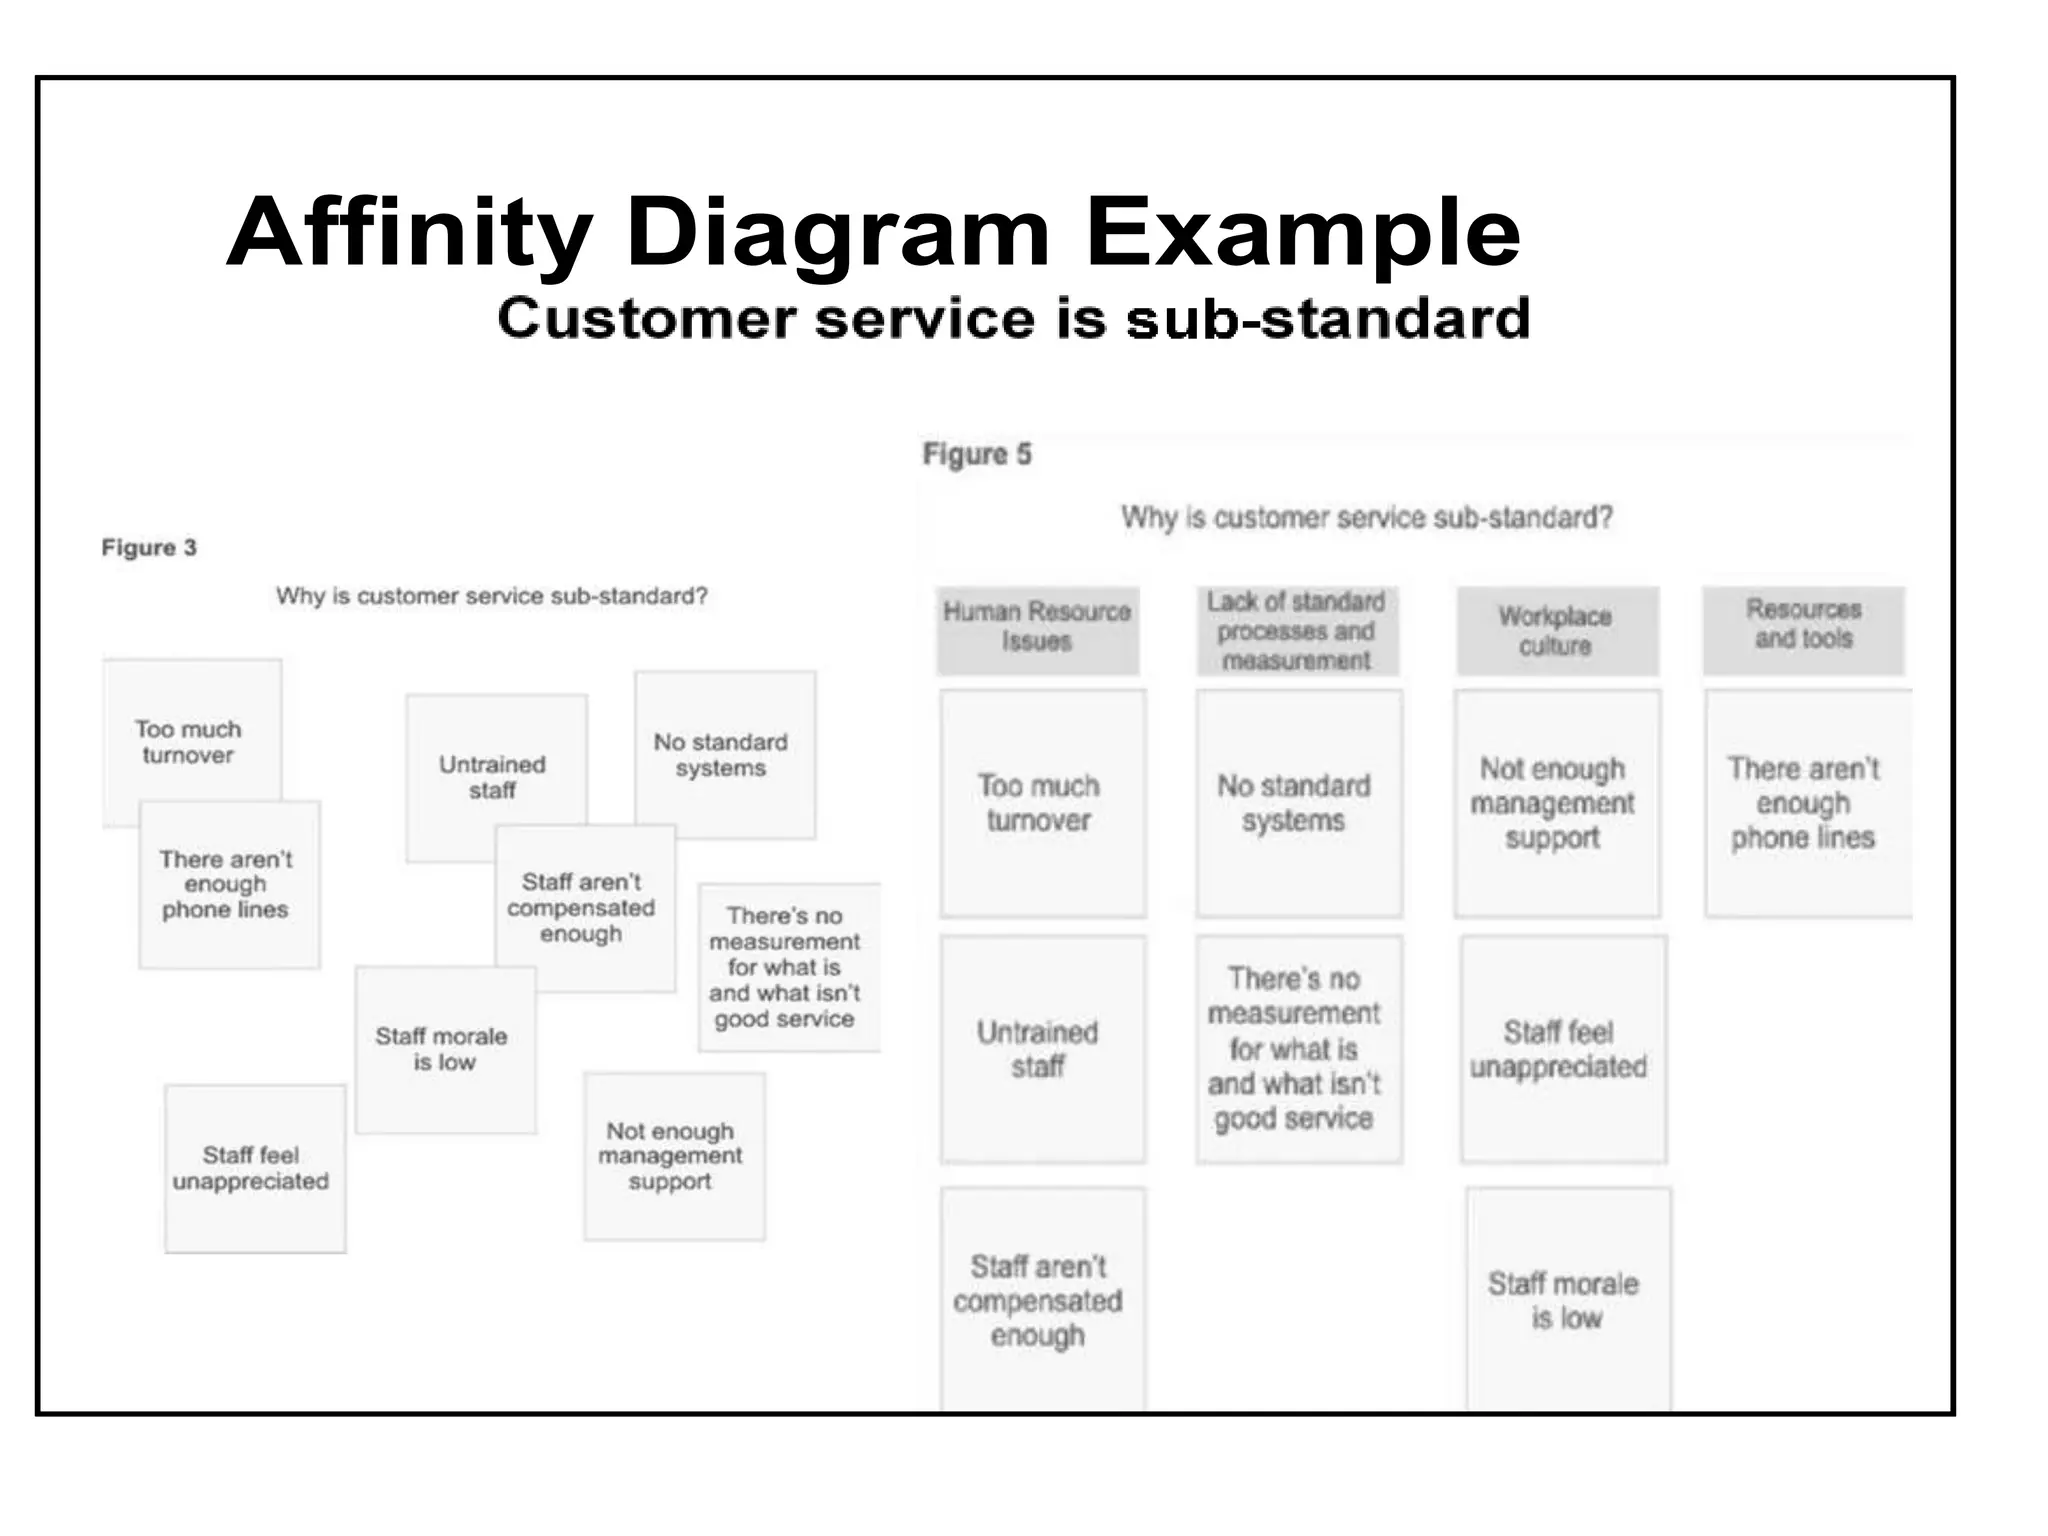
Explanation of affinity diagrams including their steps and an example usage in establishing QC policy.
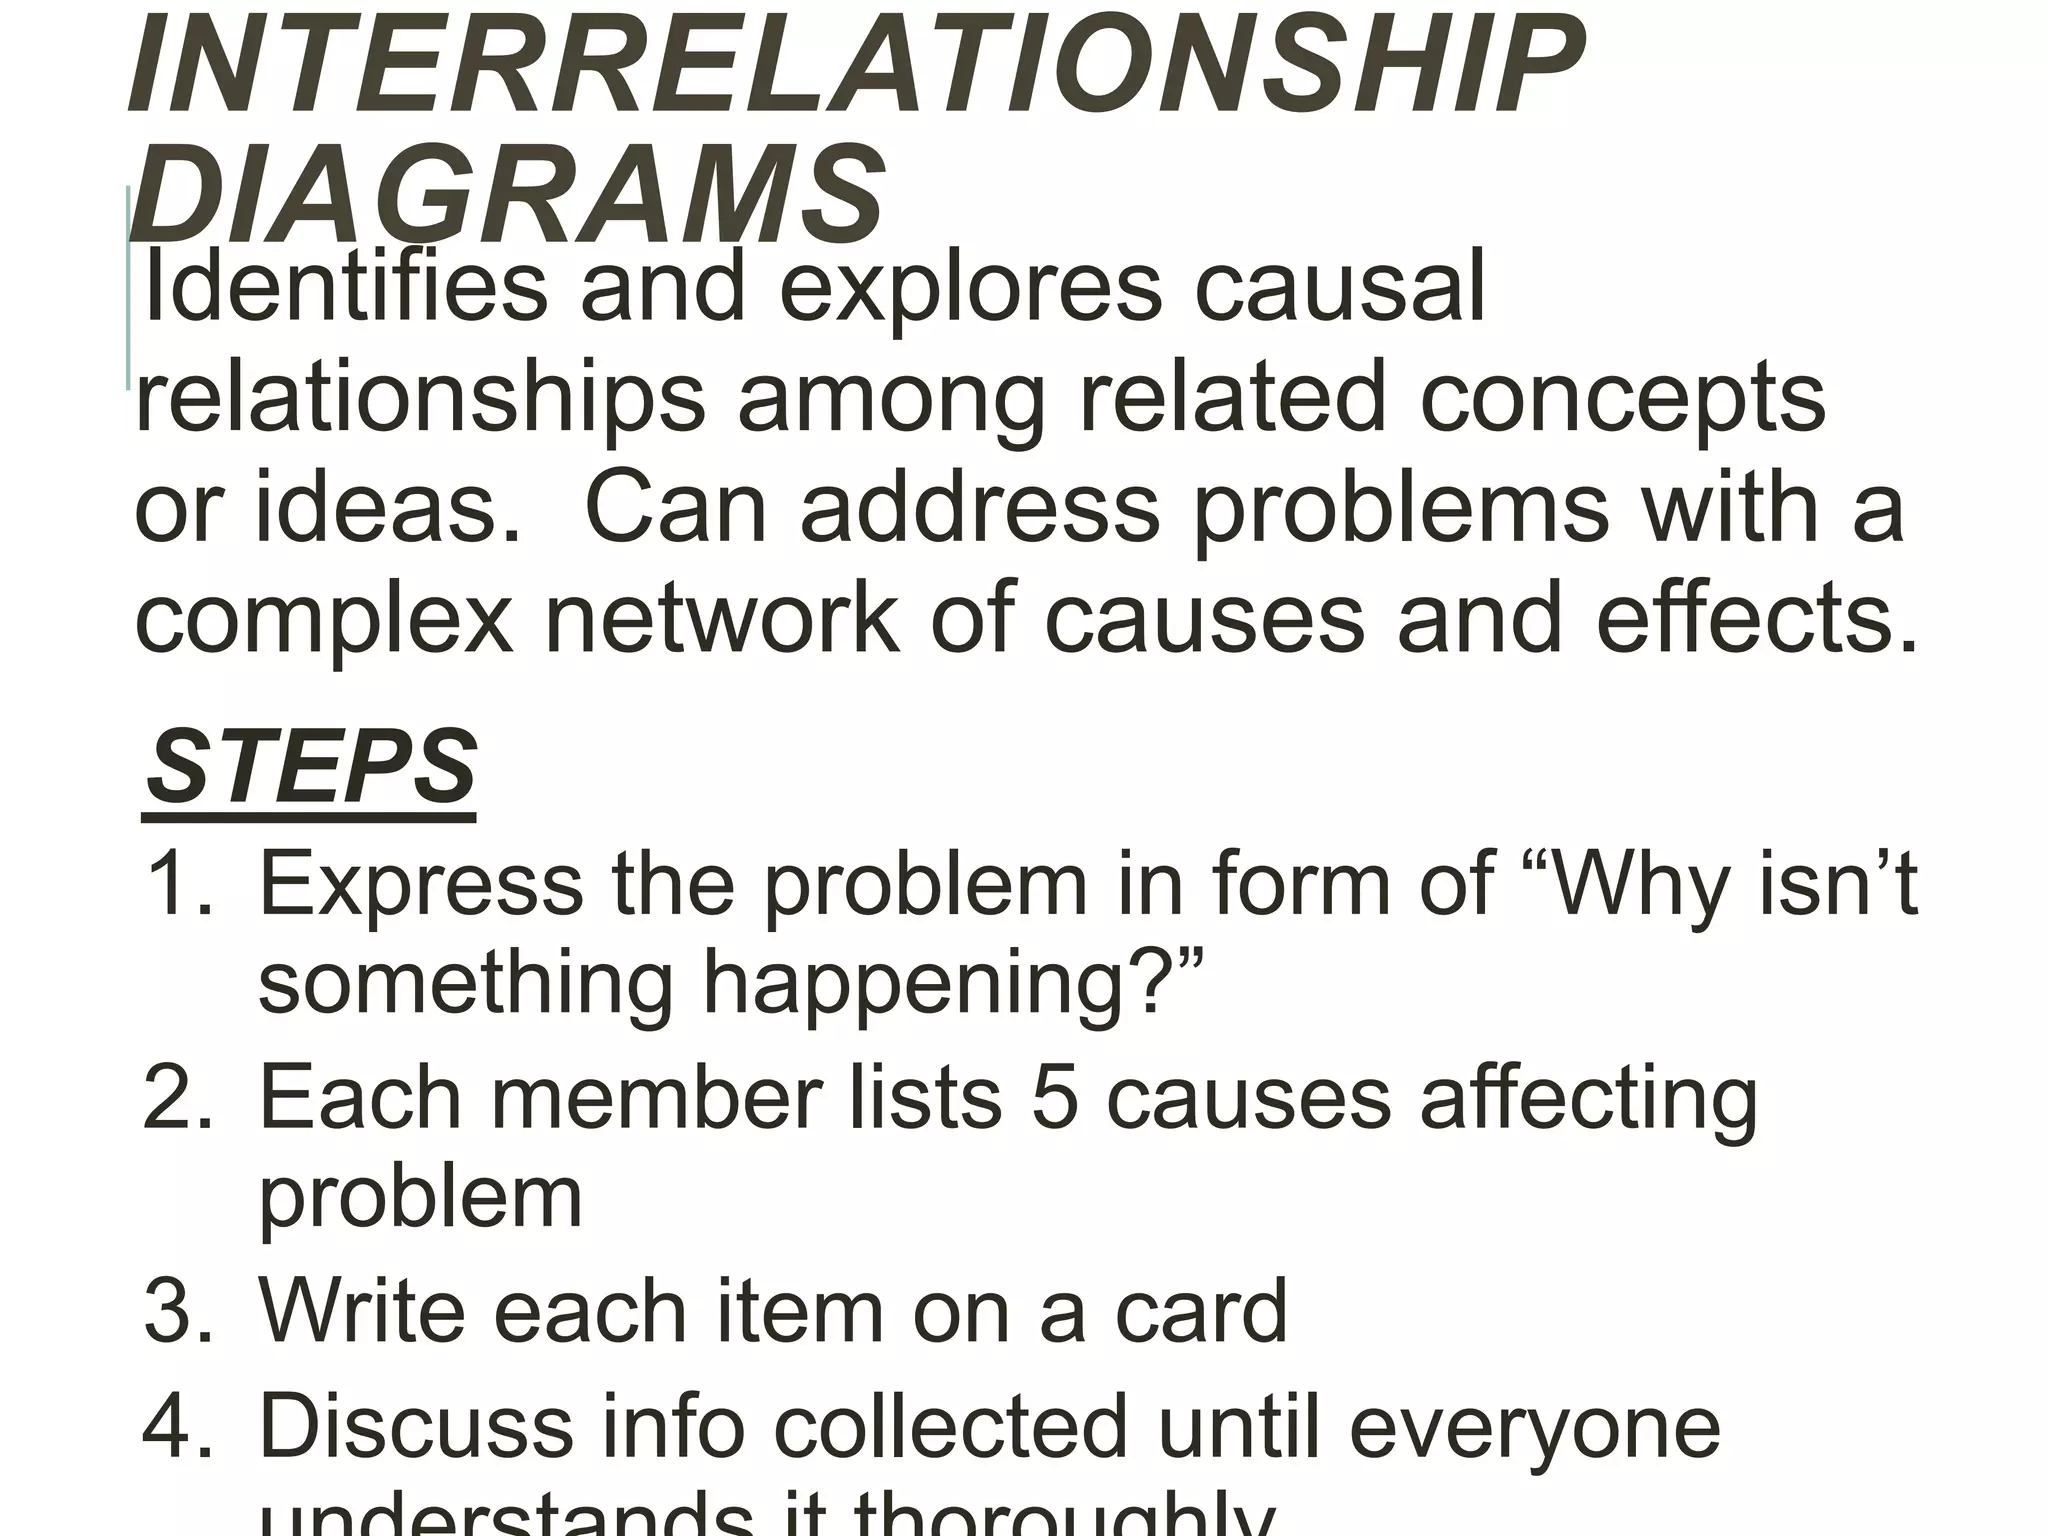
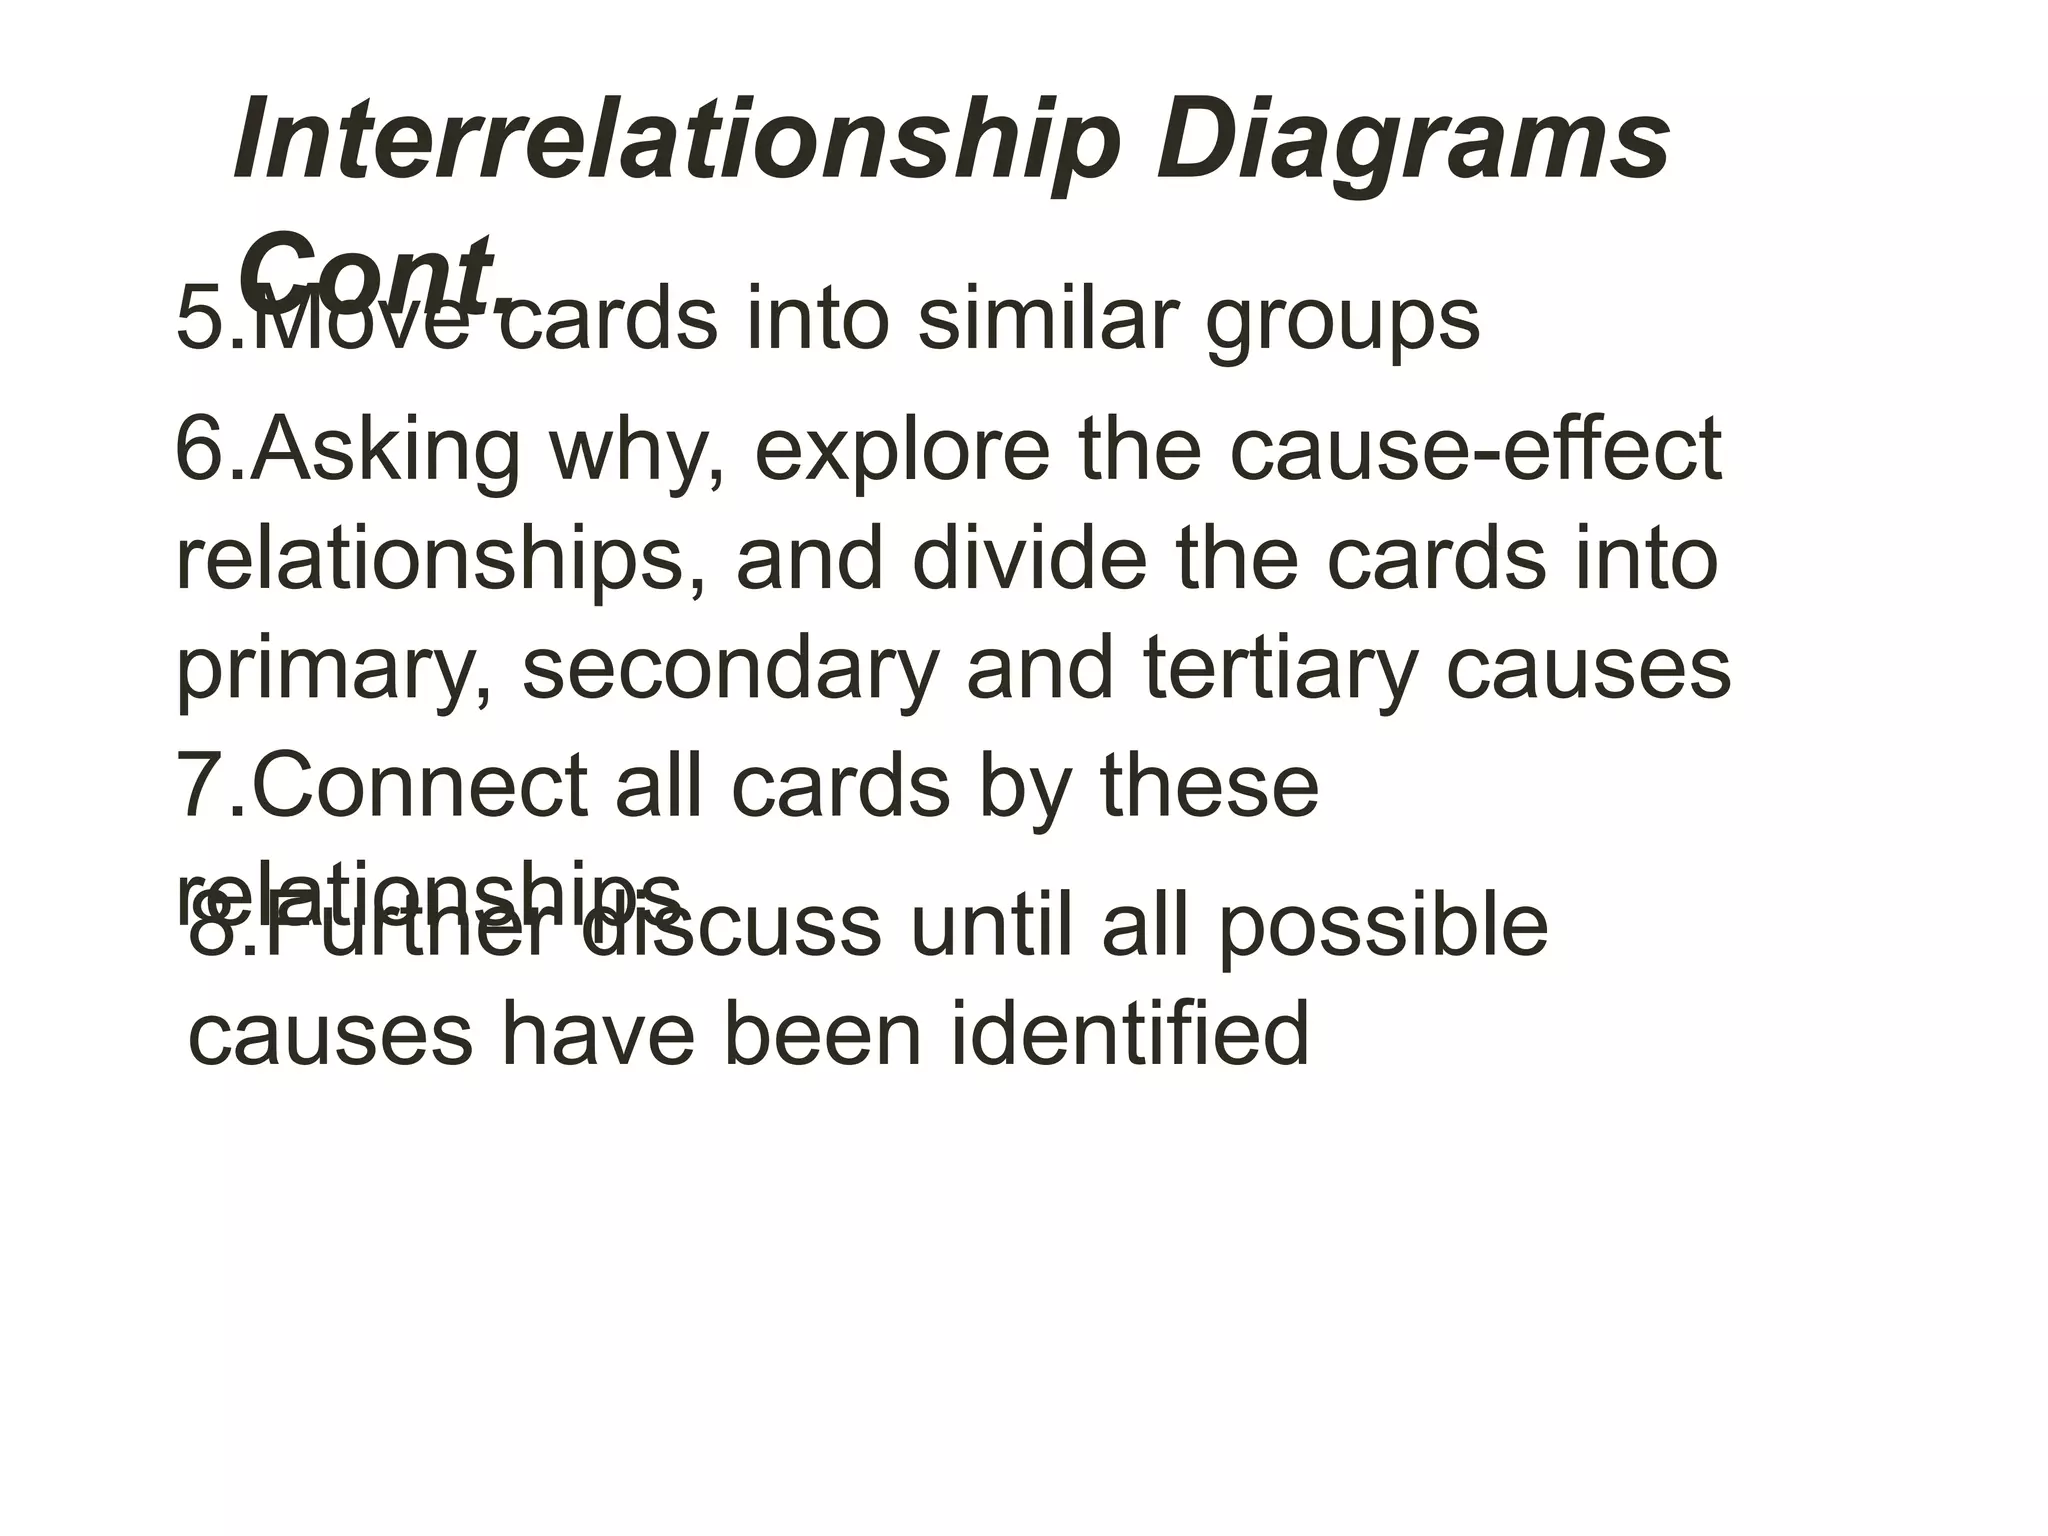
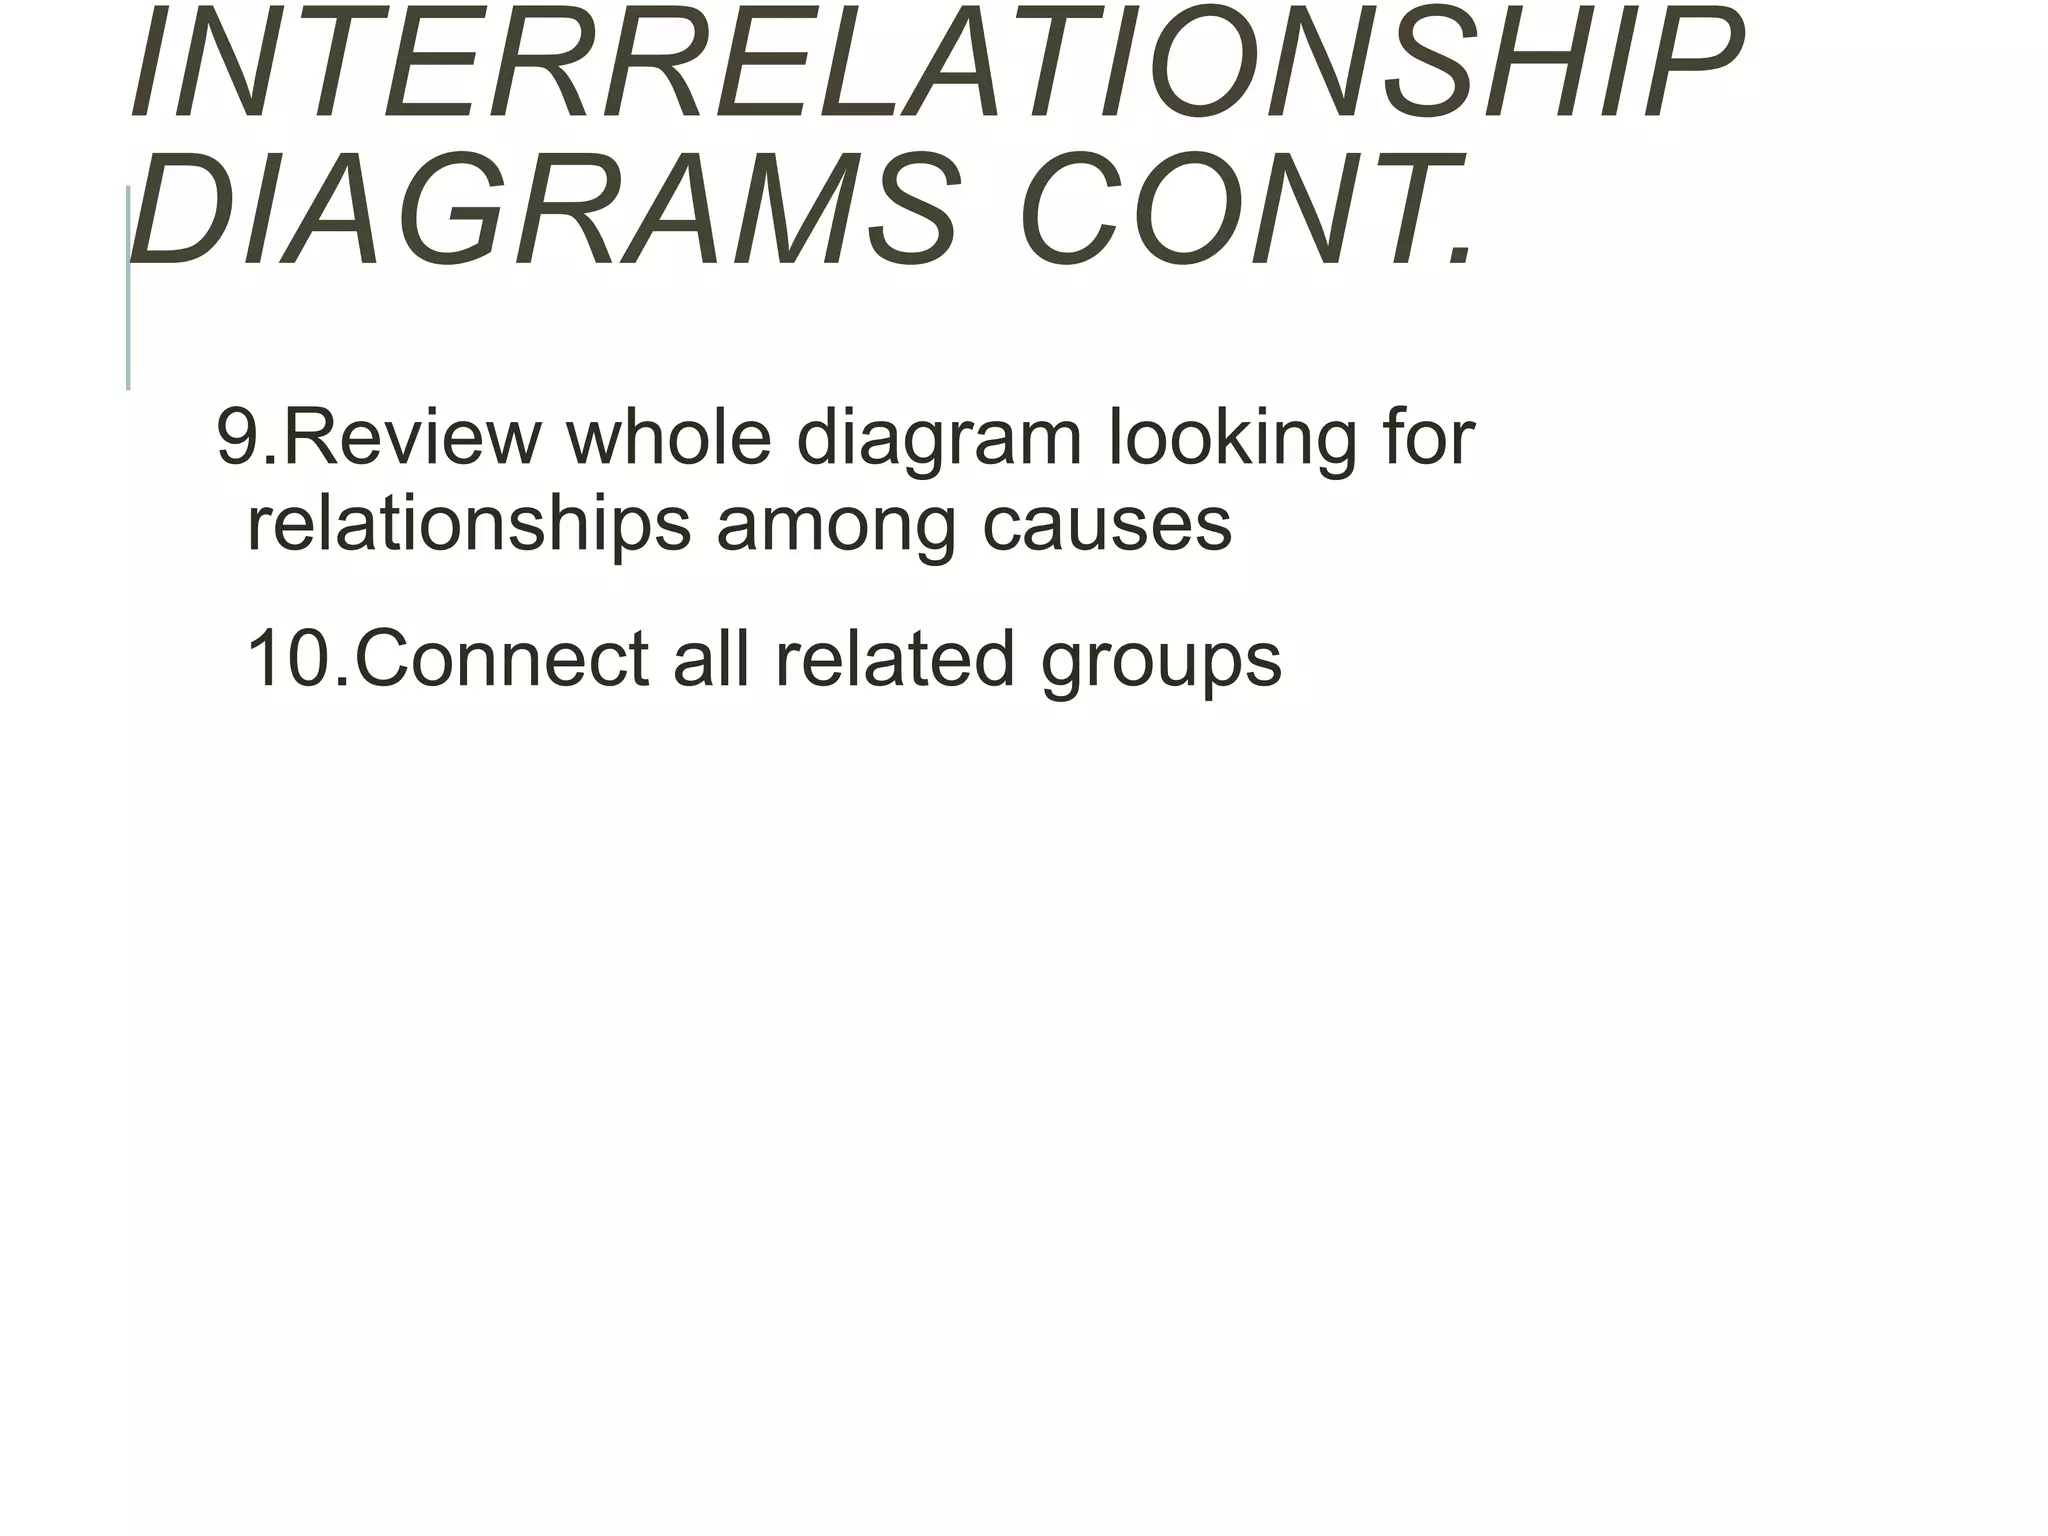
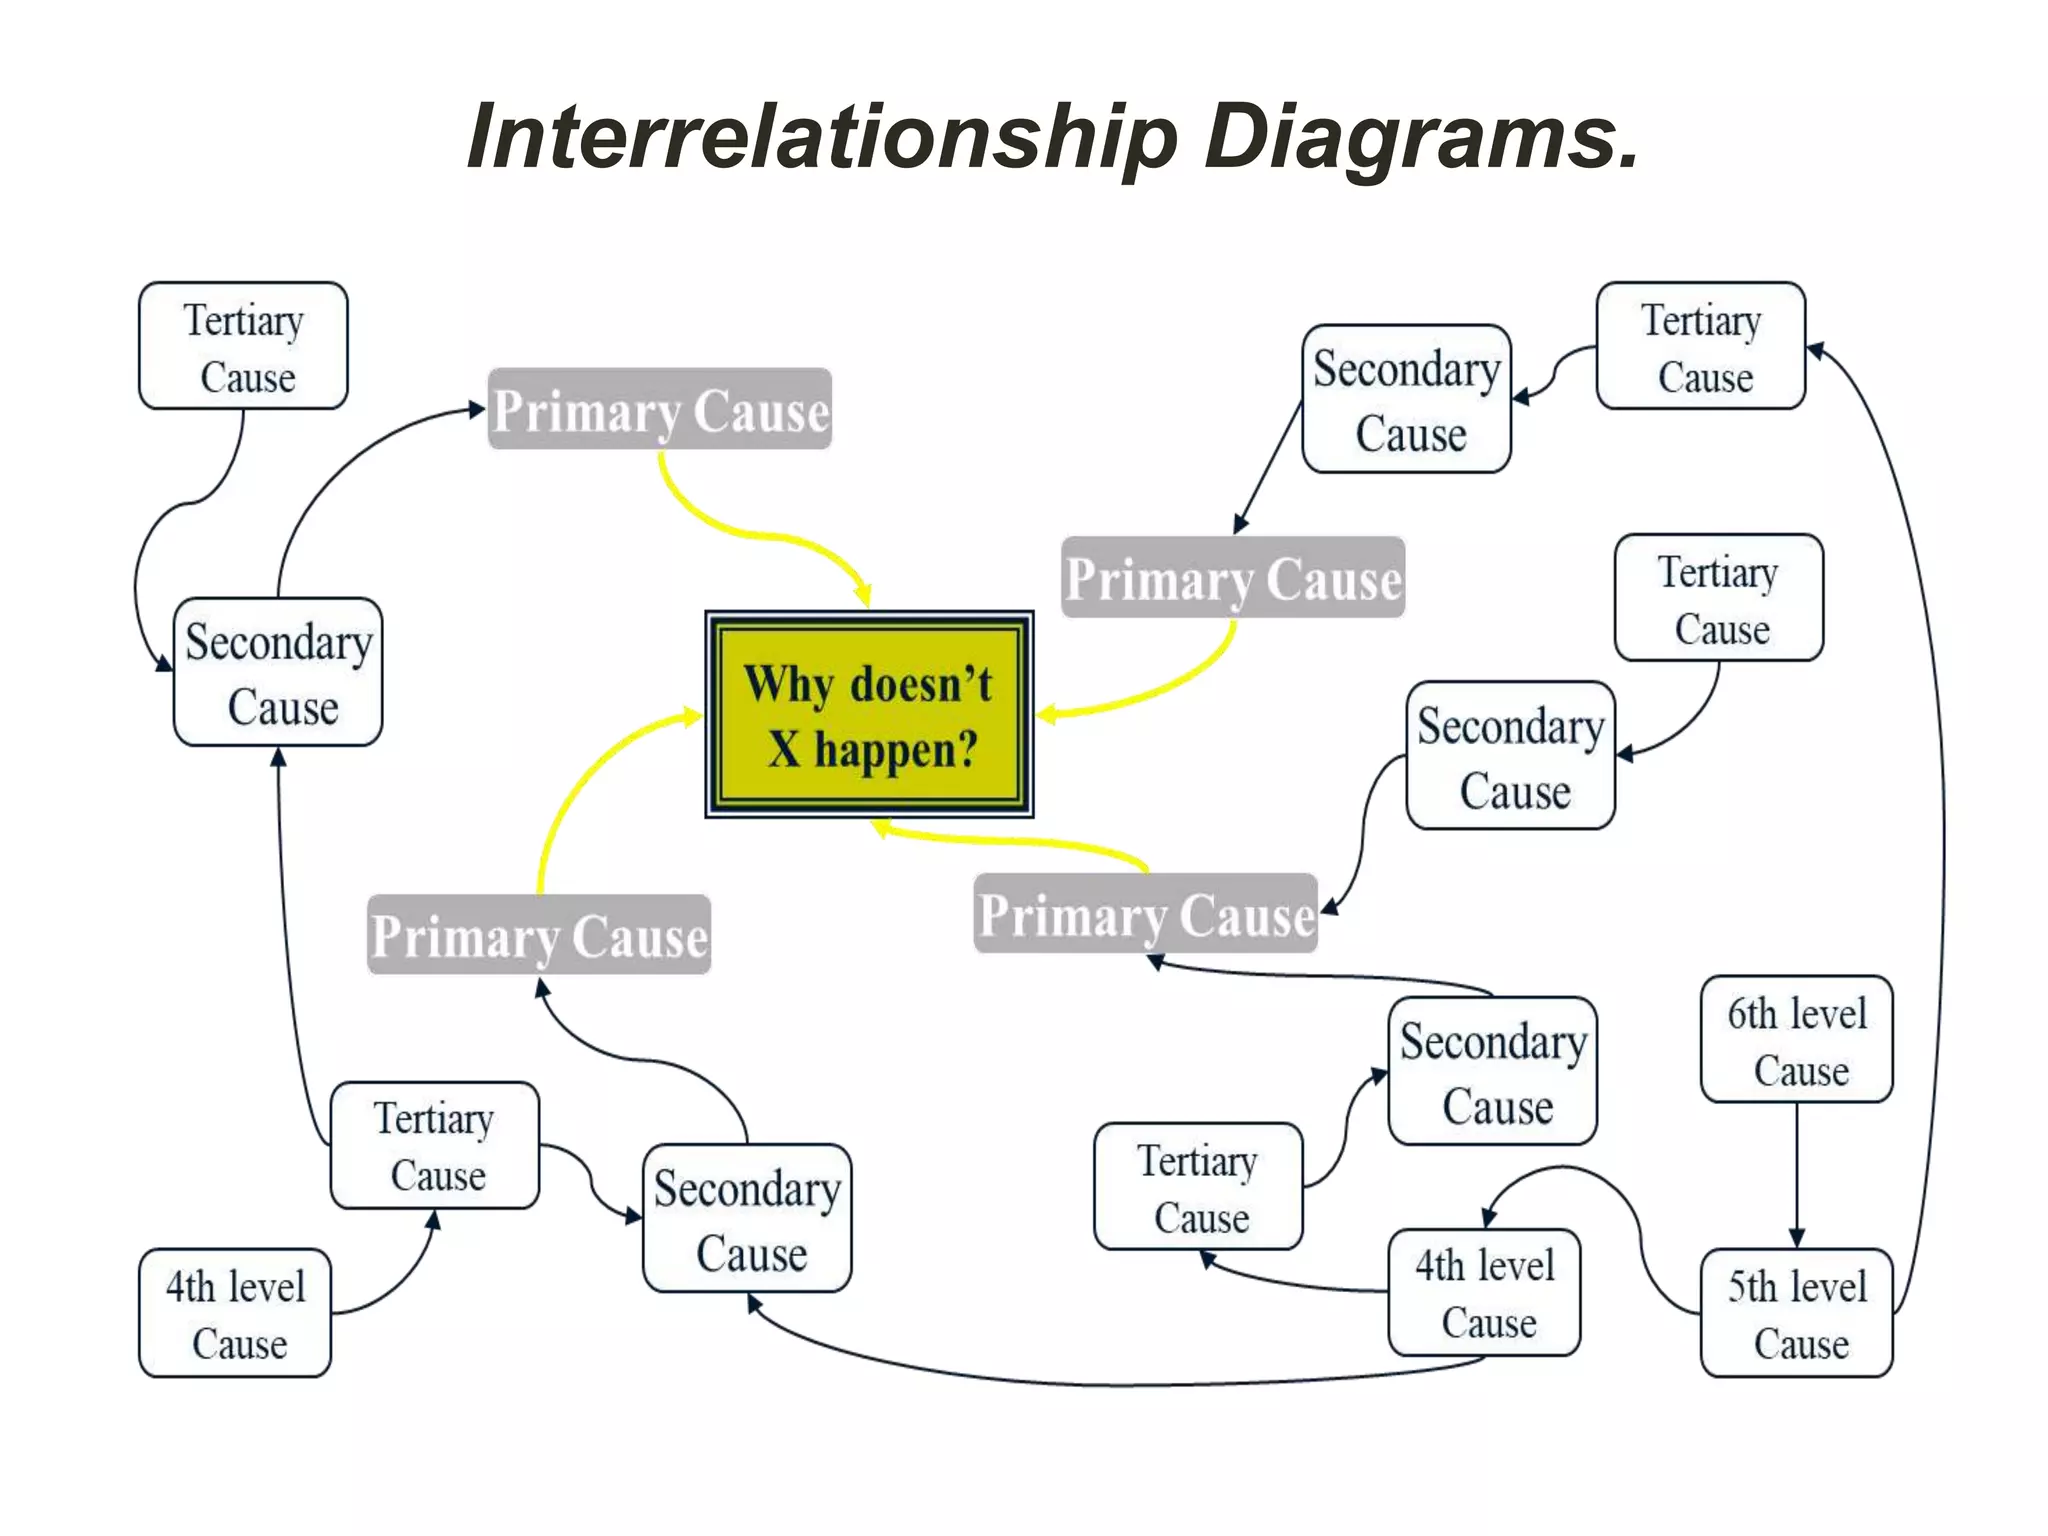
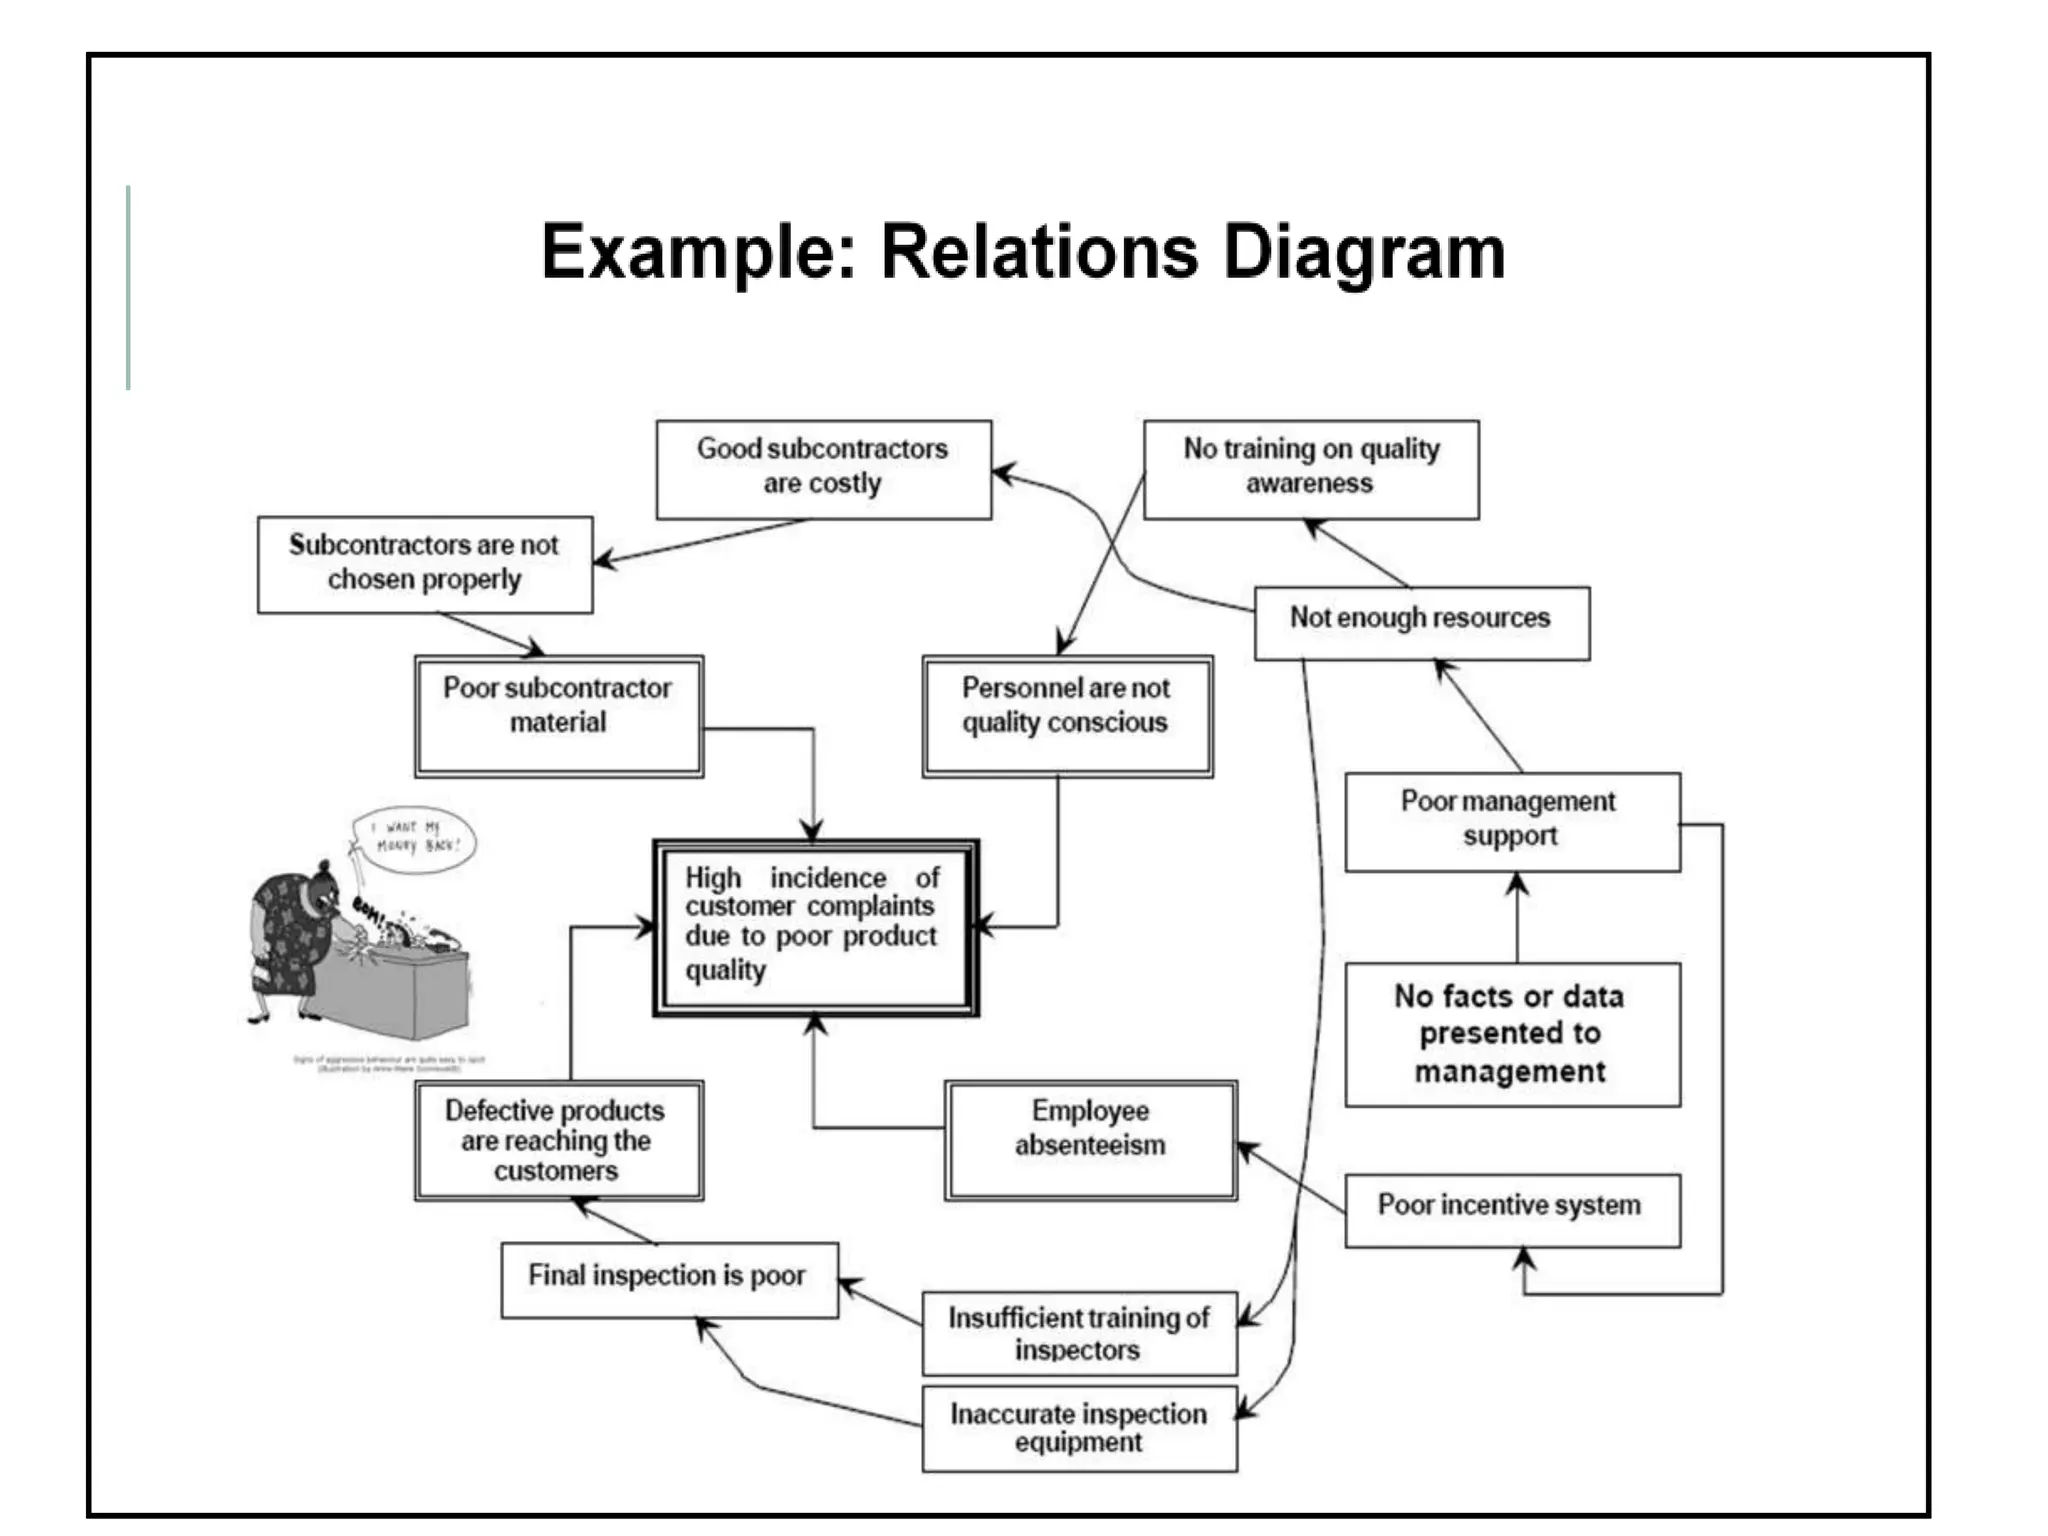
Process of using interrelationship diagrams to identify causal relationships among complex problems.
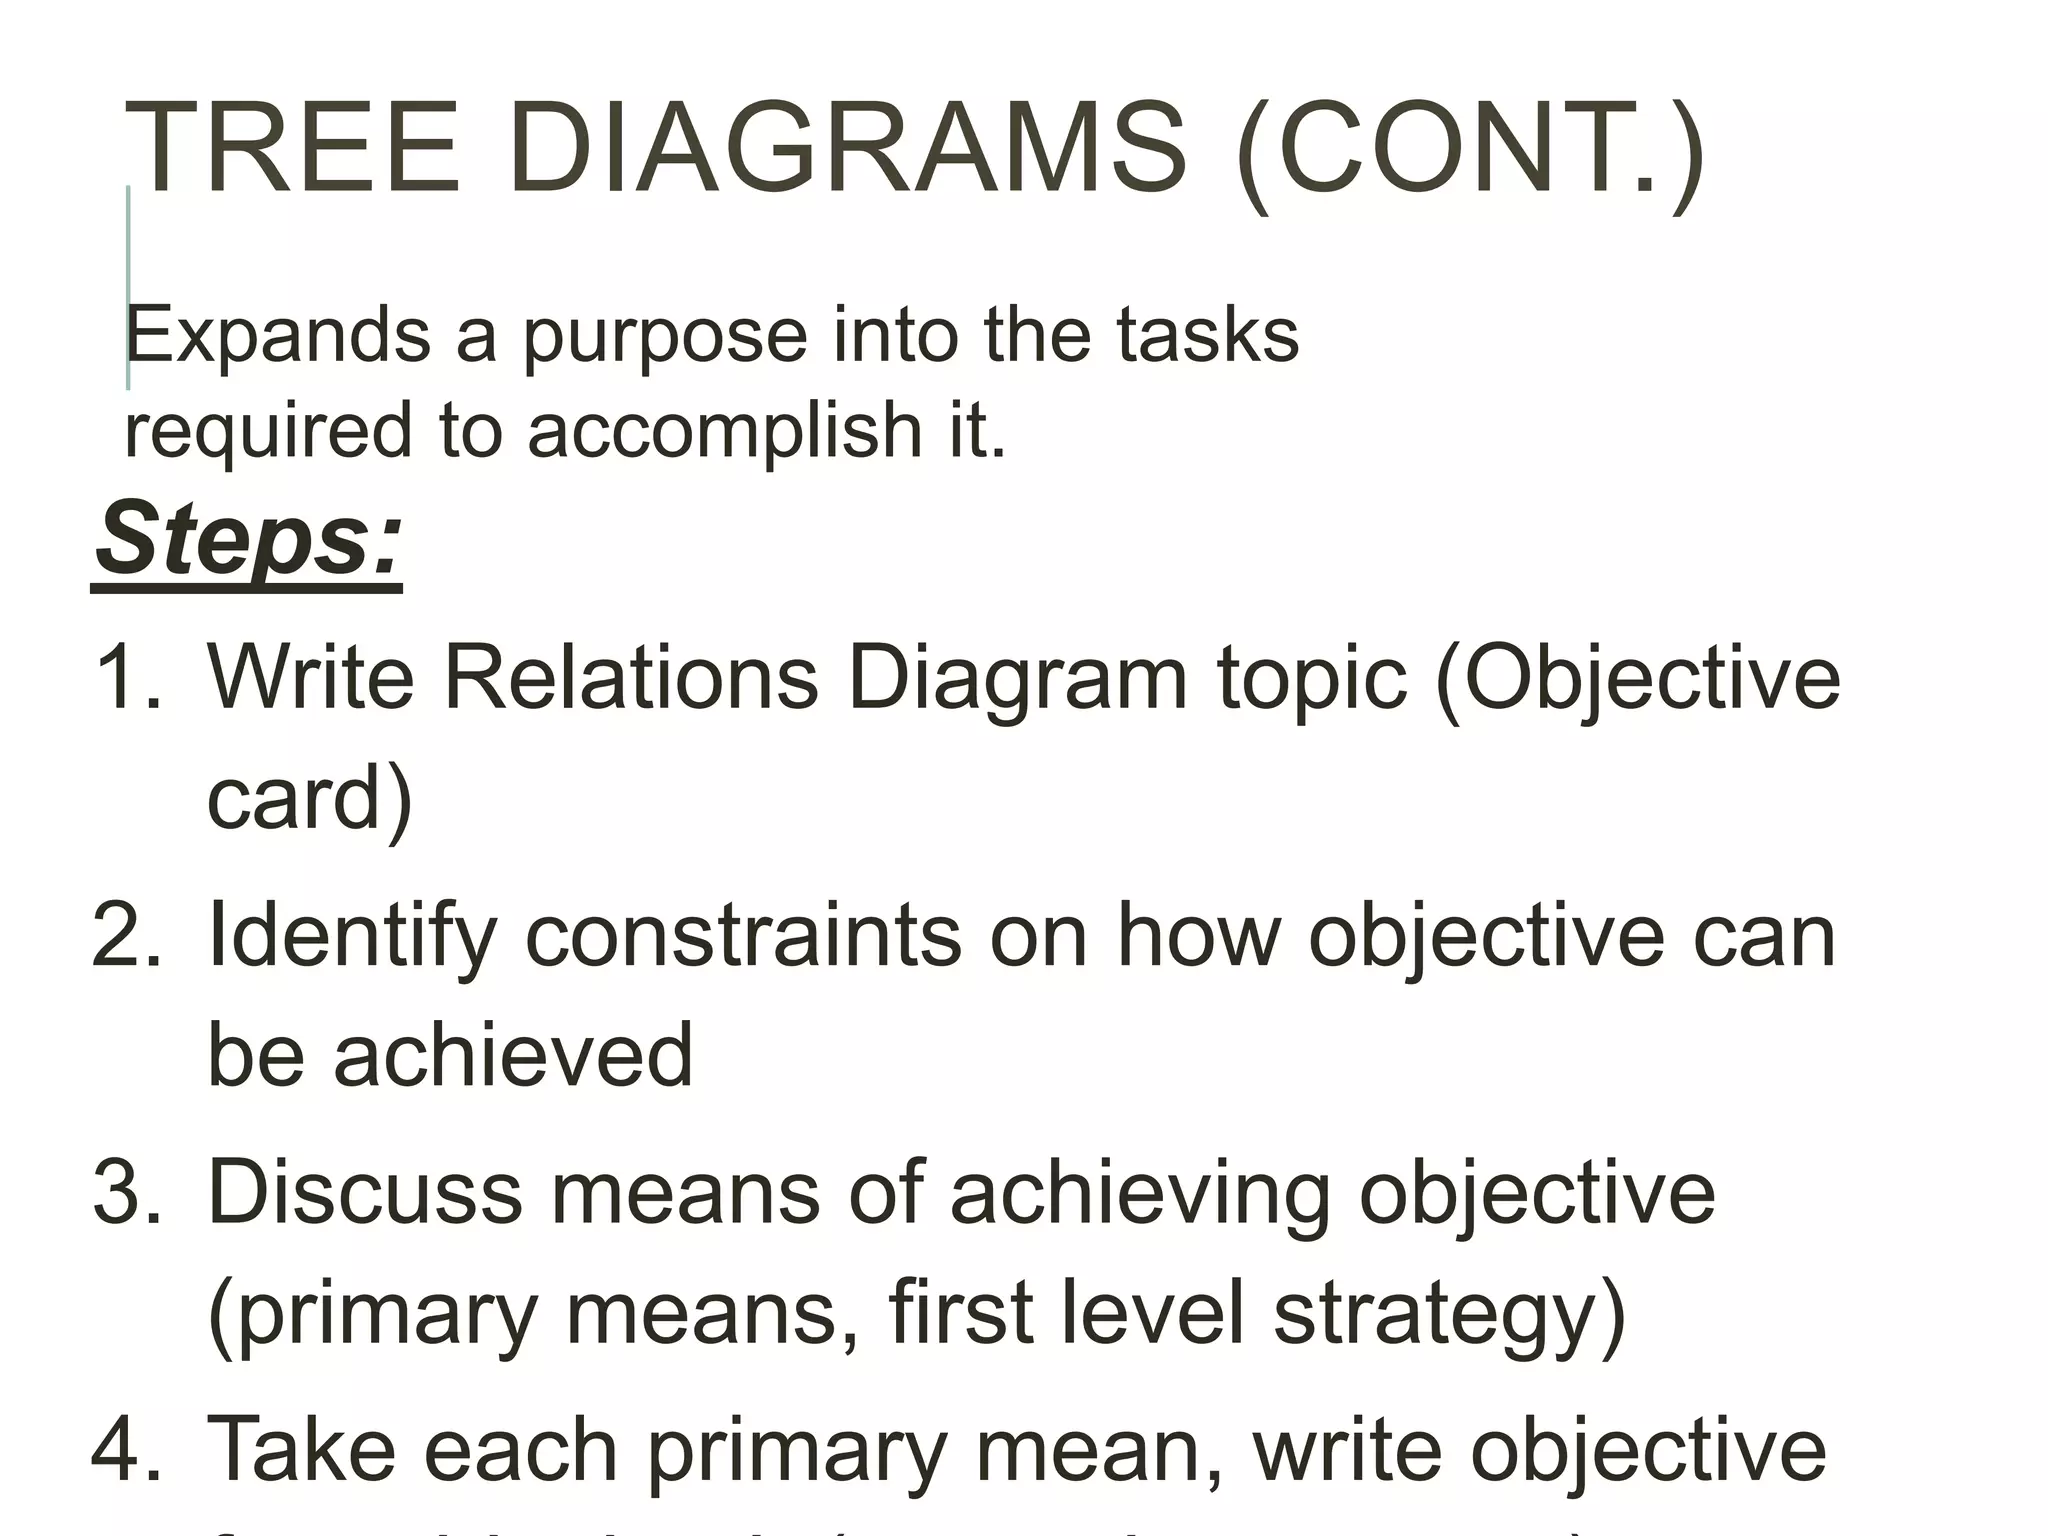
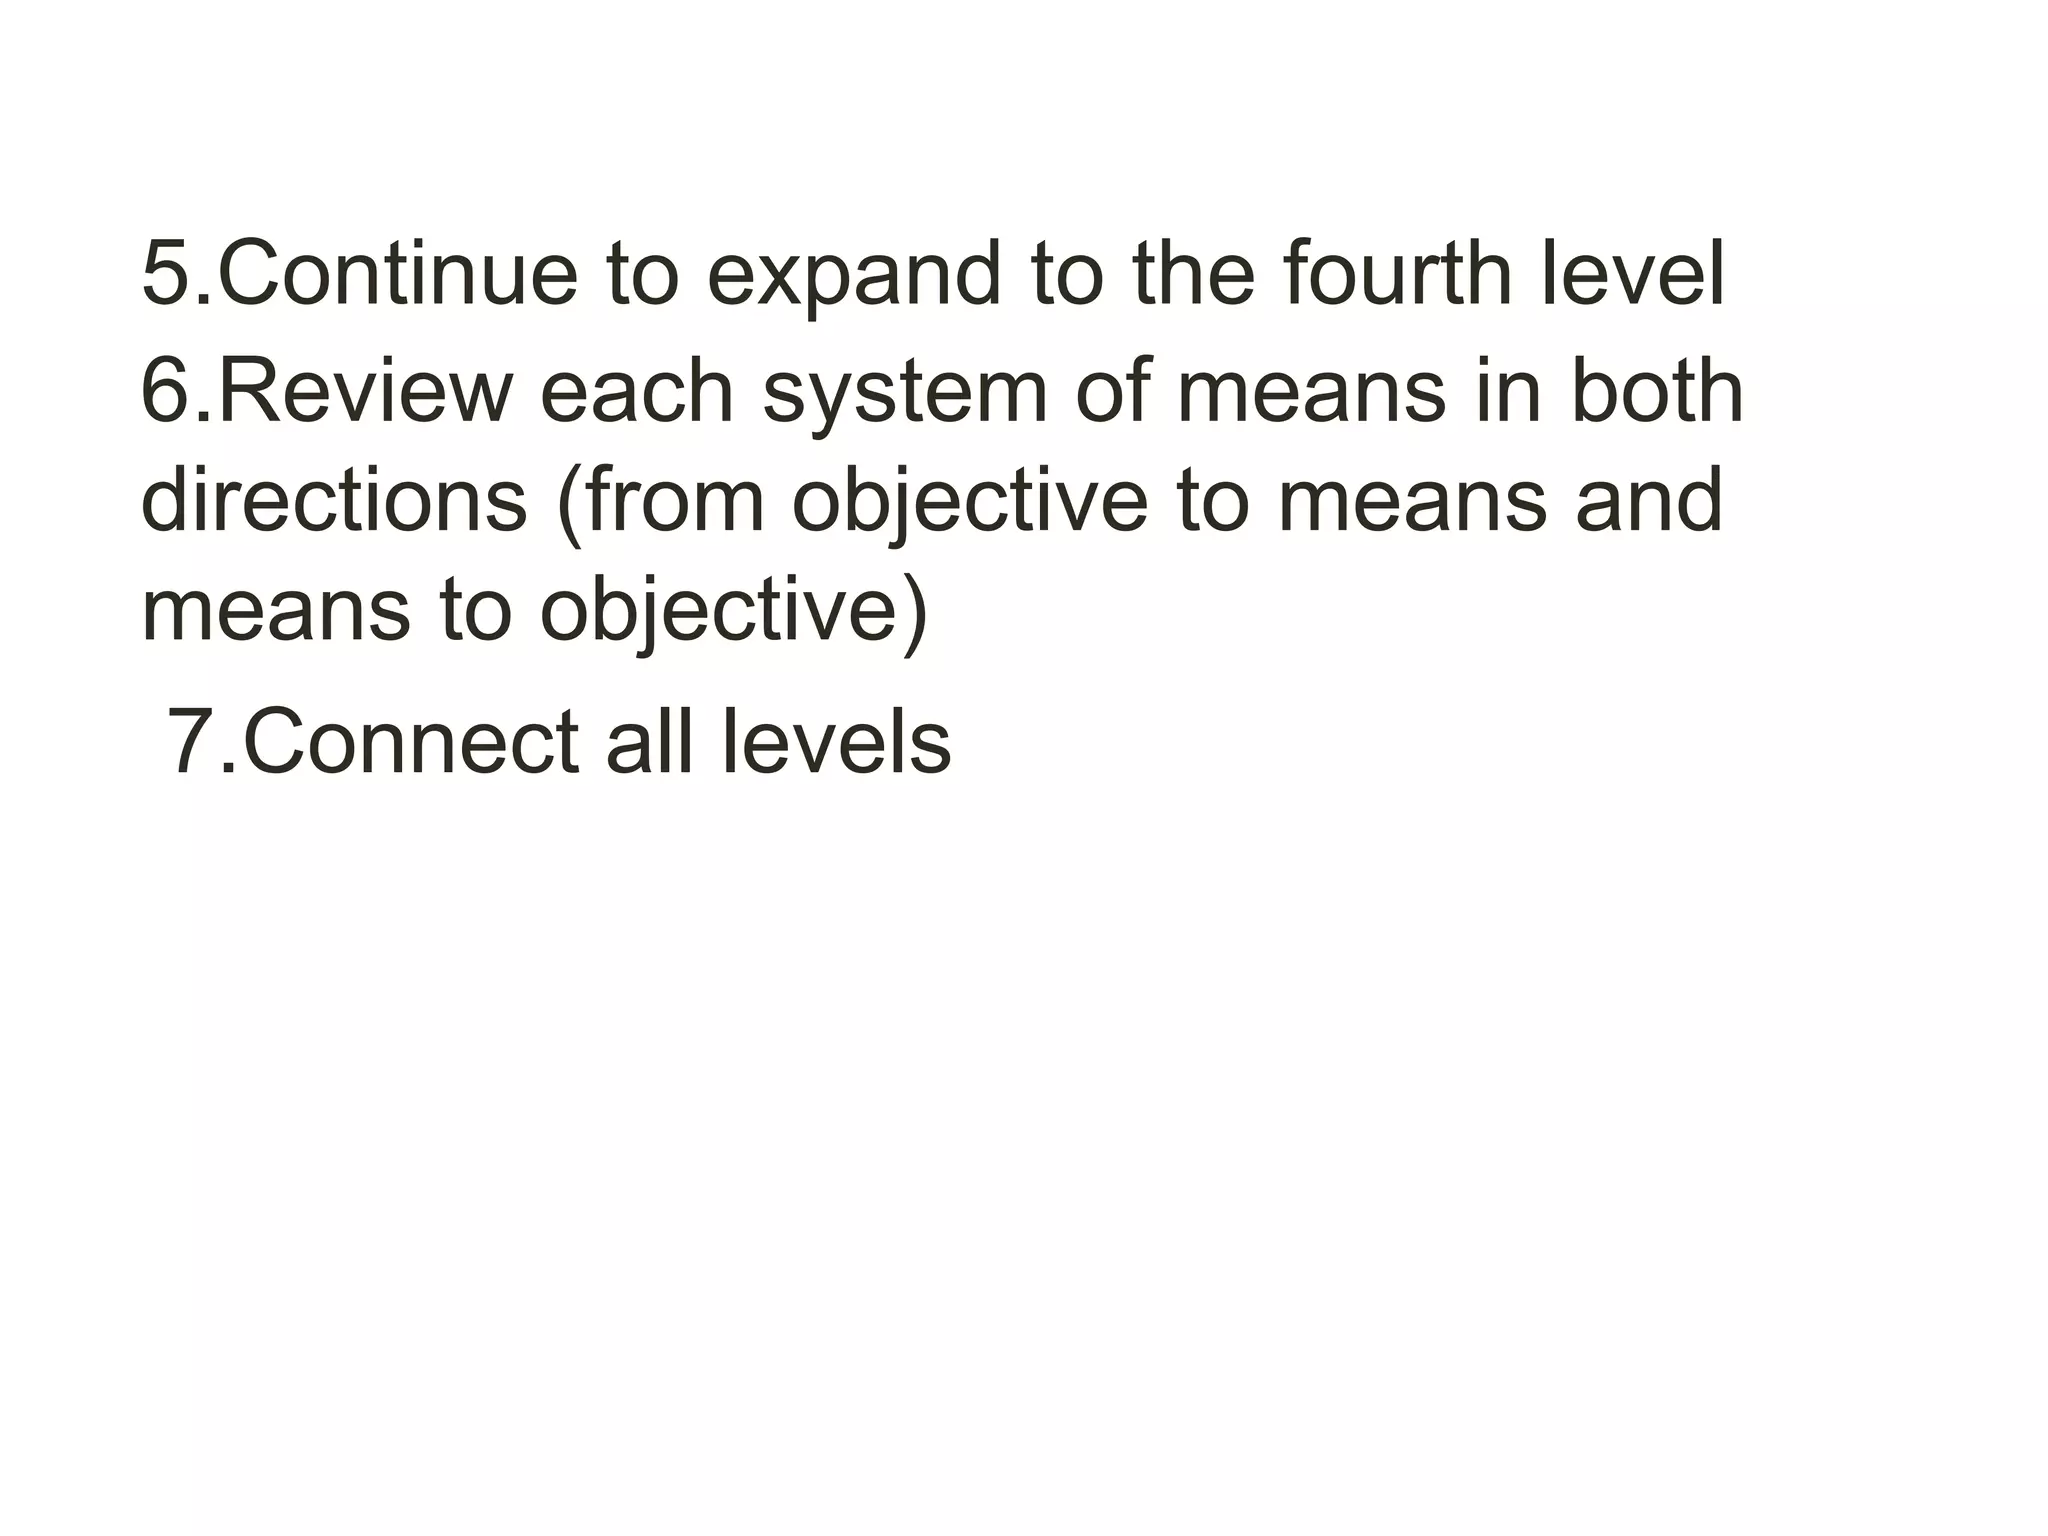
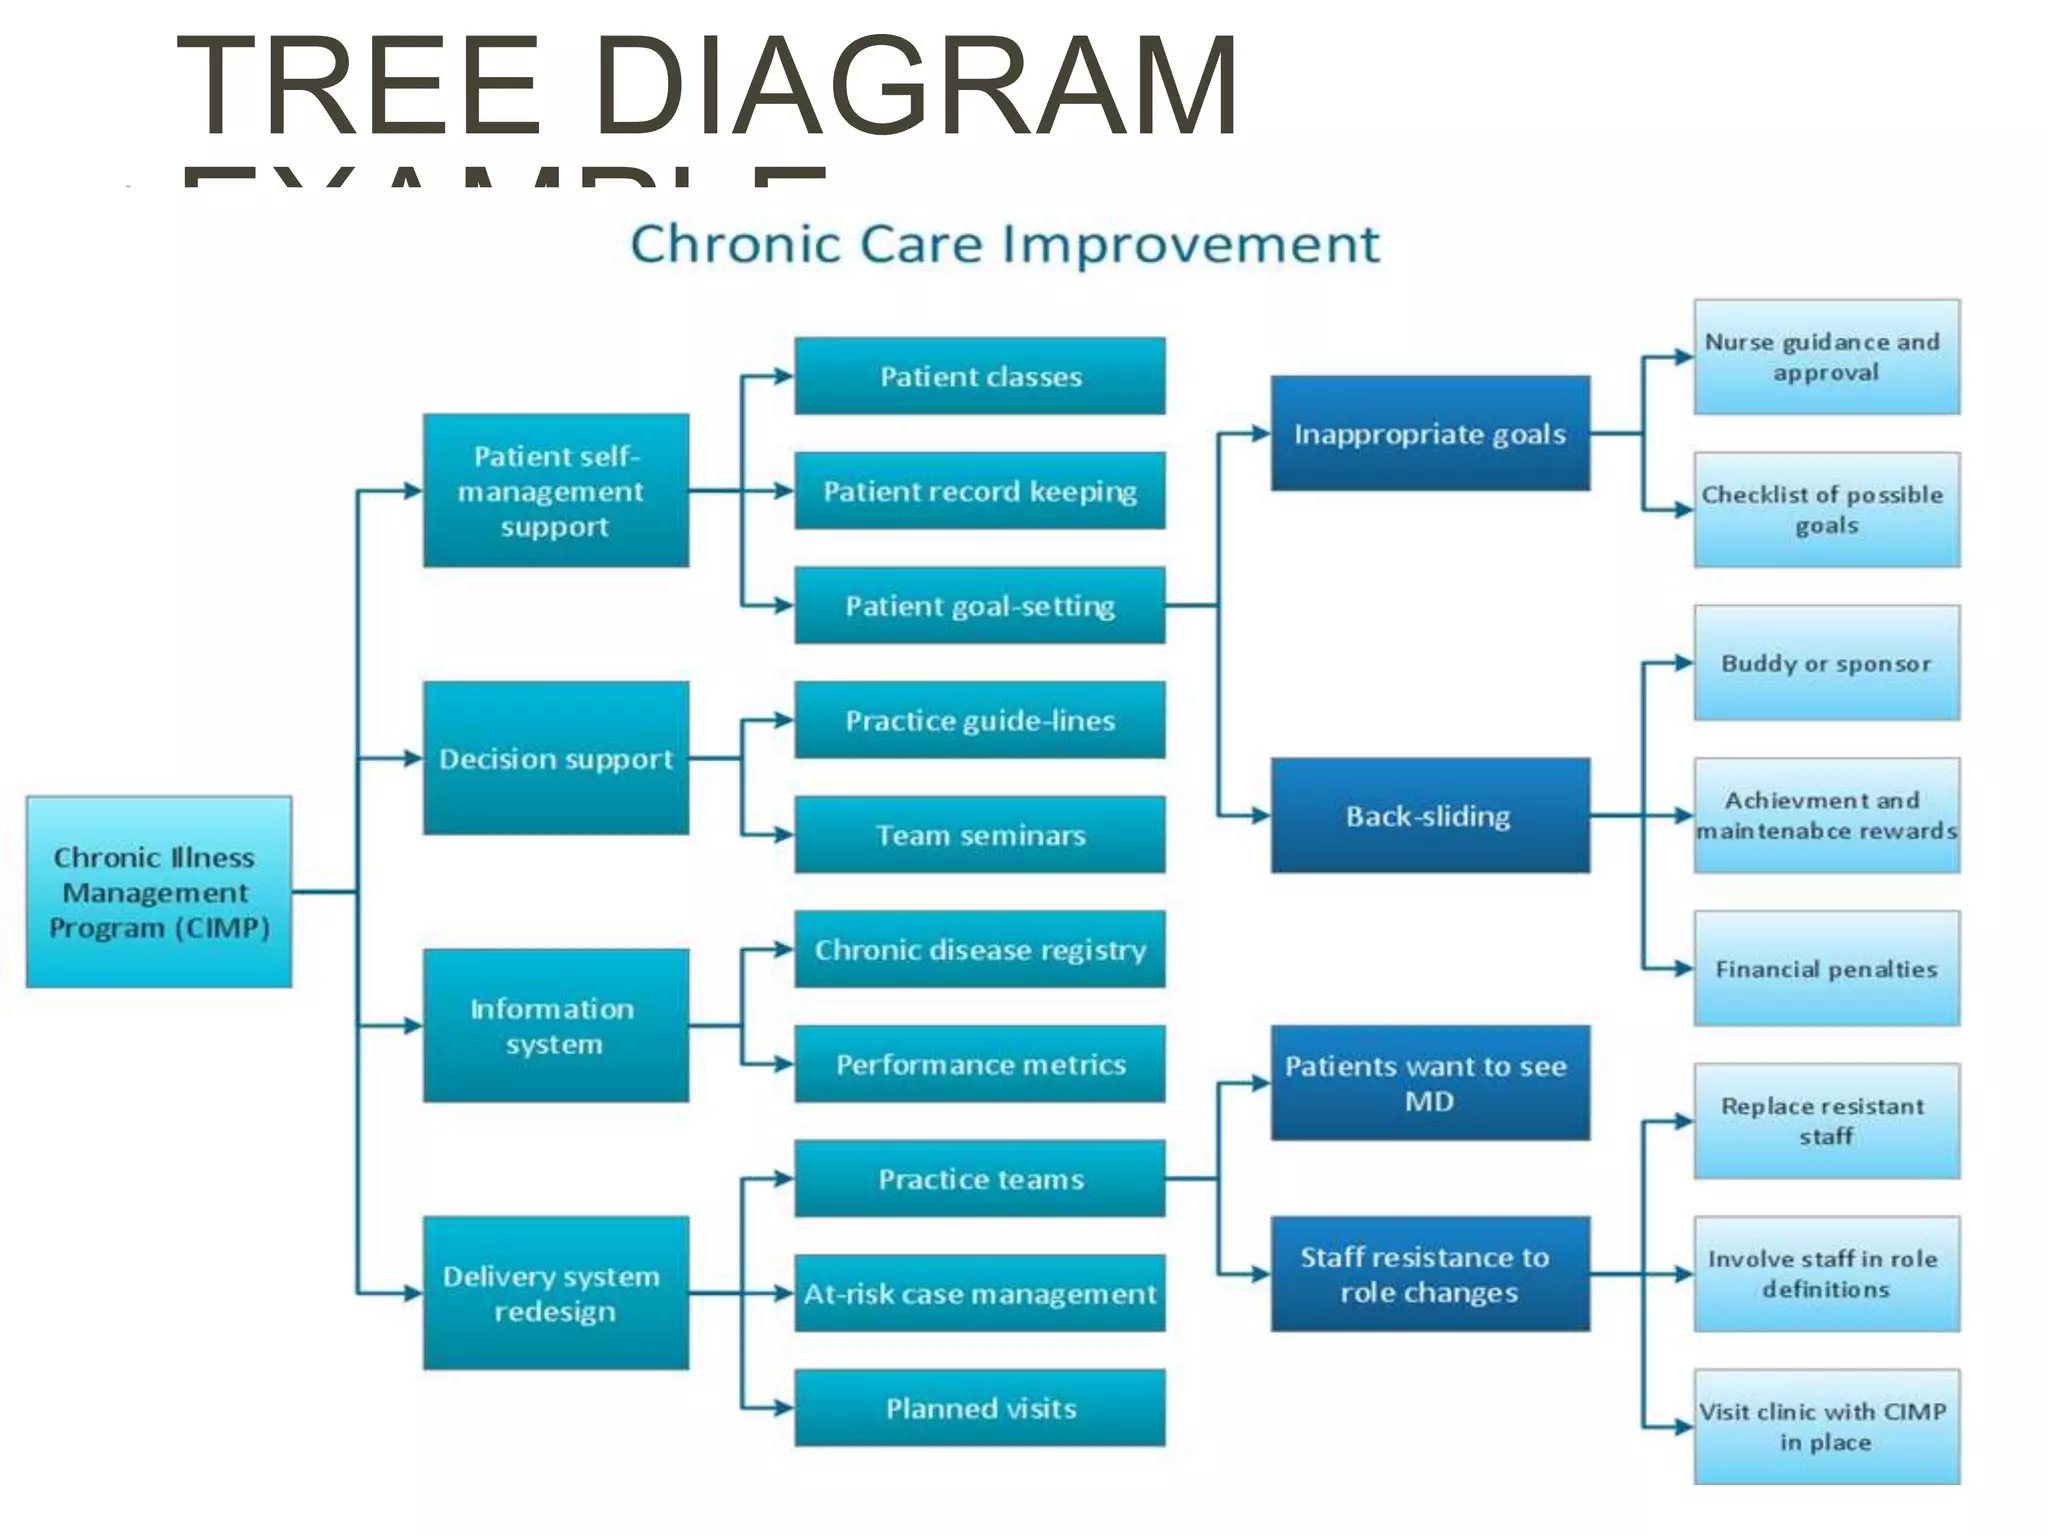
Steps for creating tree diagrams for structured decision-making and task expansion towards objectives.
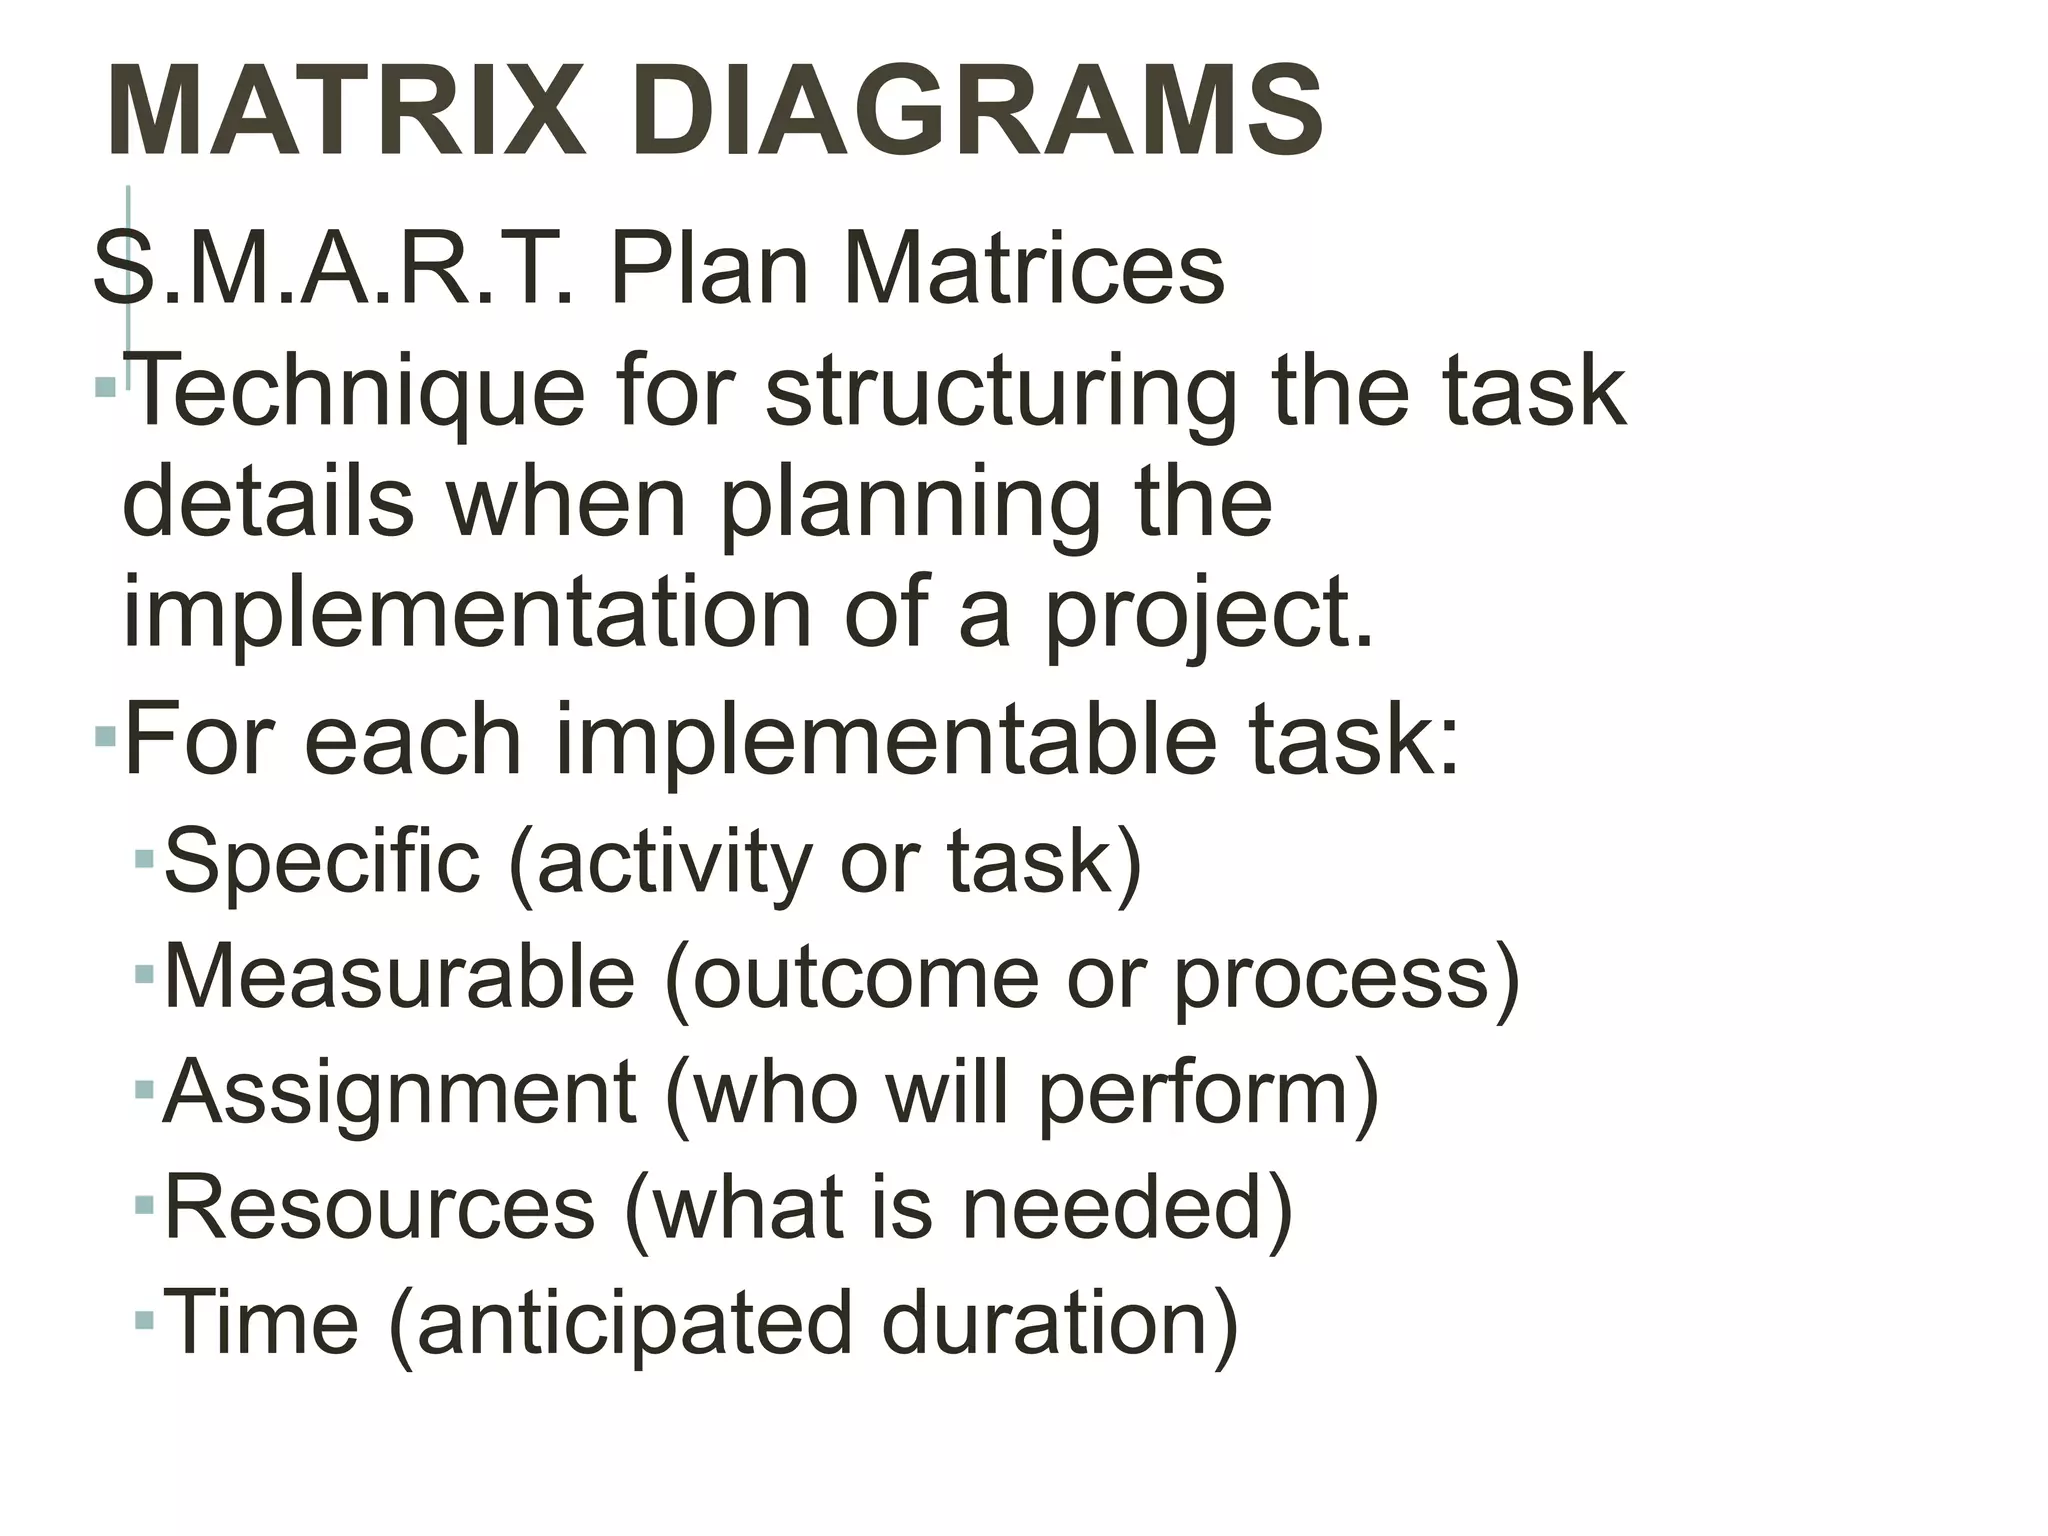
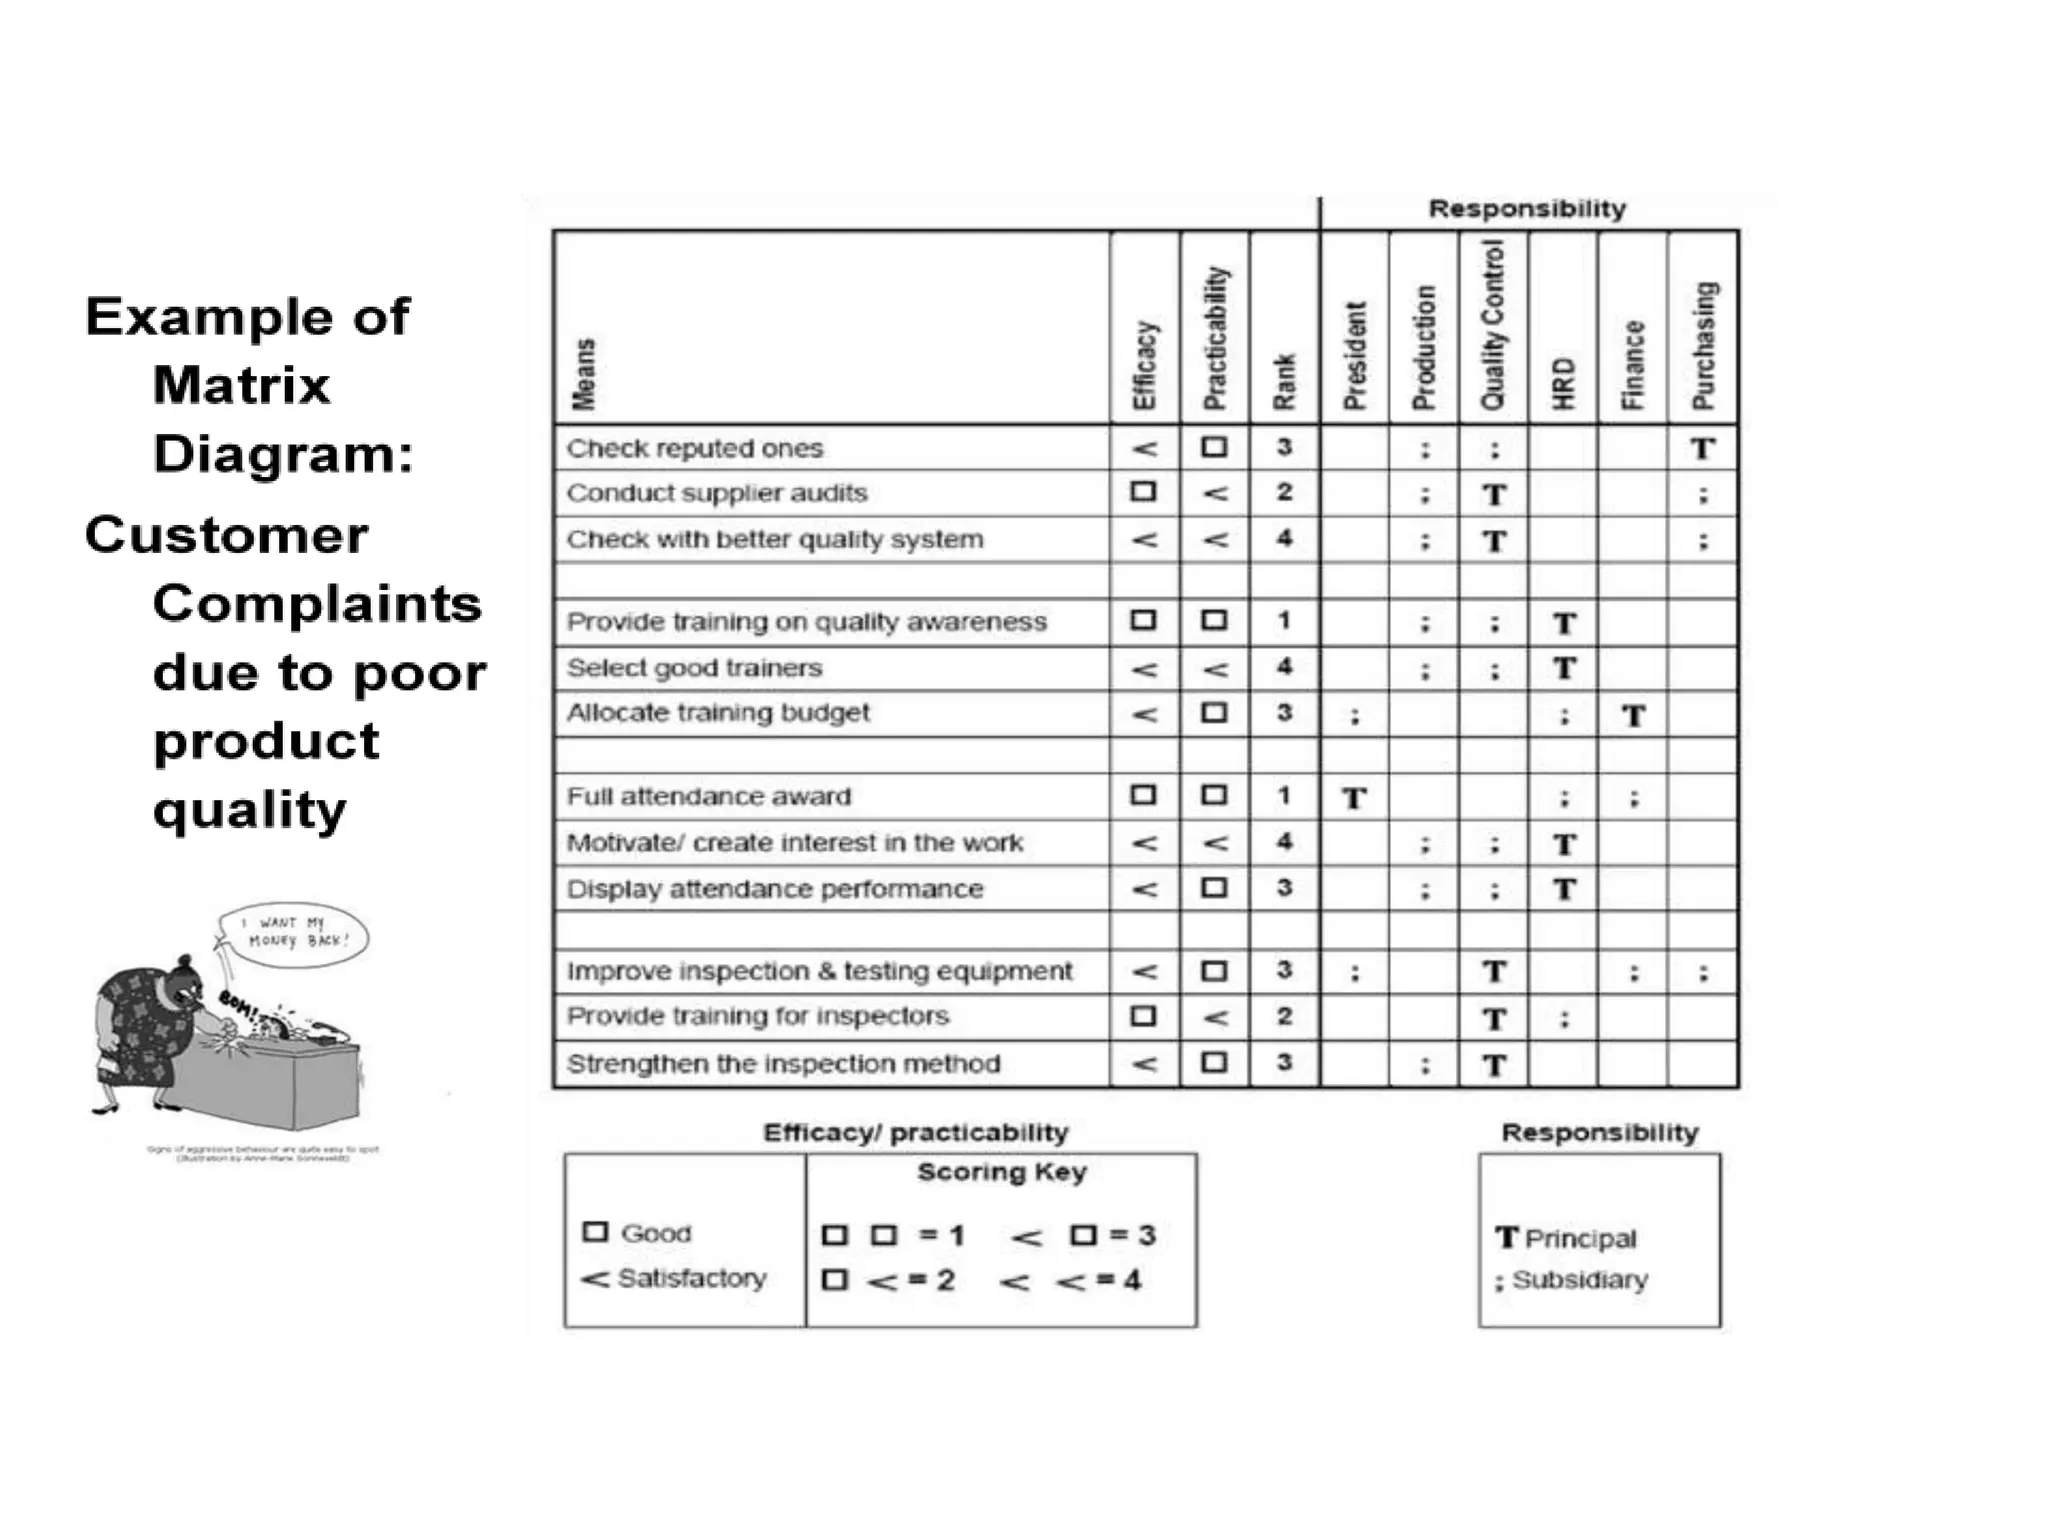
The use of matrix diagrams for structuring project details using S.M.A.R.T. criteria for effective planning.
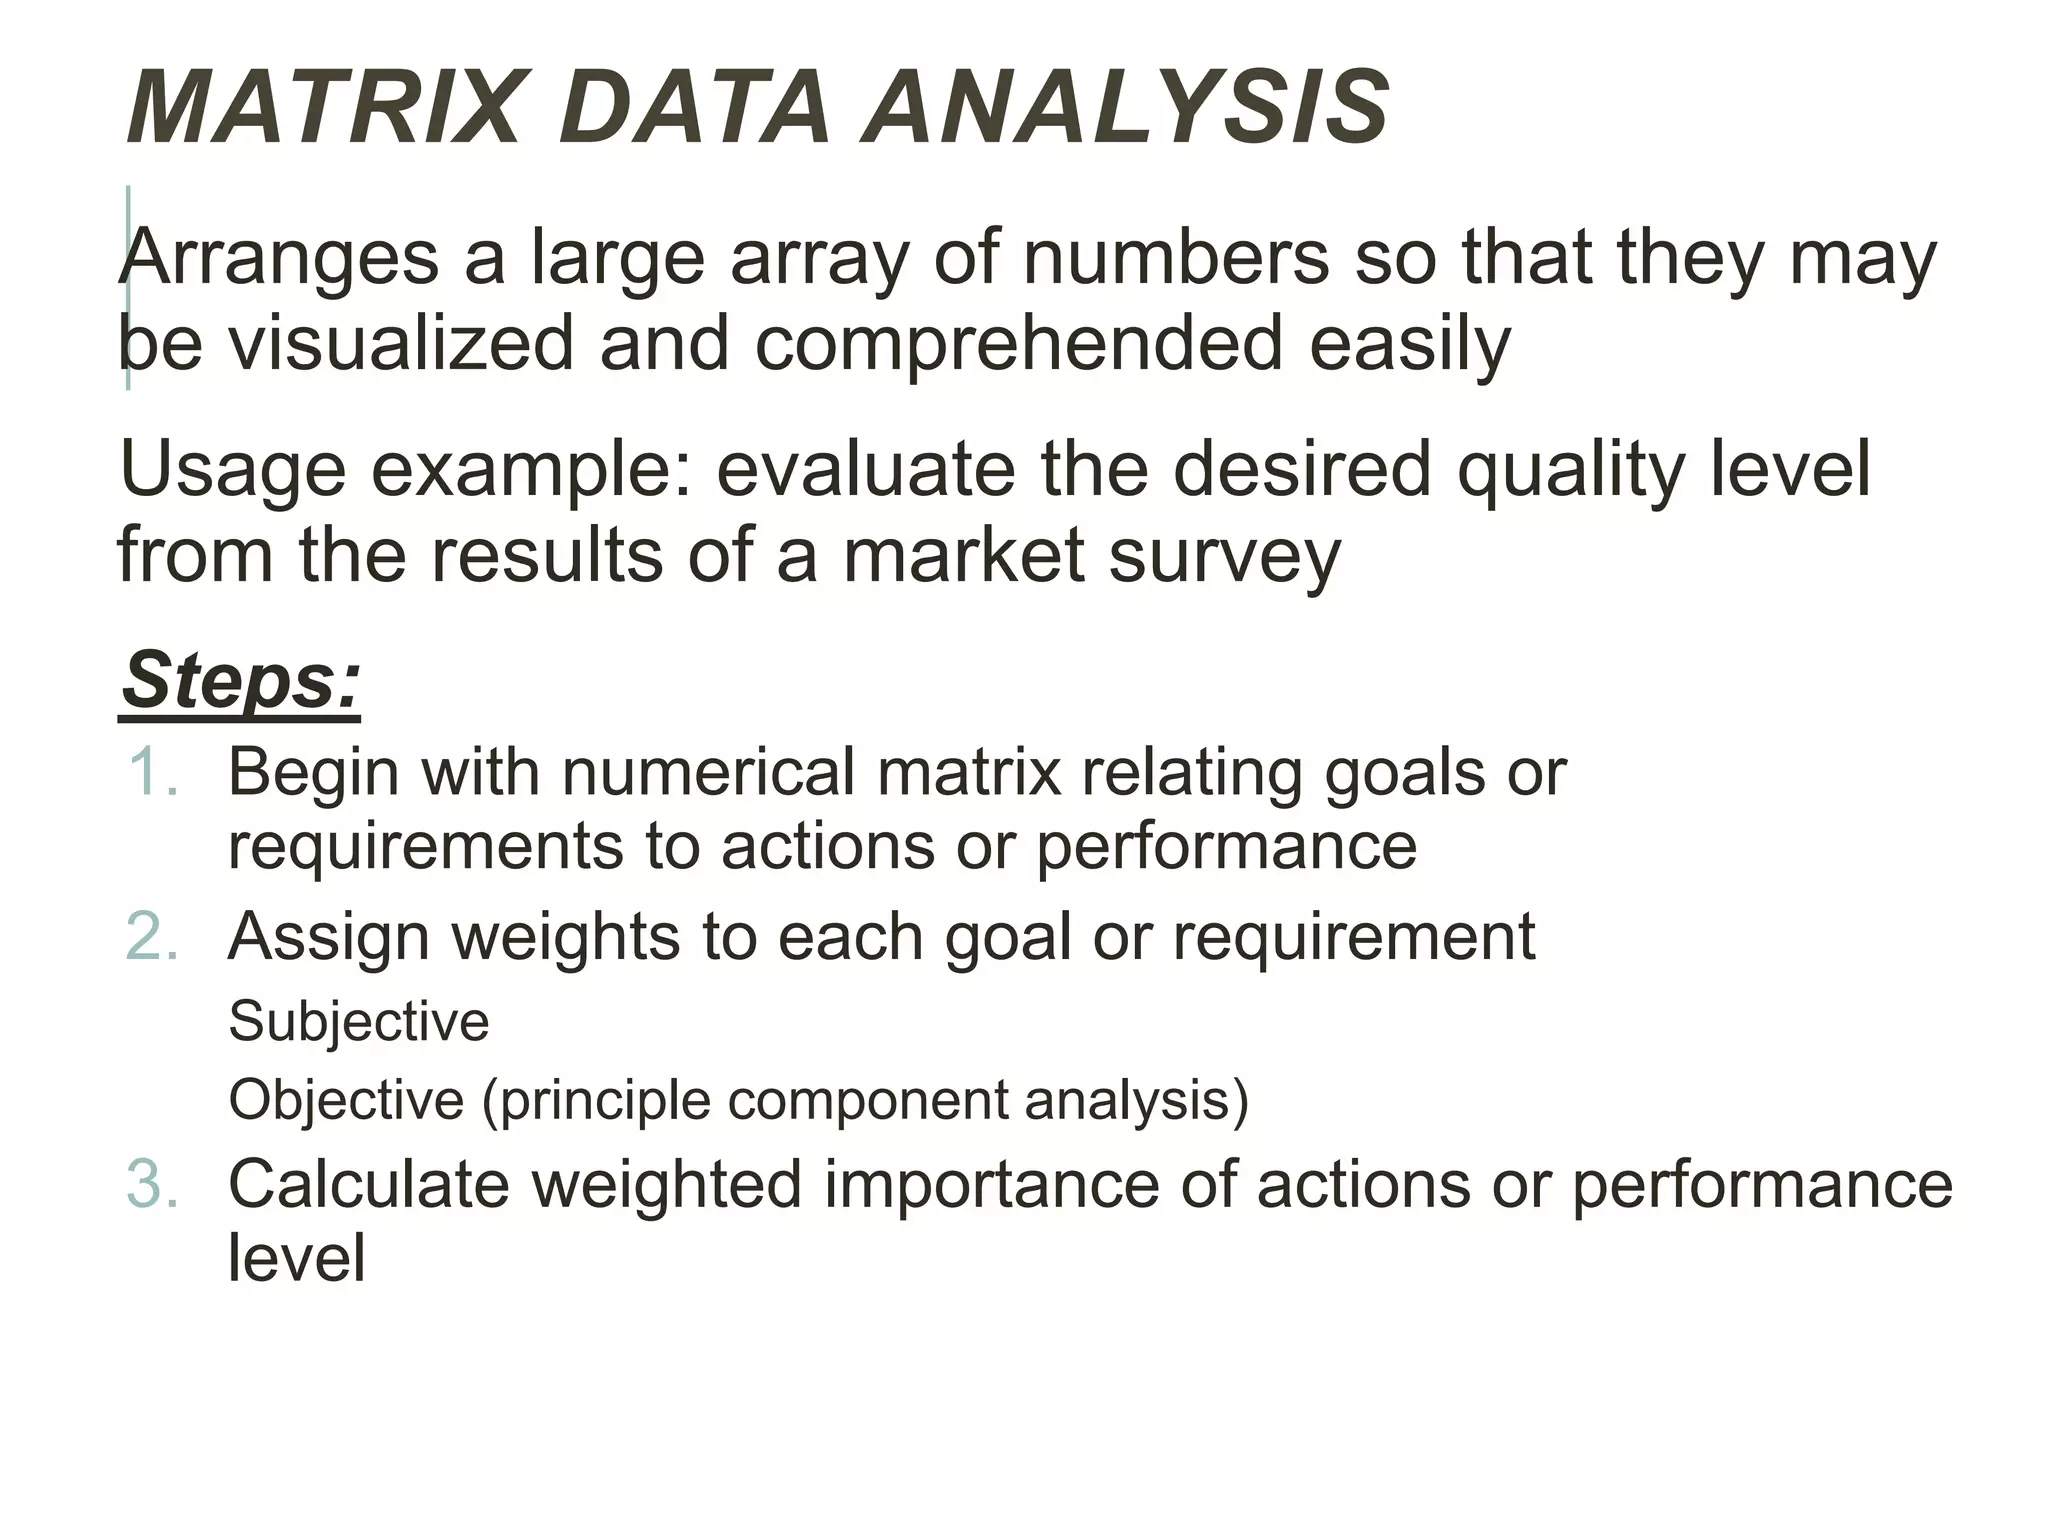
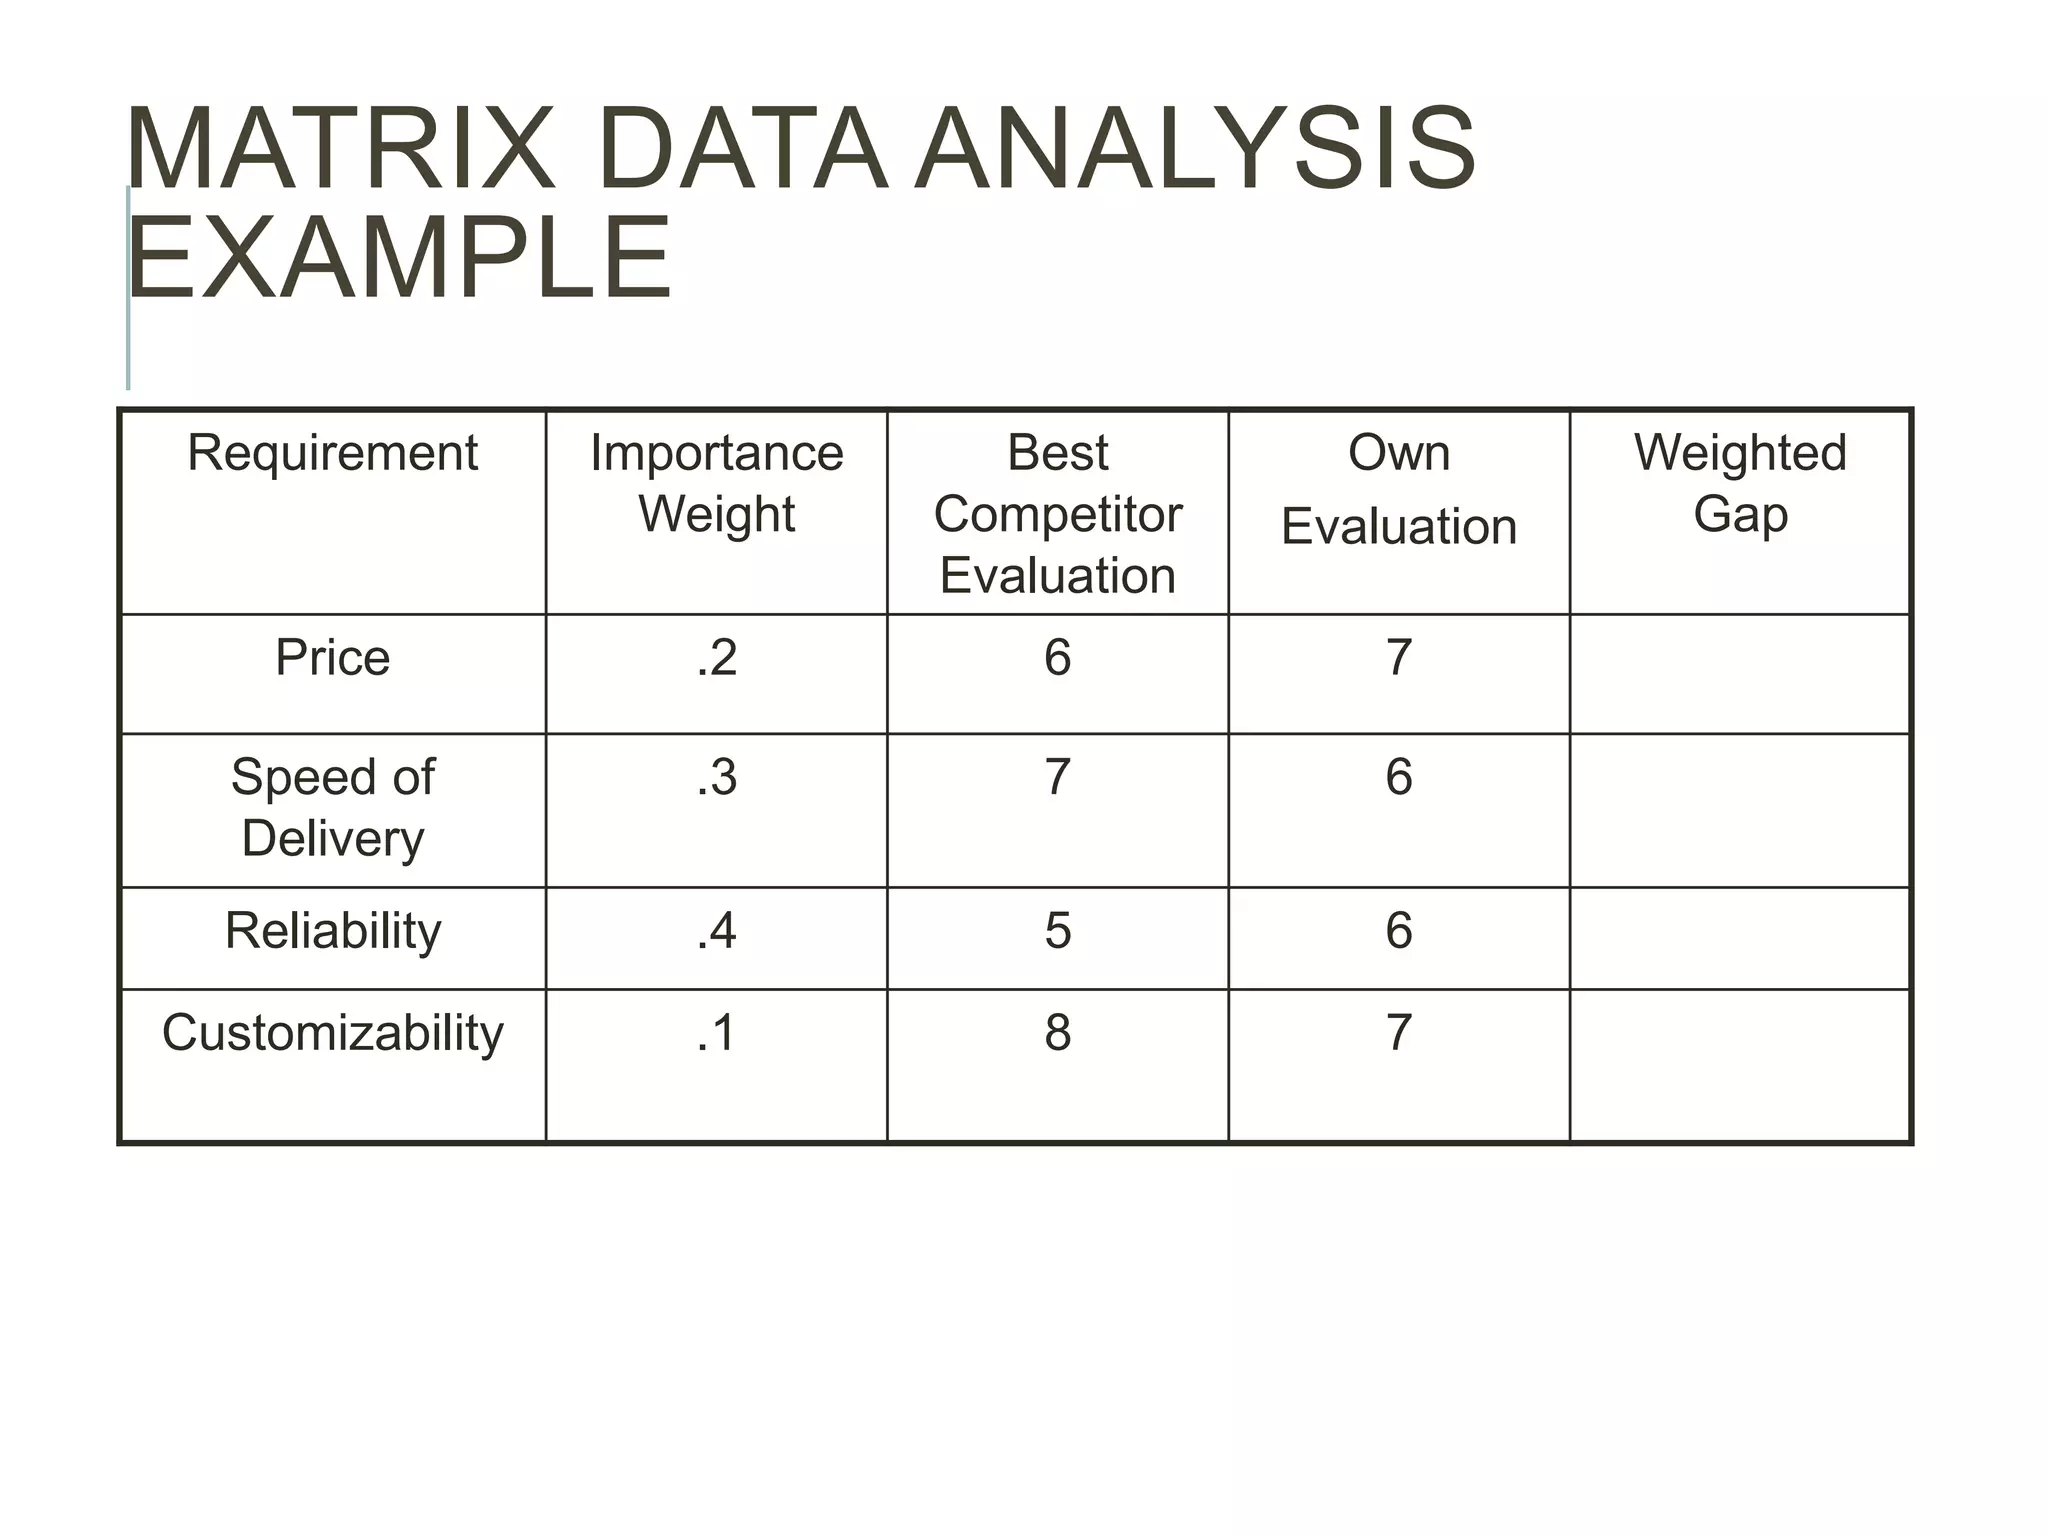
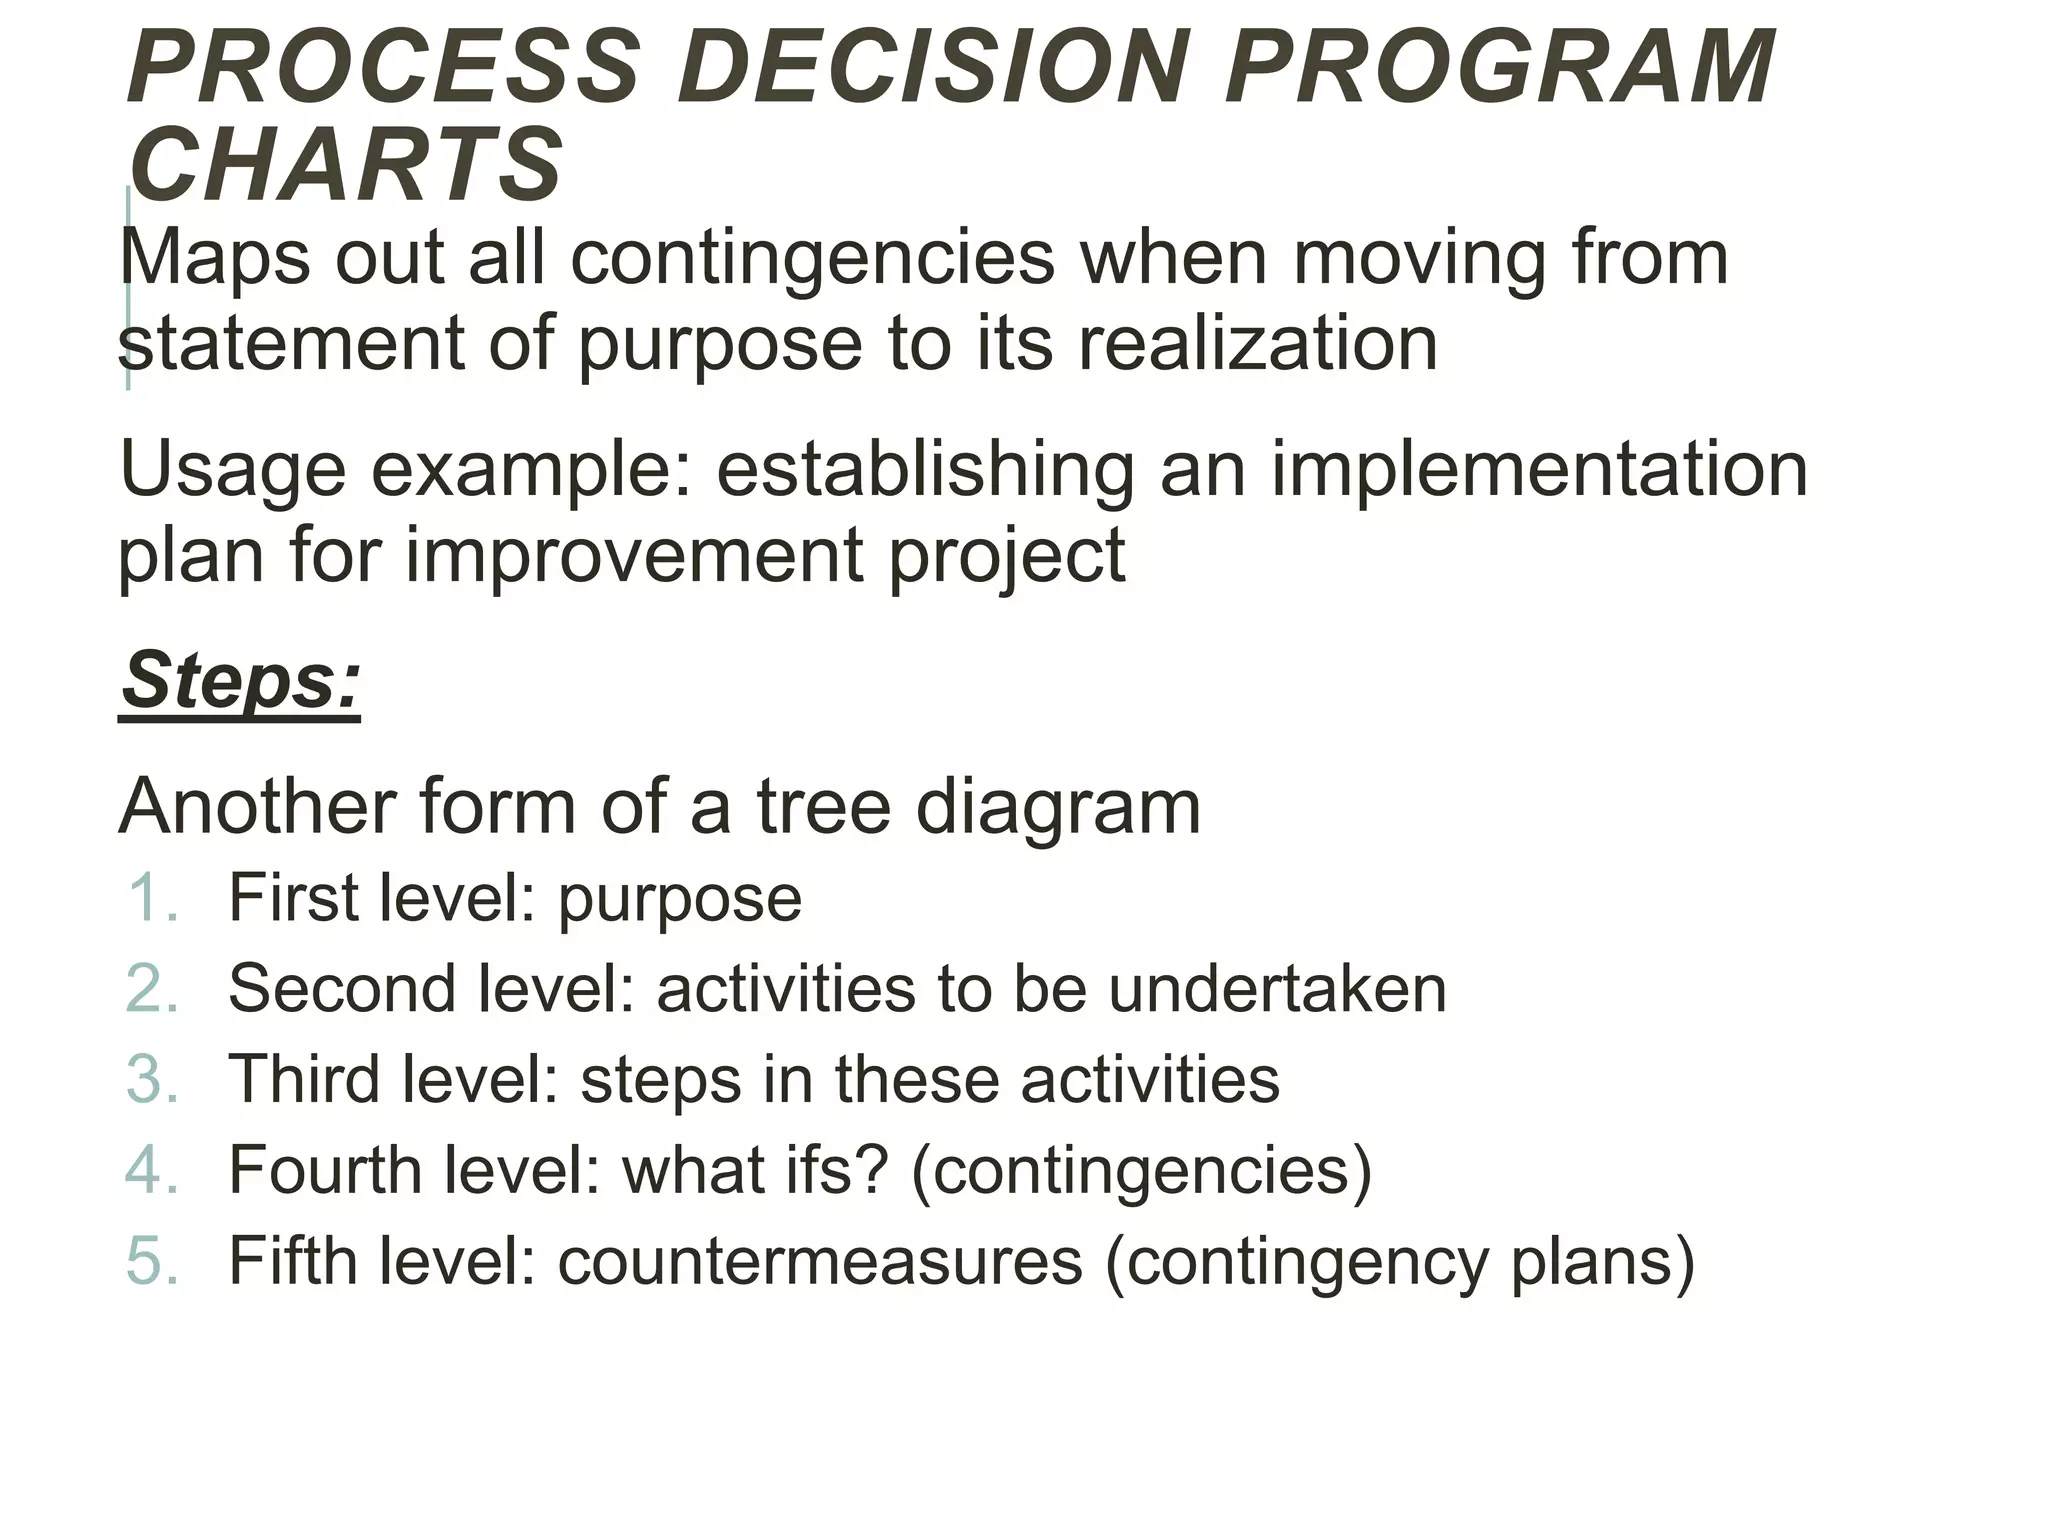
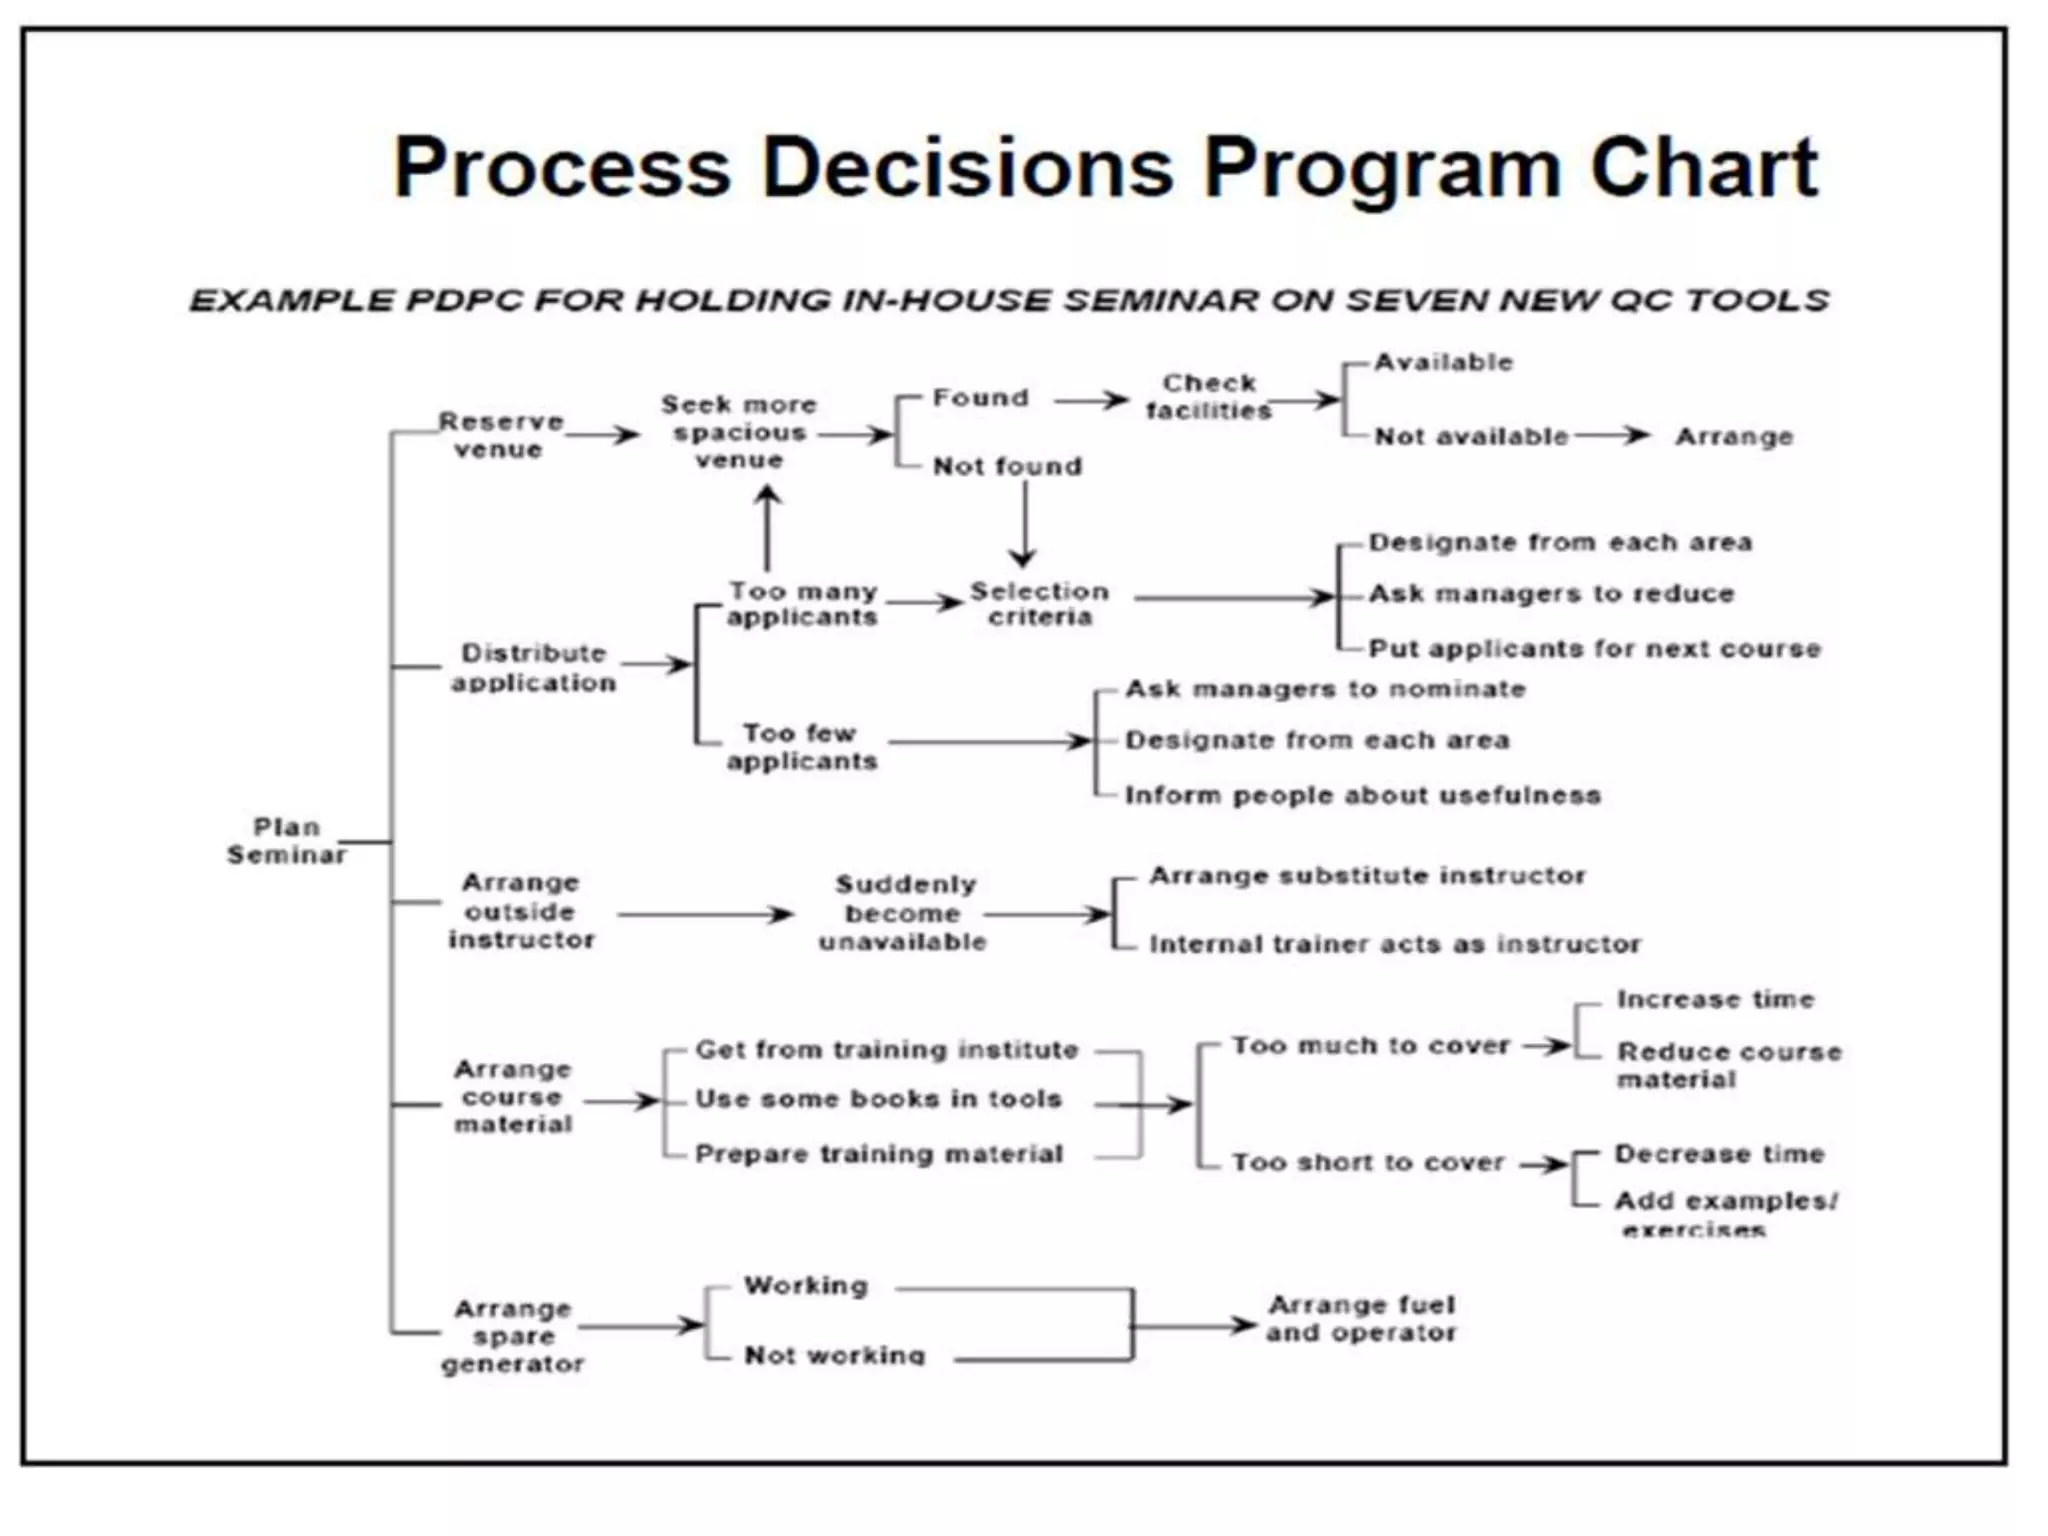
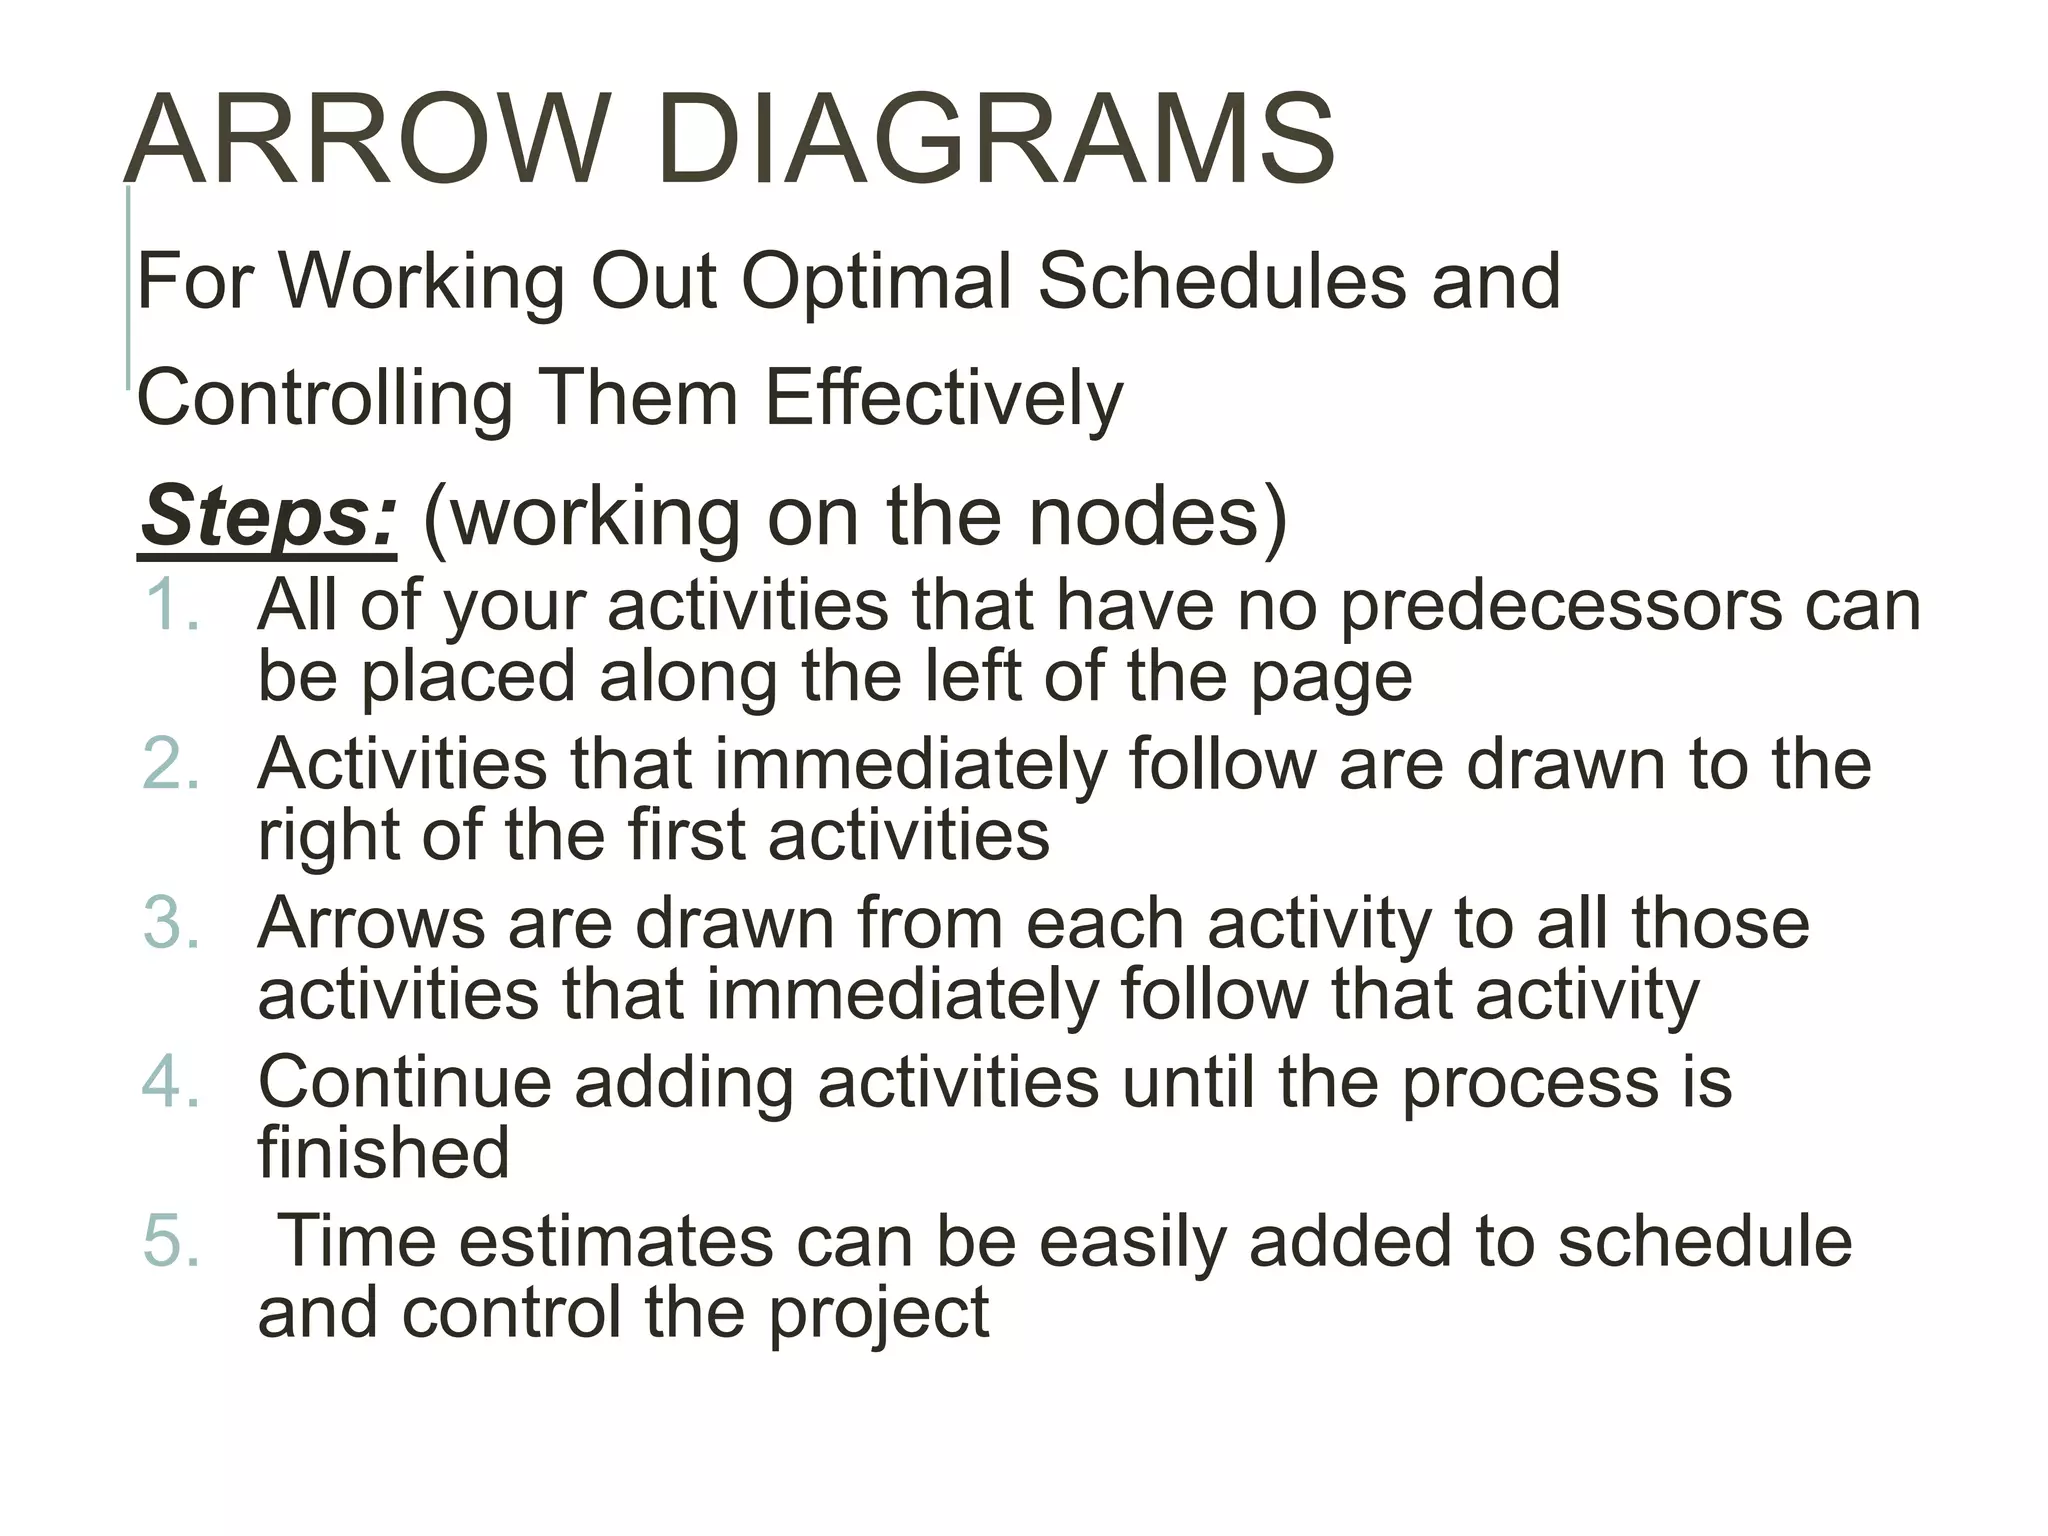
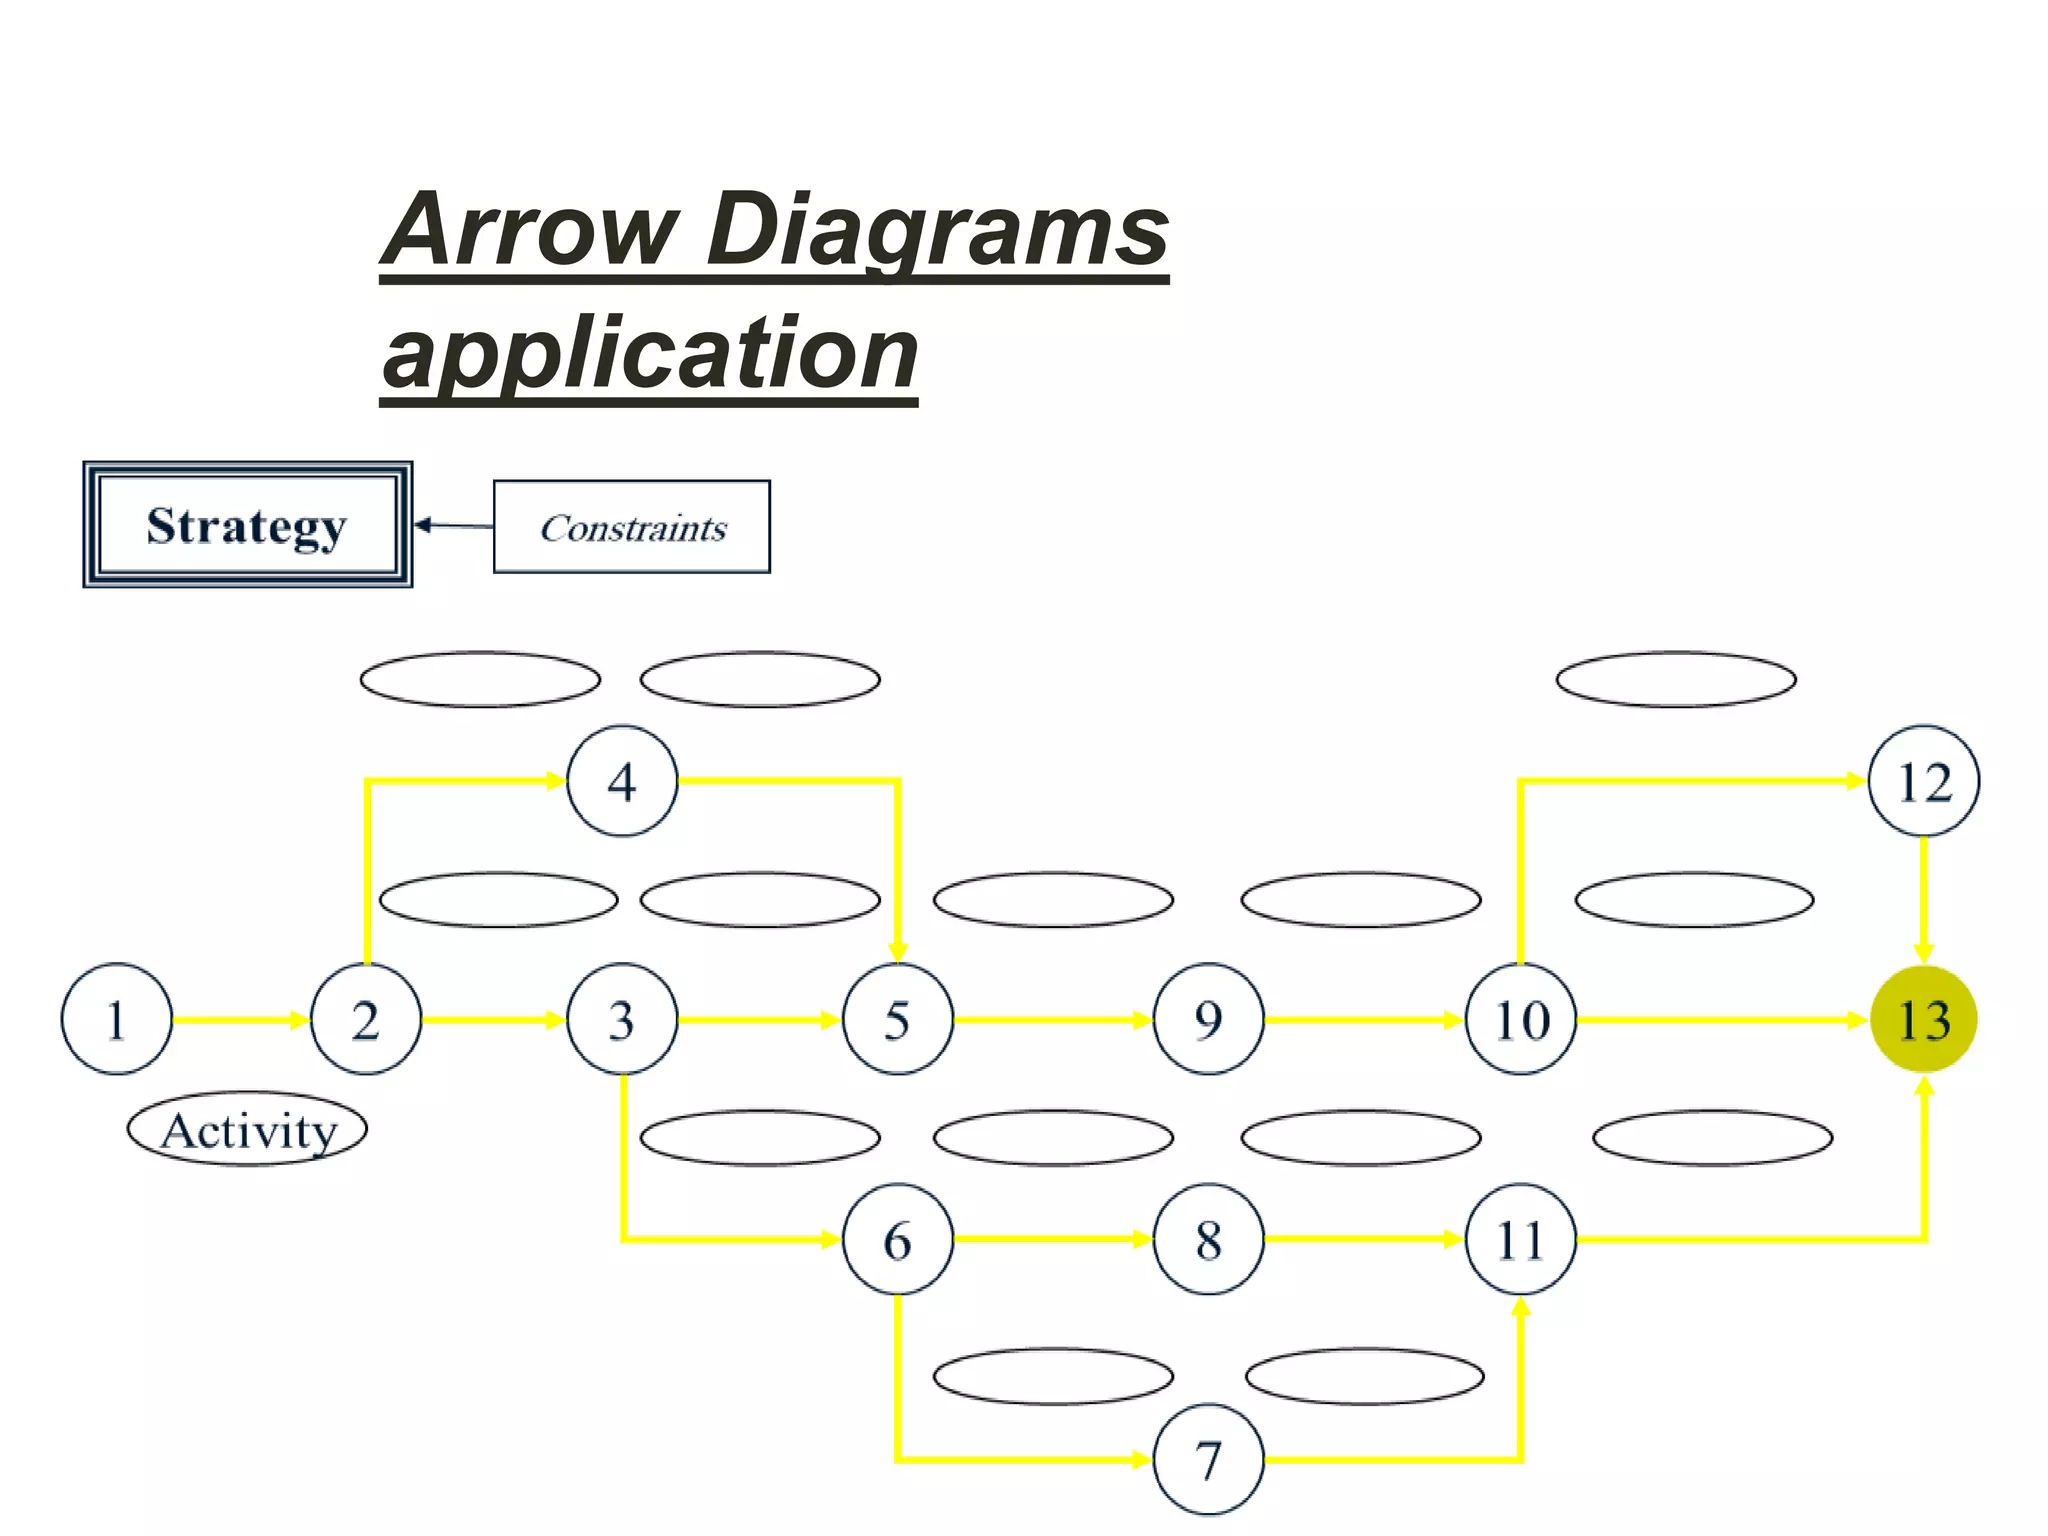
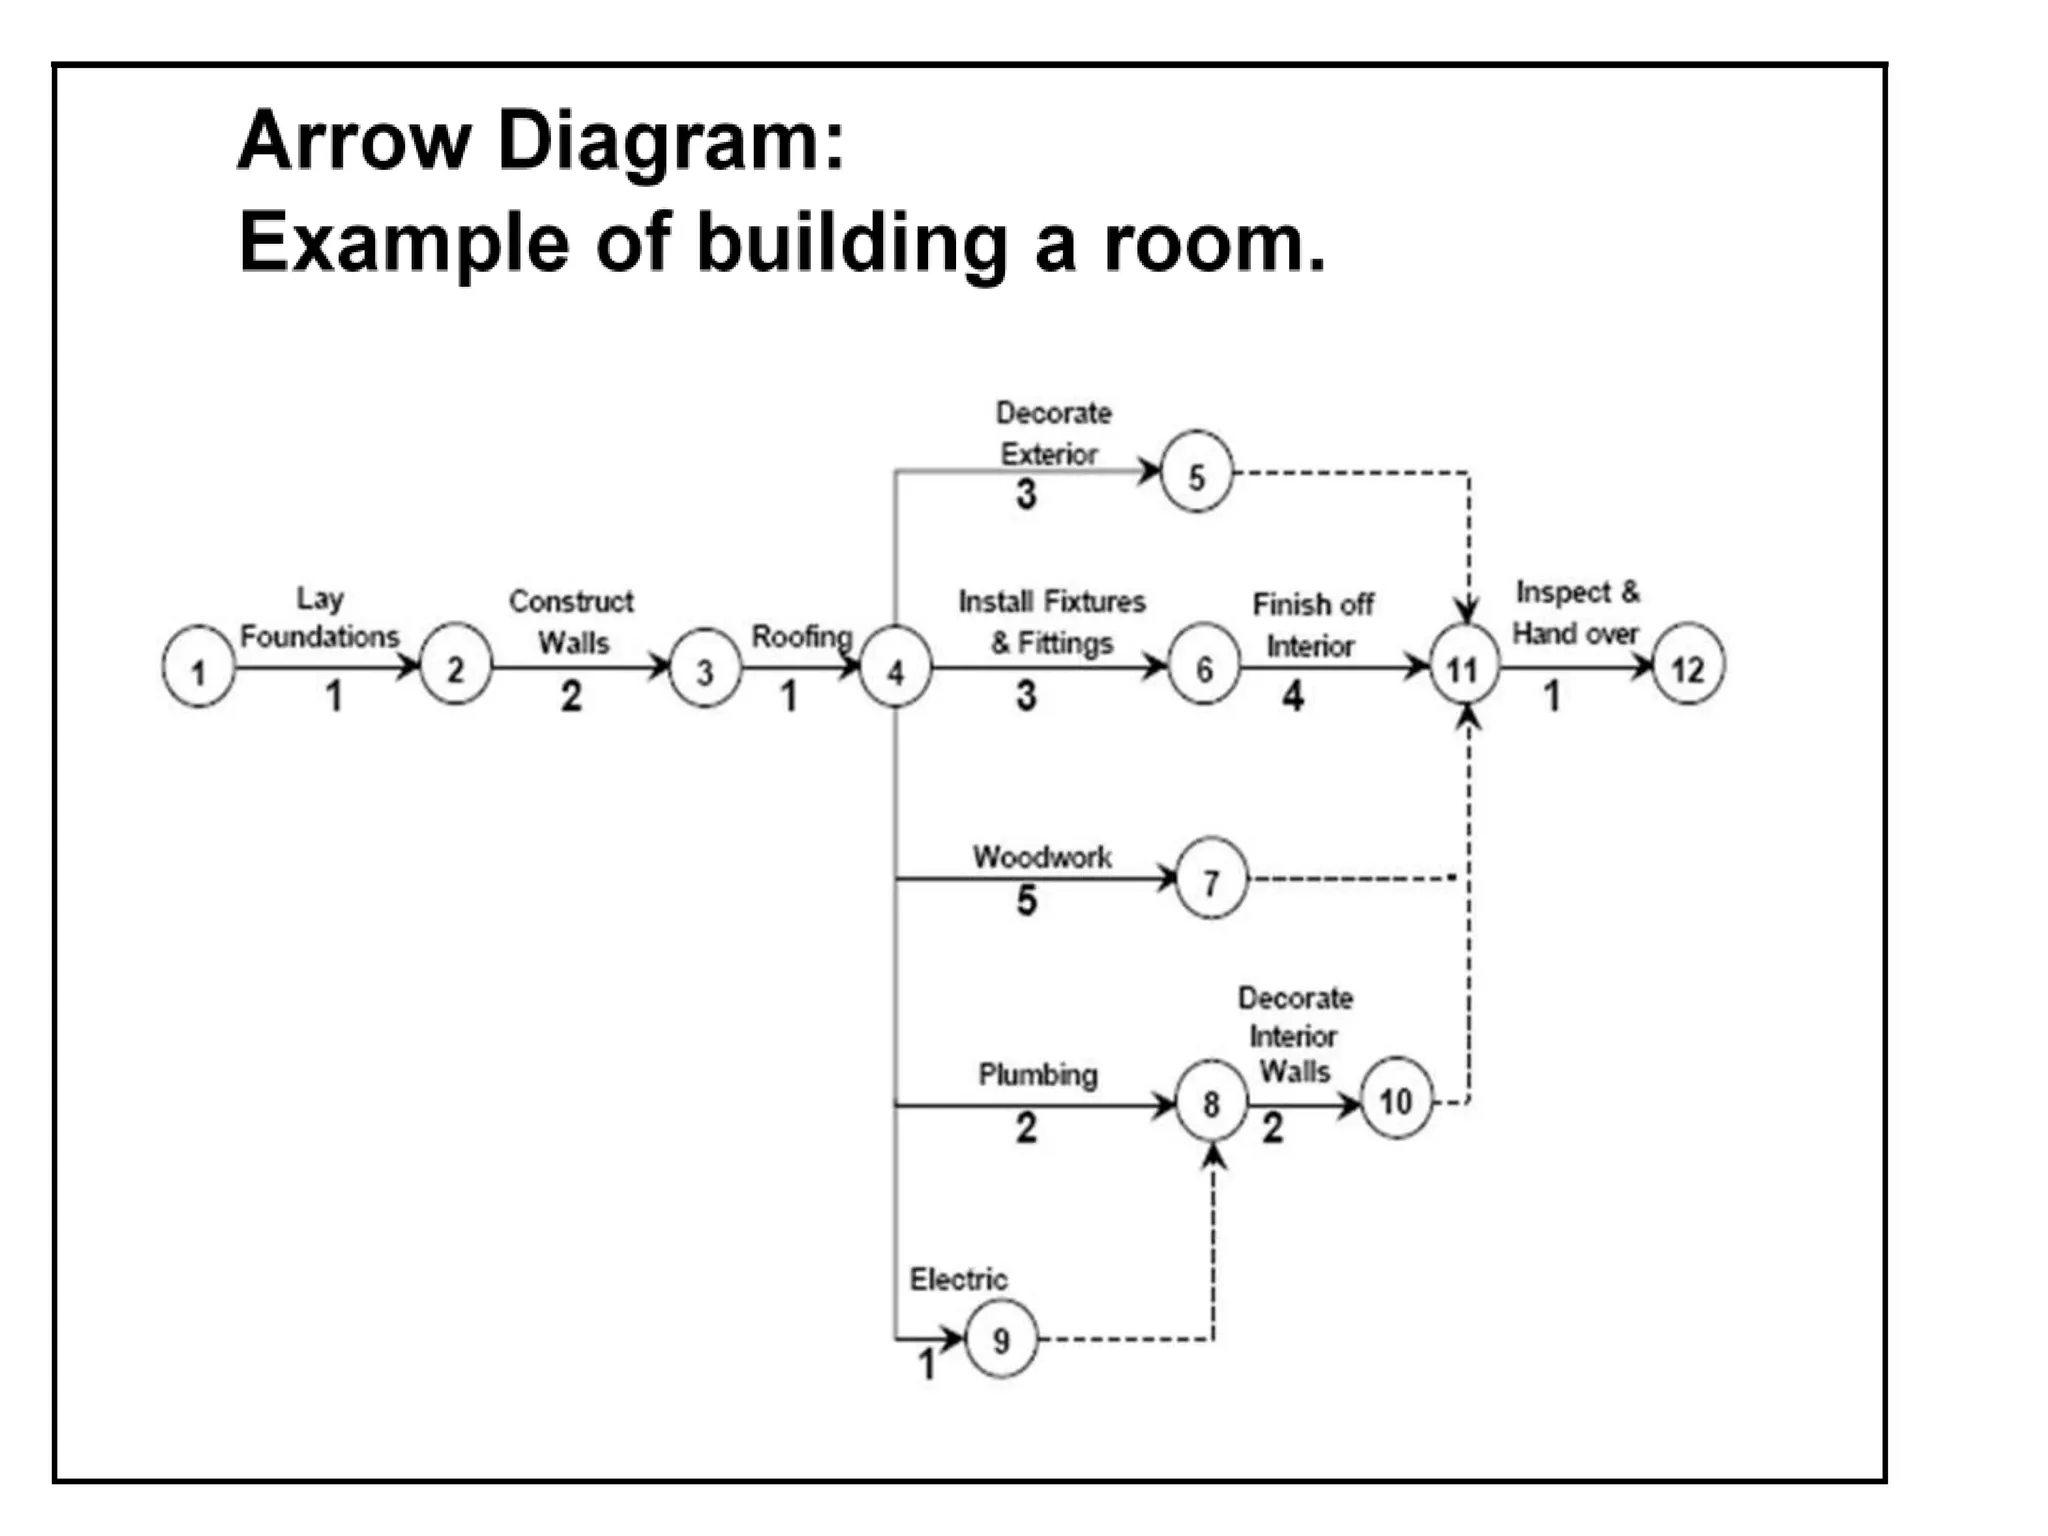
Usage of matrix data analysis in evaluating quality levels via numerical matrices and weighted evaluations.Explains the use of process decision program charts to map out steps and contingencies in project planning.Instructions for creating arrow diagrams to optimize scheduling and control project activities effectively.
A closing slide signaling the end of the presentation.
THE SEVEN NEW
QUALITYTOOLS
1. Affinity Diagrams
2. Interrelationship Diagrams
3. Tree Diagrams
4. Matrix Diagrams
5. Matrix Data Analysis
6. Process Decision Program Charts
7. Arrow Diagrams
3.
IMPORTANCE OF ADVANCED
QUALITYTOOLS
• Organize verbal order
• Generate ideas
• Improve planning
• Eliminate errors and omissions
• Explain problems intelligibly
• Secure full cooperation
• Assess situation from various angles
4.
• Clarify thedesired
situation
• Prioritize tasks effectively
• Proceed systematically
• Anticipate future events
• Change proactively
• Get things right the first
time
5.
RELATIONS TO “OLD”
TOOLS
Similarities:
Bothare graphics rather than language
based
Whole first, then elements analyzed
Universal understanding (pictures)
Differences:
New tools are more relational and network
oriented
New tools may take more practice to
develop proficiency
They can and should be used
together
6.
AFFINITY DIAGRAMS
Organizes alarge amount of verbal data related to a
broad problem or subject
Ideas, opinions, facts
Usage example: Establishing a new QC policy
Steps:
1.Select a topic
2.Gather a large number of ideas.
3.Put individual ideas on cards or sticky notes.
4.As a team, group the ideas are collected
according to natural “affinity” or relationship to
each other.
5.These natural groups become “strategic
INTERRELATIONSHIP
DIAGRAMS
Identifies and explorescausal
relationships among related concepts
or ideas. Can address problems with a
complex network of causes and effects.
STEPS
1. Express the problem in form of “Why isn’t
something happening?”
2. Each member lists 5 causes affecting
problem
3. Write each item on a card
4. Discuss info collected until everyone
10.
Interrelationship Diagrams
Cont.5.Move cardsinto similar groups
6.Asking why, explore the cause-effect
relationships, and divide the cards into
primary, secondary and tertiary causes
7.Connect all cards by these
relationships8.Further discuss until all possible
causes have been identified
TREE DIAGRAMS (CONT.)
Steps:
1.Write Relations Diagram topic (Objective
card)
2. Identify constraints on how objective can
be achieved
3. Discuss means of achieving objective
(primary means, first level strategy)
4. Take each primary mean, write objective
Expands a purpose into the tasks
required to accomplish it.
15.
5.Continue to expandto the fourth level
6.Review each system of means in both
directions (from objective to means and
means to objective)
7.Connect all levels
MATRIX DIAGRAMS
S.M.A.R.T. PlanMatrices
Technique for structuring the task
details when planning the
implementation of a project.
For each implementable task:
Specific (activity or task)
Measurable (outcome or process)
Assignment (who will perform)
Resources (what is needed)
Time (anticipated duration)
19.
MATRIX DATA ANALYSIS
Arrangesa large array of numbers so that they may
be visualized and comprehended easily
Usage example: evaluate the desired quality level
from the results of a market survey
Steps:
1. Begin with numerical matrix relating goals or
requirements to actions or performance
2. Assign weights to each goal or requirement
Subjective
Objective (principle component analysis)
3. Calculate weighted importance of actions or performance
level
20.
MATRIX DATA ANALYSIS
EXAMPLE
RequirementImportance
Weight
Best
Competitor
Evaluation
Own
Evaluation
Weighted
Gap
Price .2 6 7
Speed of
Delivery
.3 7 6
Reliability .4 5 6
Customizability .1 8 7
21.
PROCESS DECISION PROGRAM
CHARTS
Mapsout all contingencies when moving from
statement of purpose to its realization
Usage example: establishing an implementation
plan for improvement project
Steps:
Another form of a tree diagram
1. First level: purpose
2. Second level: activities to be undertaken
3. Third level: steps in these activities
4. Fourth level: what ifs? (contingencies)
5. Fifth level: countermeasures (contingency plans)
23.
ARROW DIAGRAMS
For WorkingOut Optimal Schedules and
Controlling Them Effectively
Steps: (working on the nodes)
1. All of your activities that have no predecessors can
be placed along the left of the page
2. Activities that immediately follow are drawn to the
right of the first activities
3. Arrows are drawn from each activity to all those
activities that immediately follow that activity
4. Continue adding activities until the process is
finished
5. Time estimates can be easily added to schedule
and control the project