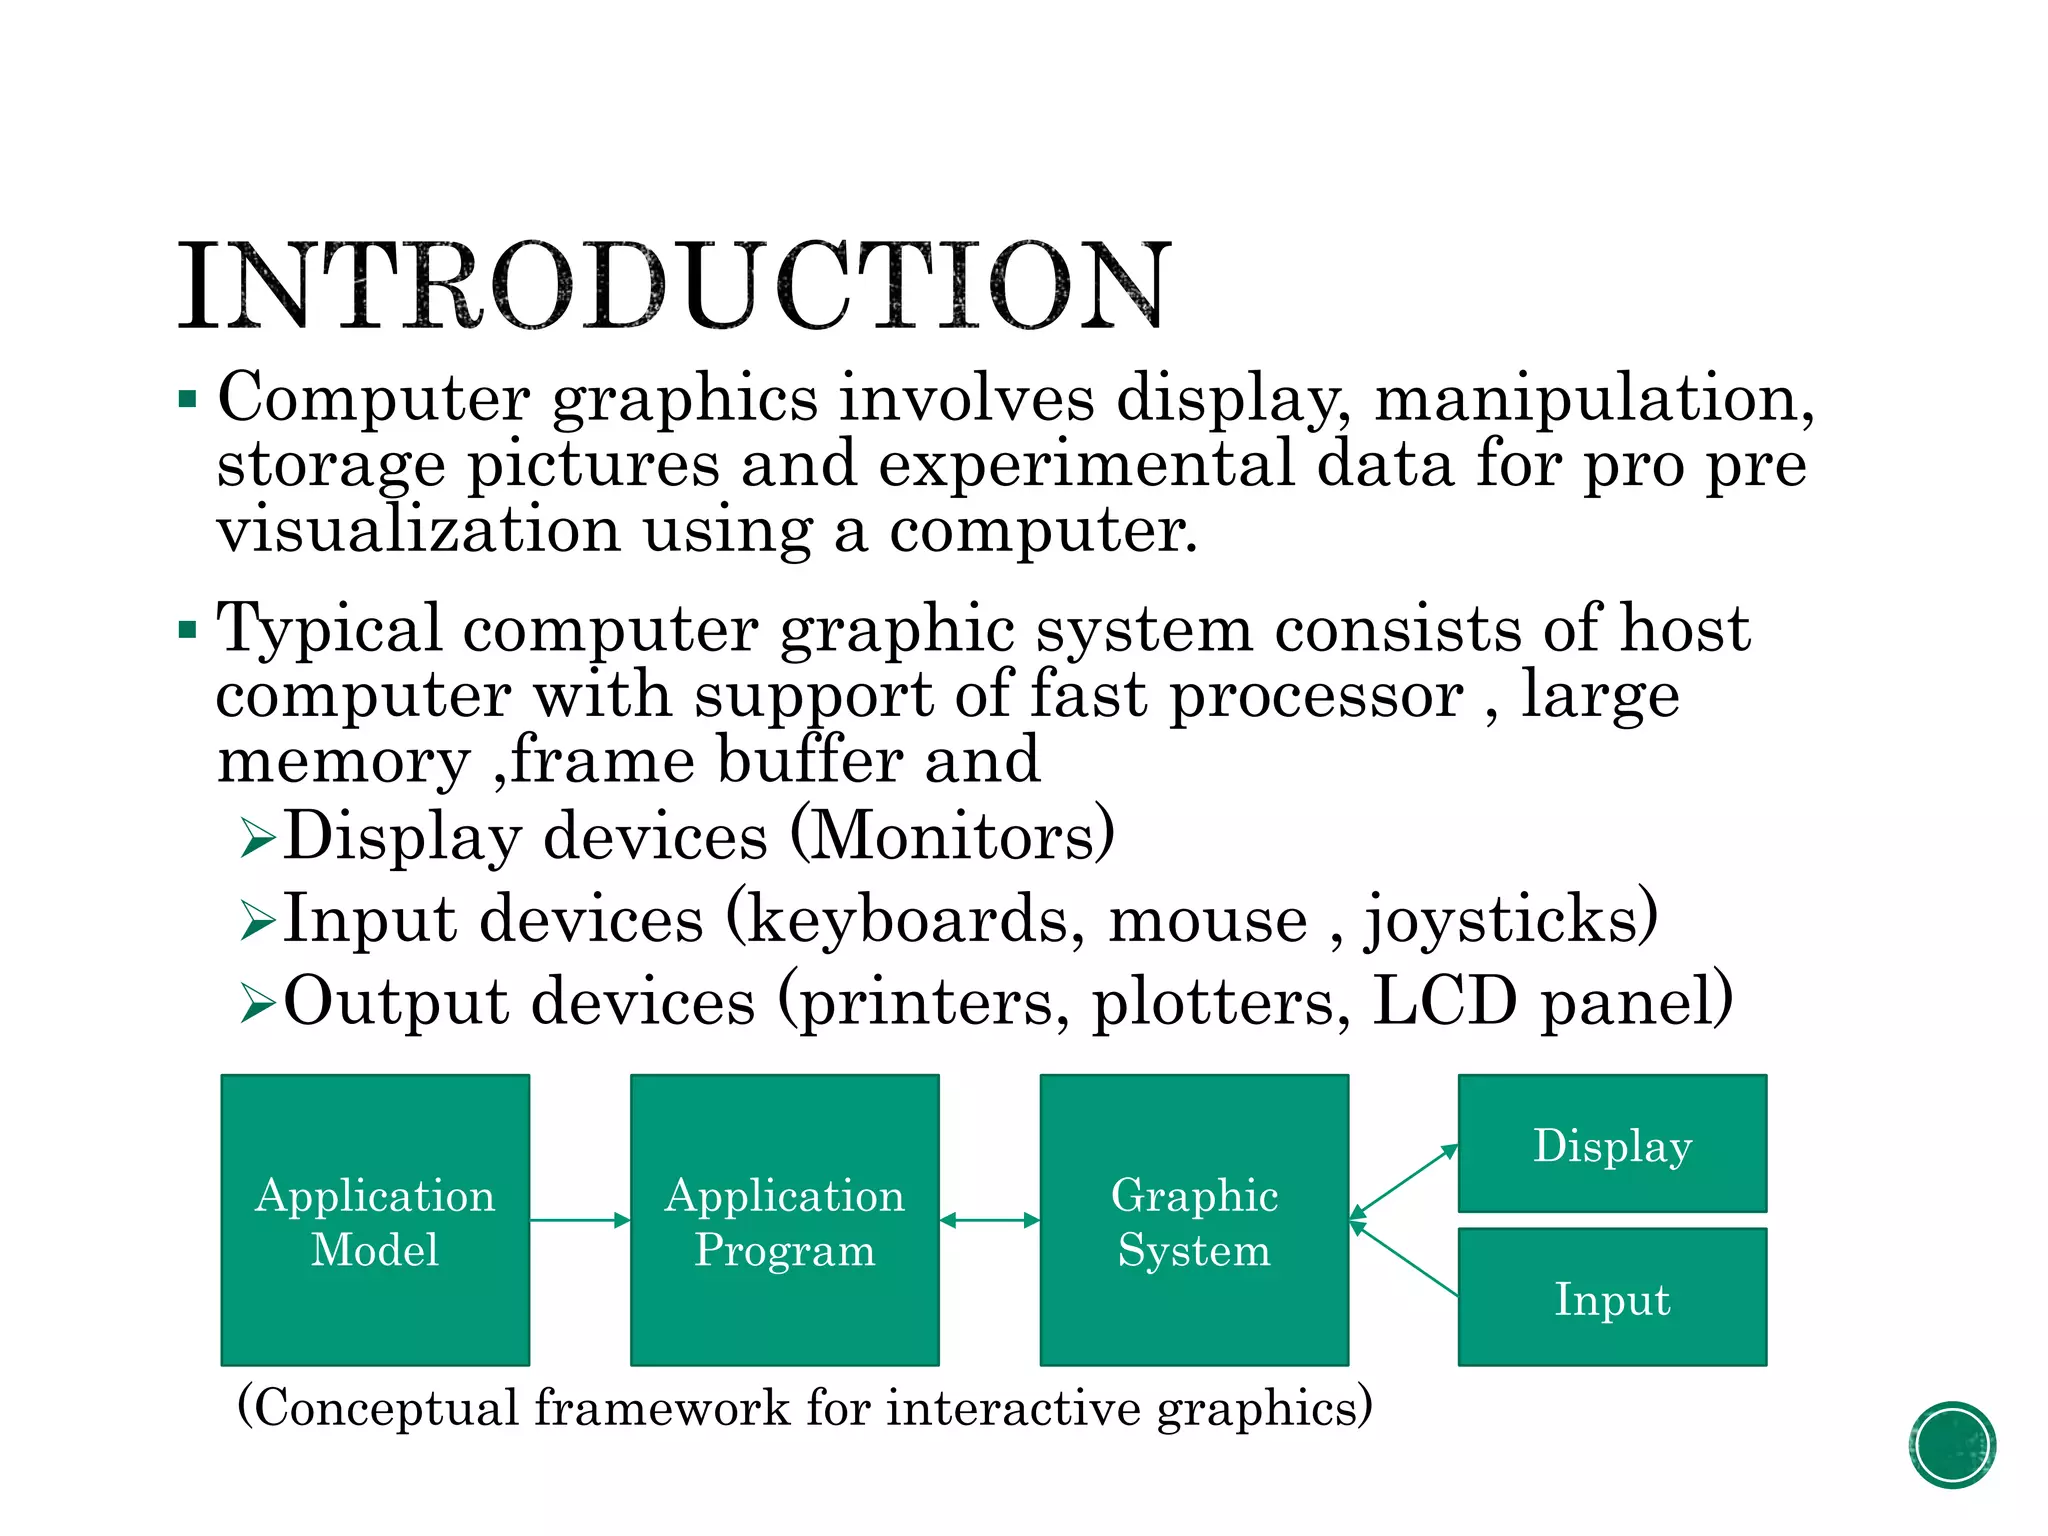
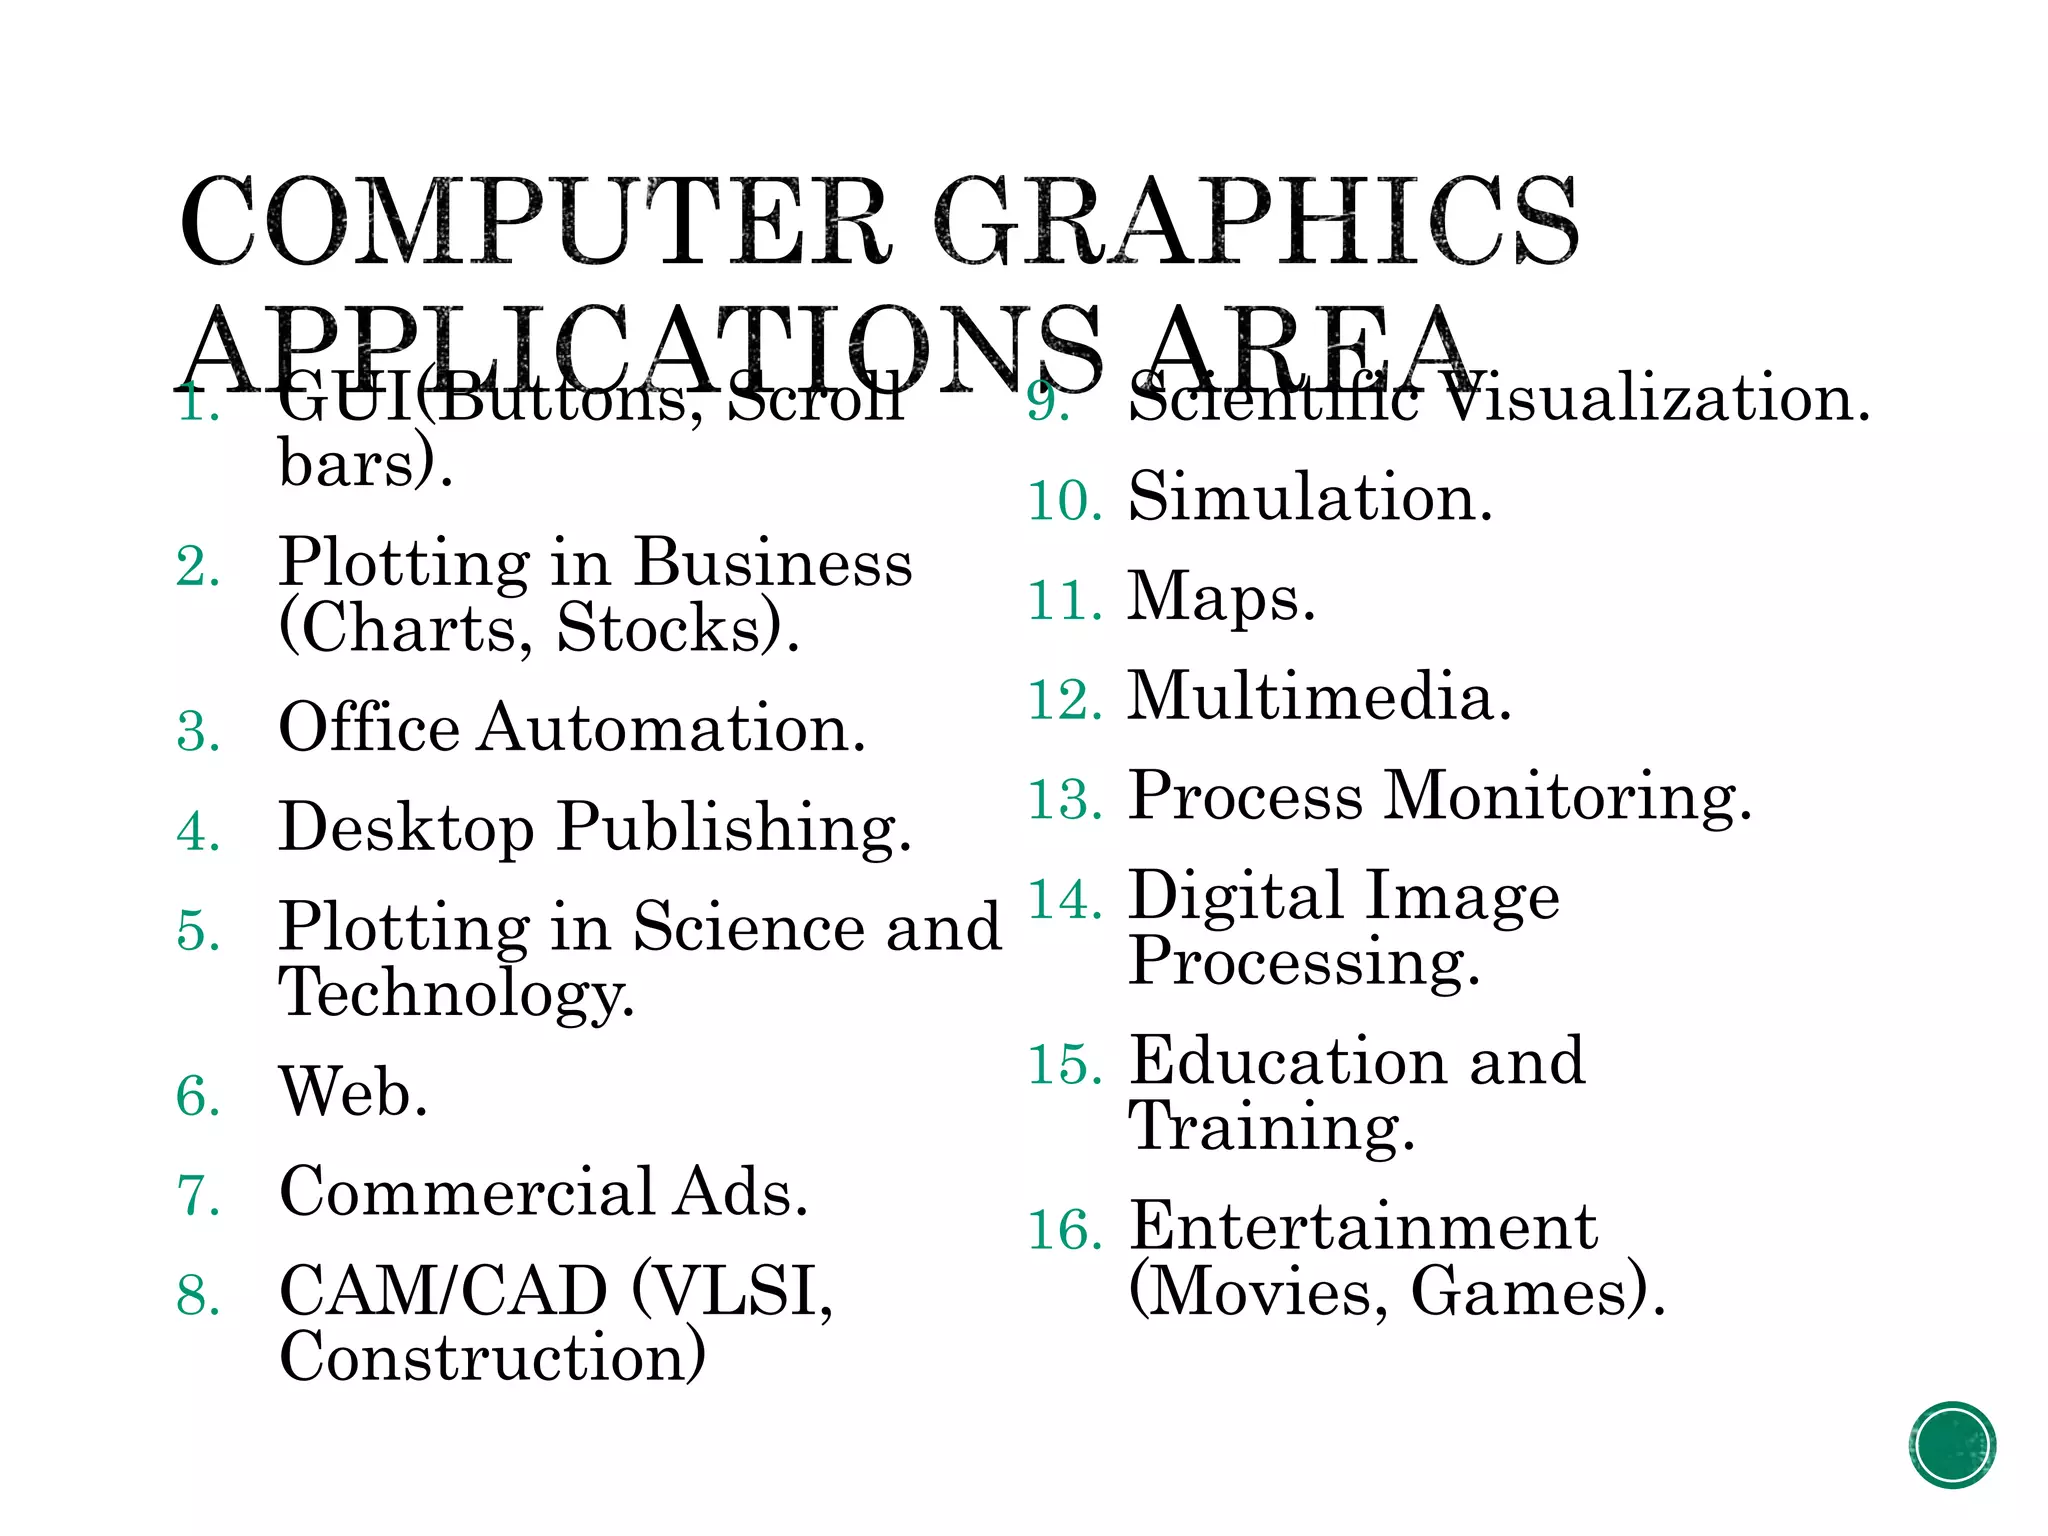
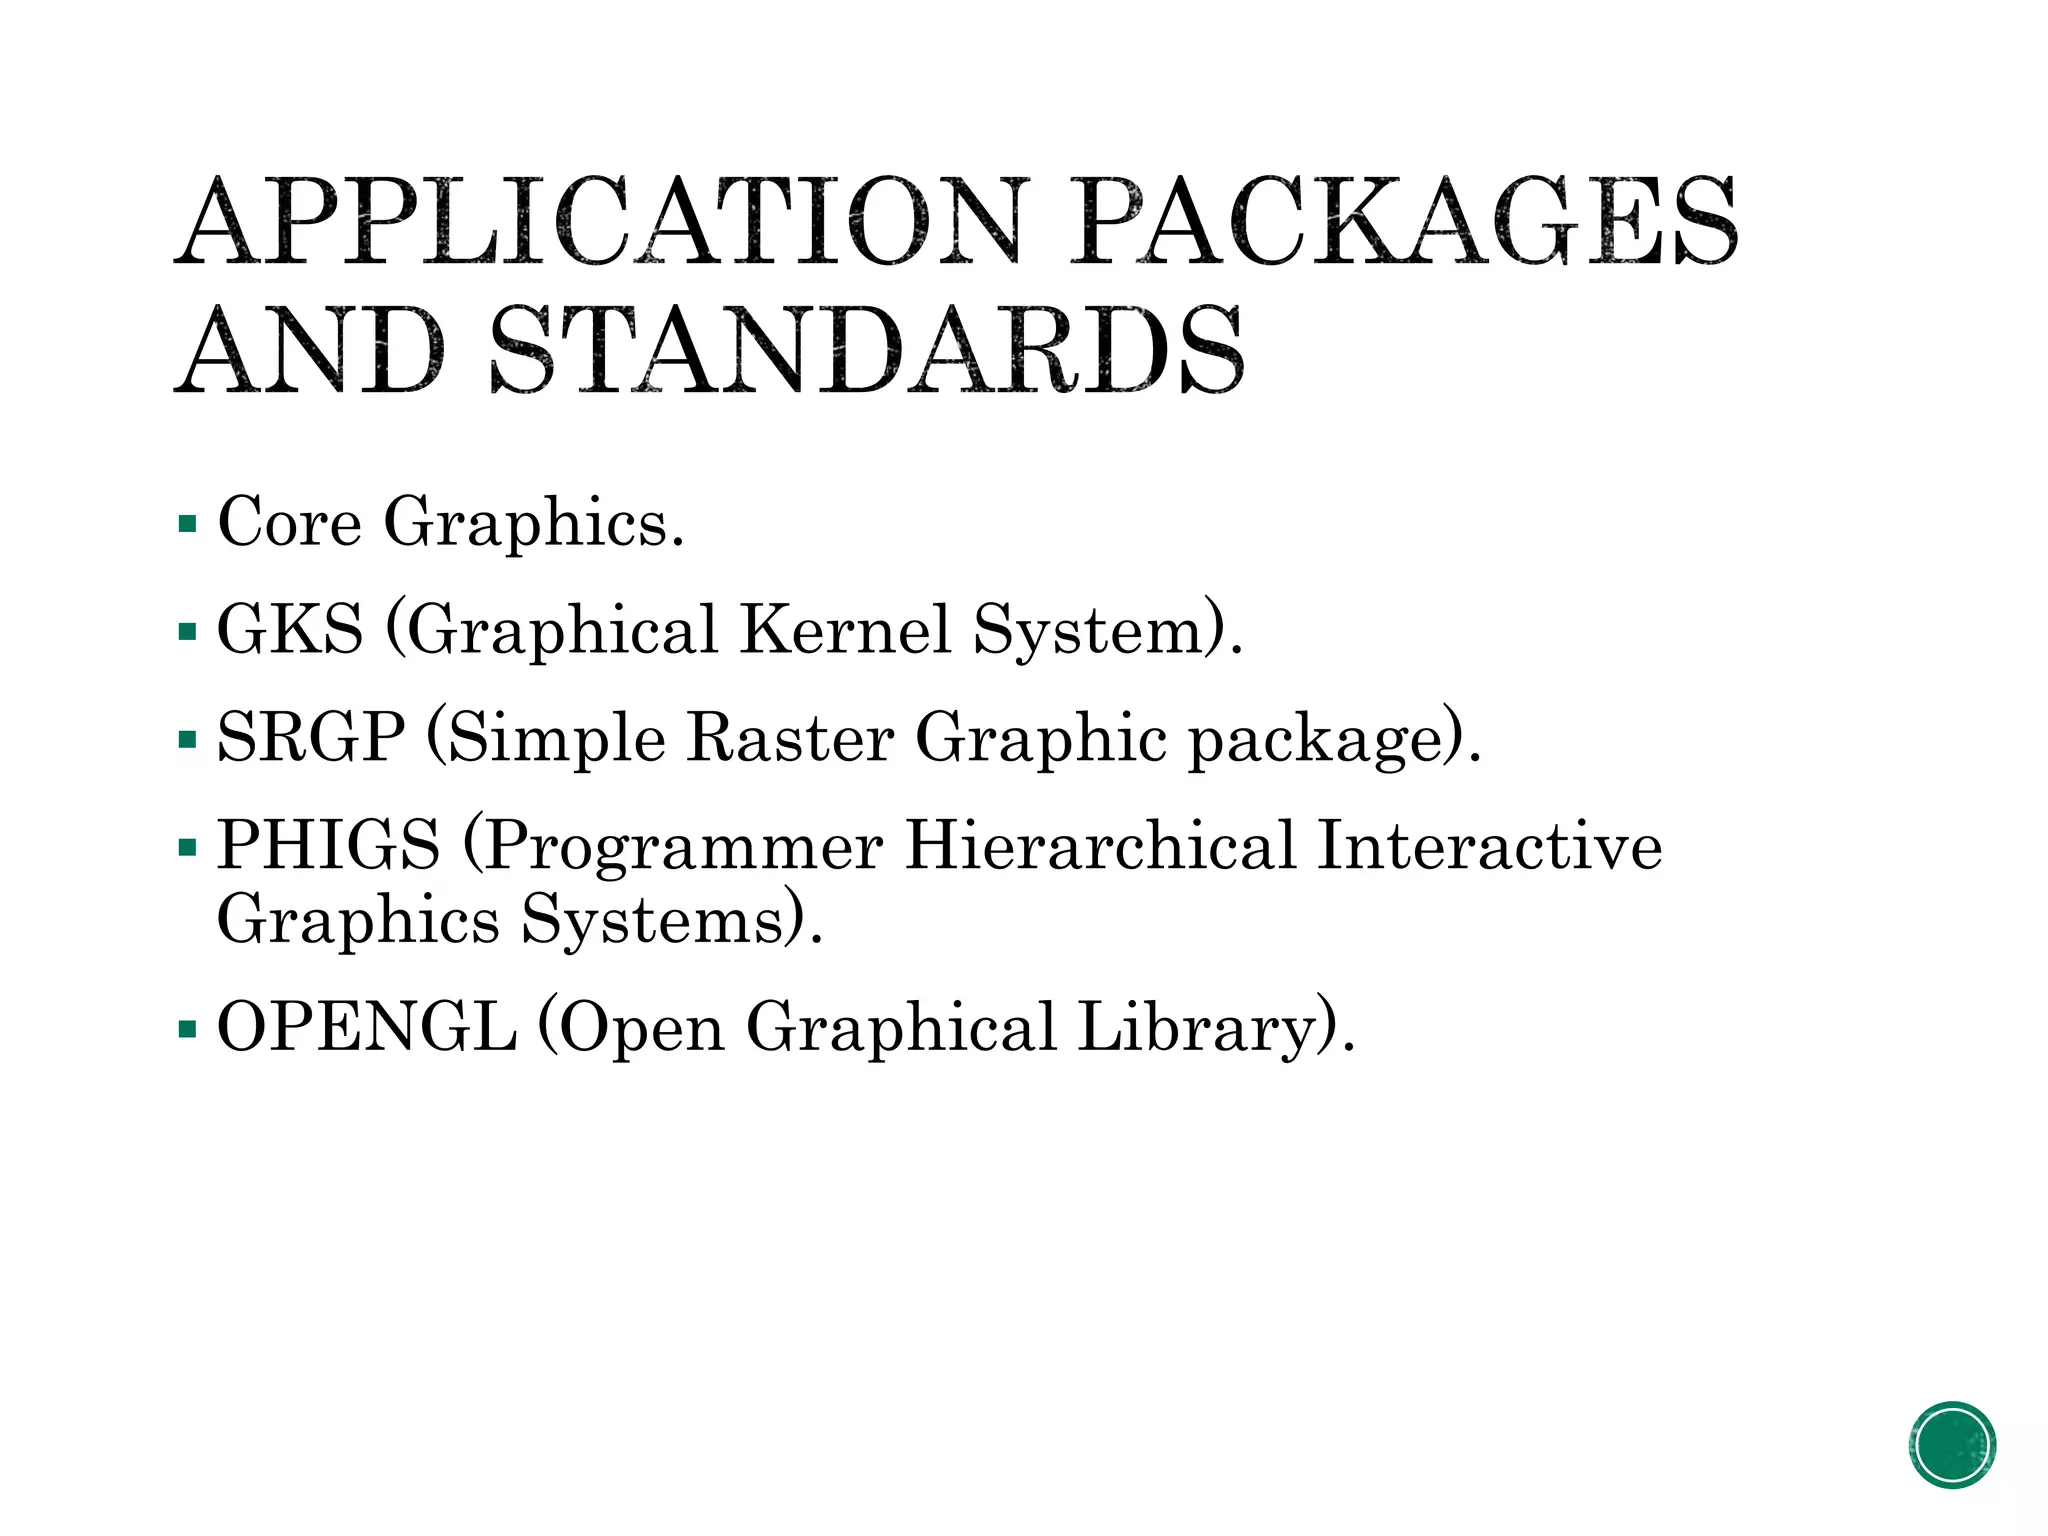
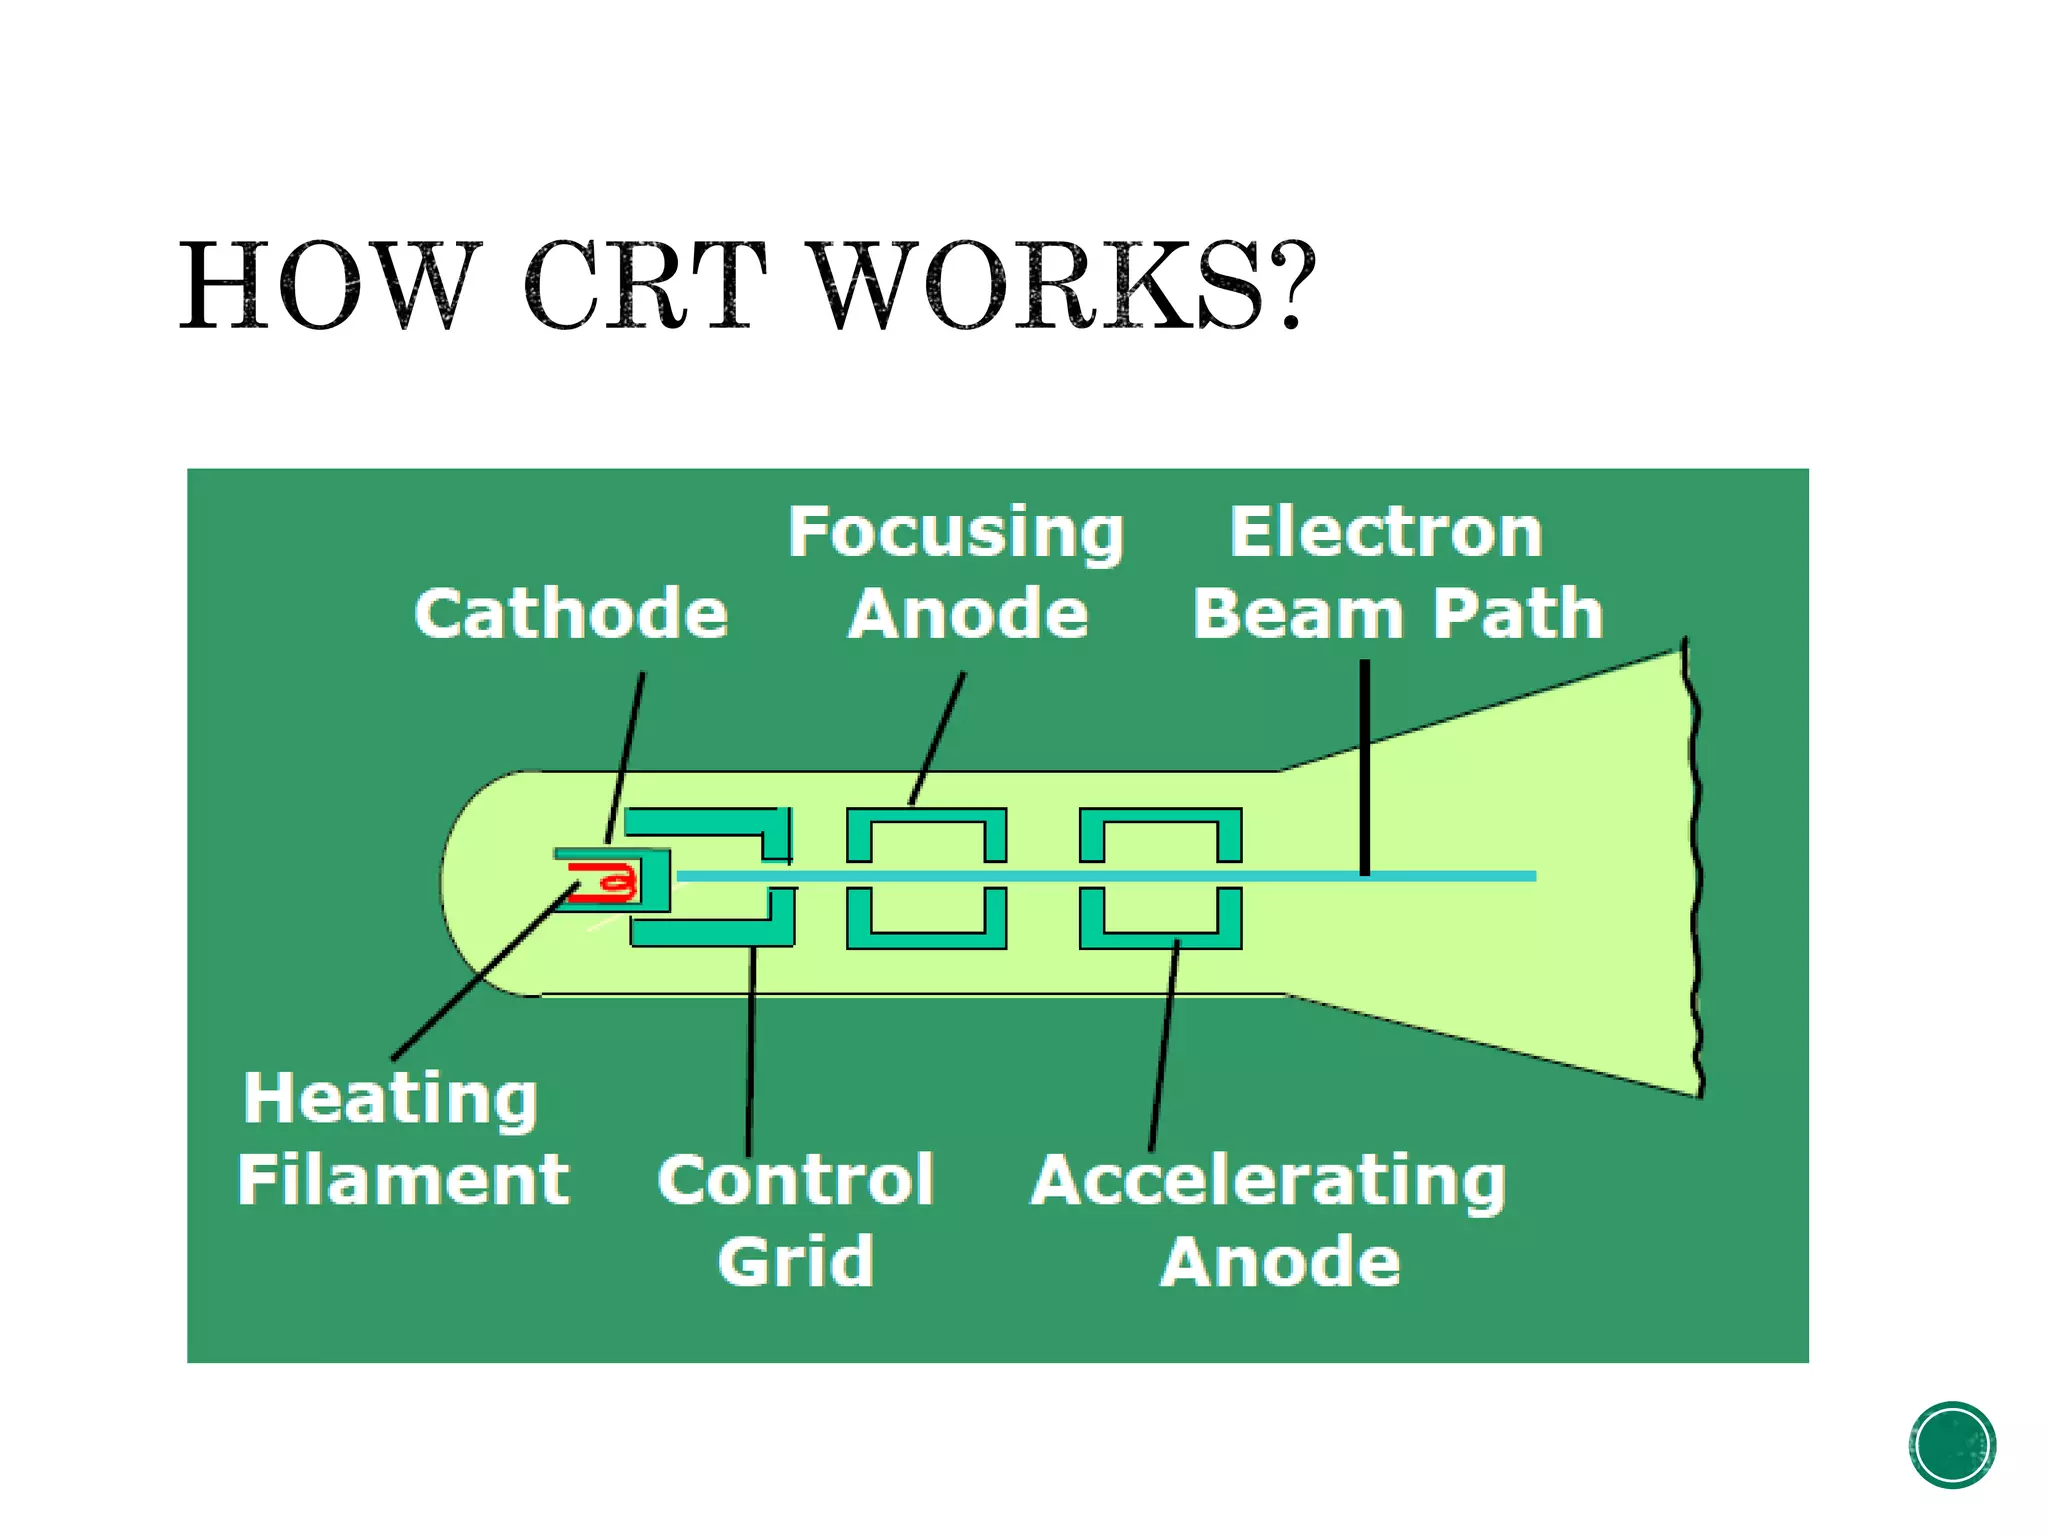
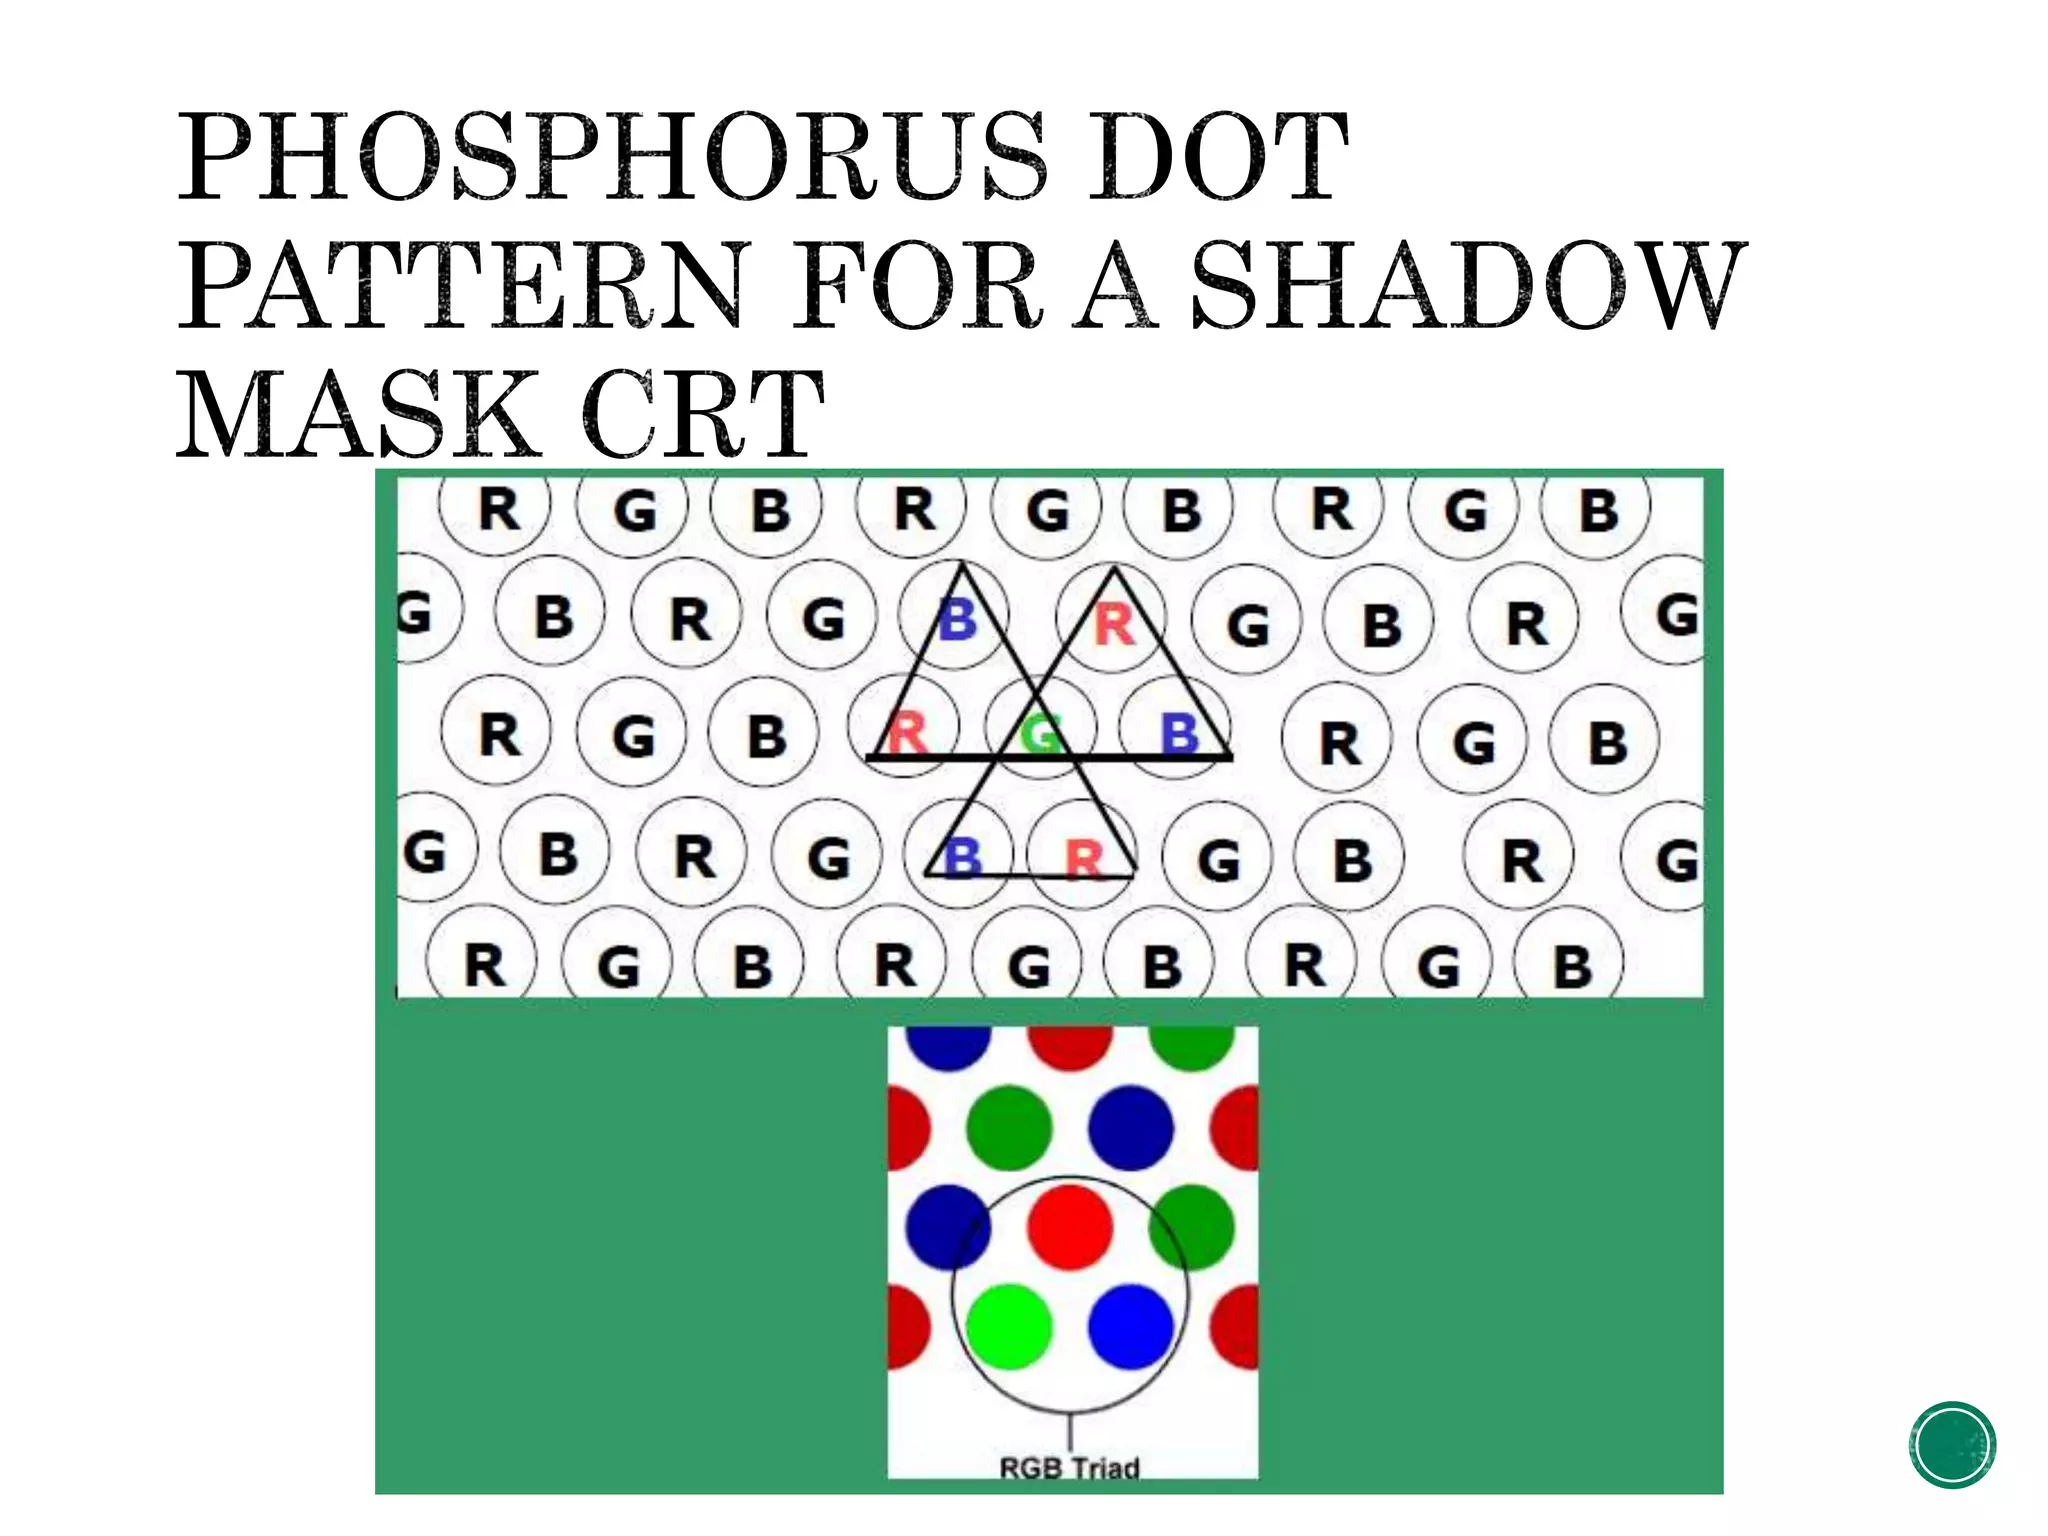
This document summarizes computer graphics and display devices. It discusses that computer graphics involves displaying and manipulating images and data using a computer. A typical graphics system includes a host computer, display devices like monitors, and input devices like keyboards and mice. Common applications of computer graphics include GUIs, charts, CAD/CAM, maps, multimedia, and more. Display technologies discussed include CRT monitors, LCD panels, and other devices. Key aspects of CRT monitors like refresh rate, resolution, and bandwidth are also summarized.
Computer graphics - colour crt and flat-panel displaysVishnupriya T H
CRT monitors displays colour pictures by using a combination of phosphors that emit different colored light.
There are two types - Beam penetration method and shadow mask method
Computer graphics - colour crt and flat-panel displaysVishnupriya T H
CRT monitors displays colour pictures by using a combination of phosphors that emit different colored light.
There are two types - Beam penetration method and shadow mask method
This slide contain description about the line, circle and ellipse drawing algorithm in computer graphics. It also deals with the filled area primitive.
This Ppt is based on the Raster animation . It explains u ablout a brief idea bout the Raster Graphics its Working with Real time Animation Examples that are used in our day to day life.
The following points are covered in this ppt
1. Introduction
2. Working of Raster Animation
3. Types of Raster Animations Modern and Traditional
4. Examples
5.Applications
6. Advantages
7. Disadvantages
This PPT gives detailed information about Computer Graphics, Raster Scan System, Random Scan System, CRT Display, Color CRT Monitors, Input and Output Devices
Computer Graphics is an advance field in information technology and all about manipulation and rendering of images. This presentation covers all the main concepts in computer graphics including graphics algorithms.
This is a presentation by Dada Robert in a Your Skill Boost masterclass organised by the Excellence Foundation for South Sudan (EFSS) on Saturday, the 25th and Sunday, the 26th of May 2024.
He discussed the concept of quality improvement, emphasizing its applicability to various aspects of life, including personal, project, and program improvements. He defined quality as doing the right thing at the right time in the right way to achieve the best possible results and discussed the concept of the "gap" between what we know and what we do, and how this gap represents the areas we need to improve. He explained the scientific approach to quality improvement, which involves systematic performance analysis, testing and learning, and implementing change ideas. He also highlighted the importance of client focus and a team approach to quality improvement.
Synthetic Fiber Construction in lab .pptxPavel ( NSTU)
Synthetic fiber production is a fascinating and complex field that blends chemistry, engineering, and environmental science. By understanding these aspects, students can gain a comprehensive view of synthetic fiber production, its impact on society and the environment, and the potential for future innovations. Synthetic fibers play a crucial role in modern society, impacting various aspects of daily life, industry, and the environment. ynthetic fibers are integral to modern life, offering a range of benefits from cost-effectiveness and versatility to innovative applications and performance characteristics. While they pose environmental challenges, ongoing research and development aim to create more sustainable and eco-friendly alternatives. Understanding the importance of synthetic fibers helps in appreciating their role in the economy, industry, and daily life, while also emphasizing the need for sustainable practices and innovation.
The Art Pastor's Guide to Sabbath | Steve ThomasonSteve Thomason
What is the purpose of the Sabbath Law in the Torah. It is interesting to compare how the context of the law shifts from Exodus to Deuteronomy. Who gets to rest, and why?
The Indian economy is classified into different sectors to simplify the analysis and understanding of economic activities. For Class 10, it's essential to grasp the sectors of the Indian economy, understand their characteristics, and recognize their importance. This guide will provide detailed notes on the Sectors of the Indian Economy Class 10, using specific long-tail keywords to enhance comprehension.
For more information, visit-www.vavaclasses.com
Operation “Blue Star” is the only event in the history of Independent India where the state went into war with its own people. Even after about 40 years it is not clear if it was culmination of states anger over people of the region, a political game of power or start of dictatorial chapter in the democratic setup.
The people of Punjab felt alienated from main stream due to denial of their just demands during a long democratic struggle since independence. As it happen all over the word, it led to militant struggle with great loss of lives of military, police and civilian personnel. Killing of Indira Gandhi and massacre of innocent Sikhs in Delhi and other India cities was also associated with this movement.
Instructions for Submissions thorugh G- Classroom.pptxJheel Barad
This presentation provides a briefing on how to upload submissions and documents in Google Classroom. It was prepared as part of an orientation for new Sainik School in-service teacher trainees. As a training officer, my goal is to ensure that you are comfortable and proficient with this essential tool for managing assignments and fostering student engagement.
We all have good and bad thoughts from time to time and situation to situation. We are bombarded daily with spiraling thoughts(both negative and positive) creating all-consuming feel , making us difficult to manage with associated suffering. Good thoughts are like our Mob Signal (Positive thought) amidst noise(negative thought) in the atmosphere. Negative thoughts like noise outweigh positive thoughts. These thoughts often create unwanted confusion, trouble, stress and frustration in our mind as well as chaos in our physical world. Negative thoughts are also known as “distorted thinking”.
Model Attribute Check Company Auto PropertyCeline George
In Odoo, the multi-company feature allows you to manage multiple companies within a single Odoo database instance. Each company can have its own configurations while still sharing common resources such as products, customers, and suppliers.
2. Computer graphics involves display, manipulation,
storage pictures and experimental data for pro pre
visualization using a computer.
Typical computer graphic system consists of host
computer with support of fast processor , large
memory ,frame buffer and
Display devices (Monitors)
Input devices (keyboards, mouse , joysticks)
Output devices (printers, plotters, LCD panel)
(Conceptual framework for interactive graphics)
Application
Model
Application
Program
Graphic
System
Display
Input
3. 1. GUI(Buttons, Scroll
bars).
2. Plotting in Business
(Charts, Stocks).
3. Office Automation.
4. Desktop Publishing.
5. Plotting in Science and
Technology.
6. Web.
7. Commercial Ads.
8. CAM/CAD (VLSI,
Construction)
9. Scientific Visualization.
10. Simulation.
11. Maps.
12. Multimedia.
13. Process Monitoring.
14. Digital Image
Processing.
15. Education and
Training.
16. Entertainment
(Movies, Games).
5. Computer graphics system could be active or passive.
Active: The user controls the display with the help of
GUI using input device.
Passive: The user can control nothing.
Raster Image: Read the image, edit it, manipulate it
and save it back.
6. Four basic output primitives for drawing pictures:
1. Polyline: End-Point joint by line.
2. Filled Polygon: The points are joint to create a
closed region.
3. Ellipse (Arc): Can be used to draw circles.
4. Text: Font.
8. The most commonly used display devices is the CRT
Monitors.
Types of CRT display devices:
1. DVST (Direct View Storage Tube) The Simplest.
2. Calligraphic or Random Scan display system.
3. Refresh and Raster Scan display system.
9. 1. Refresh Rate: It’s the frequency at which a picture
is redrawn on the screen.
2. Persistence: The time it takes the emitted light
from the screen to delay to 1/10 of its original
intensity.
3. Resolution: The number of the points per
centimeter that can be plotted horizontally and
vertically (1280x1024).
4. Intensity: How much light will be produced.
5. Aspect Ratio: Gives the ratio of vertical points to
horizontal points necessary to produce equal length
lines in both directions on the screen.
10. Aspect ratio of ¾ means that a vertical line plotted
with 3 points has the same length as a horizontal line
plotted with 4 points.
Lower persistence phosphors require higher refresh
rate to maintain a picture on the screen without
flicker.
Phosphor with low persistence is useful for animation.
Higher persistence phosphor is useful for displaying
higher complex static picture.
Monitors are usually constructed with a persistence in
the range from 1 to 60 microsecond.
11.
12. Heating Filament: Heat up the cathode elements of
the CRT and that is what generates the electrons then
the electrons move through 3 cylindrical element of a
CRT.
Control Grid: (Negative Charged) Control the
intensity of the electron so the amount of the voltage
at the control grid will allow a certain amount of the
electrons to pass through.
Focusing Anode: (Positive Charged) Responsible to
focus the beam on to a particular point on the screen,
and its similar to lens focusing.
13. Accelerating Anode: (Positively Charged) The electrons
should strikes the screen at very high speed. Till now
the electron beam path is going straight after it has
passed these 3 stages (intensity control, focusing
control , acceleration). So the electron strike the center
of the screen so we need horizontal and vertical
deflections of the beam.
How we implement the deflections of the point?
we need horizontal and vertical deflections of the beam.
14. a CRT with long persistence phosphor.
Provides flicker-free display.
No refreshing necessary.
15. A slow moving electron beam draws a line on the
screen.
The electron beam is the basic component of a CRT.
The DVST has a storage mesh in which the phosphor
is embedded.
Image is stored as a distribution of charges on the
inside surface of the screen.
Very limited interactive support.
16. Has very limited application.
Modifying any part of the image requires redrawing
the entire modified image.
Change in the image requires to generate a new
charge distribution.
Slow process of drawing – typically a few seconds are
necessary for a complex picture.
Erasing takes about 0.5 seconds (All lines and
characters must be erased).
17. Also called Vector, Stroke, Line drawing displays.
Very closed to old TVs.
Characters are also made of sequences of strokes (or
short lines).
Vectored – electron beam is deflected from end-point
to end-point.
Random scan - Order of deflection is dictated by the
arbitrary order of the display commands.
Phosphor has short persistence – decays in 10-100 ms.
18. The display must be refreshed at regular intervals –
minimum of 30 Hz (fps) for flicker-free display.
Refresh Buffer : memory space allocated to store the
display list or display program for the display
processor to draw the picture.
The display processor interprets the commands in the
refresh buffer for plotting.
19.
20. The vector generator needs the intensity and the
points coordinate values.
The vector generator converts the digital coordinate
values to analog voltages for the beam-deflection
circuits.
Scope of animation with segmentation – mixture of
static and dynamic parts of a picture (it has a limited
support of animation).
Random-scan display system draws a set of lines in
any order.
21. Phosphor’s Fluorescence is the light emitted as
electrons (unstable) lose their excess energy while the
phosphor is being struck by electrons.
Phosphorescence is the light given off by the return of
the relatively more stable excited electrons to their
unexcited state once the electron beam excitation is
removed.
Phosphor’s persistence is defined as the time from the
removal of excitation to the moment when
phosphorescence has decayed to 10% of the initial
light output.
Long persistence : several seconds.
Short persistence : 10-60 ms.
22. Unlike DVST and random-scan which were line-
drawing devices, refresh CRT is a point-plotting
device.
Raster displays store the display primitives (lines,
characters, shaded and patterned areas) in a refresh
buffer.
Refresh buffer (also called frame buffer).
Frame buffer: stores the drawing primitives in terms
of points and pixels components.
23.
24. Entire screen is a matrix of pixels.
Each pixel brightness can be controlled.
Each point is an addressable point in screen and
memory.
Line cannot be drawn directly from one point to
another.
This causes the effect of ‘aliasing’, ‘jaggies’ or ‘staircase’
effect.
Refresh/Frame buffer is also called Bit-plane.
25. For 512x512 raster display then 218 bits are necessary
in a single bit plane. Memory size required: 32 KB.
29*29=218 b > 218/23=215 B > 215/210=25=32 KB
Memory size required for N-bit plane gray level frame
buffers: N Size in KB
3 96=(3*32)
8 256=(8*32)
24 768=(24*32)
26. For 1024x1024 raster display then 220 bits are
necessary in a single bit plane. Memory size required:
128 KB.
210*210=220 b > 220/23=217 B > 217/210=27=128 KB
Memory size required for N-bit plane gray level frame
buffers: N Display
color
Size
1 Black &
White
128 KB
8 256 color 1 MB
24 16 million
color
3 MB
27. Consider three different raster systems with resolutions
of 640 x 480 and1280 x 1024,What size is frame buffer
(in bytes) for each of these systems to store 12 bits per
pixel?
640 x 480 x 12 bits / 8 = 450KB.
1280 x 1024 x 12 bits / 8 = 1920KB.
Find out the aspect ratio of the raster system using 8 x
10 inches screen and 100 pixel/inch.?
Aspect ratio = width/height = 8*100/10*100 = 4/5
You have 3 guns each gun have 8 bit, and you have 256
color, find the memory size required in MB?
224 Bits > 224/23=221 Byte > 211 KB > 21 MB , 21*256=256
28. Refresh rate: is the number of times the image is drawn
on the screen per second.
Refresh rate to avoid flickering : 60 Hz
Reducing refresh rate increases flicker and reduces the
frame buffer size.
Horizontal scan rate is the number of scan lines the
circuit drives a CRT display per second
Horizontal scan rate = refresh rate x number of scan
lines
29.
30. Bandwidth of the display: The rate at which the beam
can be turned OFF to ON and vice-versa.
EX: For N pixels per scan line, it is necessary to turn the
electron gun at a maximum rate of: N/2 times ON and
N/2 times OFF; This will create alternate black and
white lines on the screen.
31. EX: NTSC (American Standard Video) has 525 scan
lines with a frame rate of 30 fps.
Viewing aspect ratio is 4:3.
Each frame has two fields, each containing half the
picture.
Fields are interlaced or interwoven.
One field contains odd scan lines (1,3,5,…,525)
The other contains even scan lines (2,4,6,…,524)
Fields are presented alternately every other 1/60-th of a
sec. (1/30 * 1/2 =1/60)
32. Horizontal retrace : As the electron beam reaches the
right edge of the screen, it is made invisible and rapidly
returns to the left edge.
Horizontal retrace is faster than scan lines, it takes 17%
of a time allotted for a scan line.
EX: If a scan line takes 100 ms a horizontal retrace
takes about 17 ms beam to the top center of the screen.
In NTSC, generally 483 lines are visible. This is because,
the vertical retrace after each field requires a time
equivalent of 21 scan lines.
33. So for each field we have time to display:
262.5 (=525/2) – 21(vertical retrace) = 241.5 lines per
field.
Let the time available for each scan line be T.
Thus, we have: T * 525 * 30 = 1 sec.
Thus, T = 63.5 microsecond/scan-line.
T’ = 0.83*T = 53 ms (time to scan from left to right).
Considering 4:3 aspect ratio, the number of pixels per
scan line = 483*4/3 = 644 (483=525-21*2).
Thus, time available for the beam to access and display
a pixel = 53/644=82.3 ns (Nano-second).
34. In NTSC suppose we have 4 fields with 1600 rows and
900 columns and refresh rate = 60 HZ, find 1-the time
needed to access and display each pixel 2-horizontal
scan rate ?
Number of scanline = number of rows = 1600
Aspect ratio = 900/1600 = 9/16
T*1600*60 = 1000000 microsecond T= 10.4
T’ = 0.83*10.4 = 8.63
1600-(21*4) = 1516.
The number of pixels per scan line = 1516*9/16 = 853.
Time needed to access and display a pixel = 8.63/853 =
10.11 ns
Horizontal scan rate = 60 x 1600 = 96000
35. Choice of the number of gray scales and colors depend on
the value of N (bit plane size)
For colored displays (raster-scan), three separate color
guns must be used. Each pixel has 3 dots. Each gun is
associated with a one bit-plane then we have 8 colors.
(EGA/Enhanced Graphic Adapter)
N Number of colors
1 2 colors (B&W)
3 8 gray scales or colors
8 256 gray scales or colors
24 16 million colors
36. Typically 8-bit planes per color is used, which gives
a 24-bit plane frame buffer.
Each group generates 256(28) shades of intensities
of red, green or blue.
Hence we obtain 224 = 16,777,216 possible colors.
This is called a Full Color Frame Buffer.
True Color 232 so its clear more than Full Color.
37.
38. Operation of a delta-delta, shadow-mask CRT.
Three electron guns, aligned with the triangular
color-dot patterns on the screen, are directed to each
dot triangle by a shadow mask.