
More Related Content
What's hot
Viewers also liked
Viewers also liked (20)
Similar to Cob 20091028 2
More from macavity_d_katt
More from macavity_d_katt (20)
Recently uploaded
Recently uploaded (20)
Cob 20091028 2
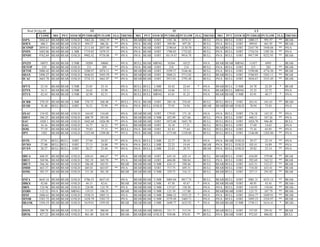
- 1. Wed 28-Oct-09 ST IT LT CLOSE MO PVT STOCH PVTHIGH PVTLOW FLG TREND+ MO PVT STOCH PVTHIGH PVTLOW FLG TREND+ MO PVT STOCH PVTHIGH PVTLOW FLG TREND+ $SPX 1042.63 BEAR BEAR O/SLD 1063.26 1042.19 ** #N/A BEAR BEAR O/BT 1101.36 1074.31 - BULL #N/A BULL O/BT 1080.15 991.97 ** BEAR- $OEX 486.5 BEAR BEAR O/SLD 494.37 486.26 ** #N/A #N/A BEAR O/BT 509.00 497.20 - BULL #N/A BULL O/BT 499.01 461.95 ** BEAR- $COMP 2059.61 BEAR BEAR O/SLD 2111.84 2057.40 ** #N/A #N/A BEAR O/BT 2190.64 2130.70 - BULL BEAR BULL O/BT 2167.70 1958.04 ** #N/A $NDX 1682.06 BEAR BEAR L/MR 1719.82 1679.35 - #N/A #N/A BEAR O/BT 1780.83 1732.02 - BULL #N/A BULL O/BT 1754.54 1585.56 ** #N/A $INDU 9762.69 BEAR BEAR O/SLD 9902.42 9758.08 ** #N/A #N/A BEAR O/BT 10119.47 9916.78 - BULL #N/A BULL O/BT 9917.99 9252.93 ** BEAR- $N225 10075 BEAR BEAR U/MR 10209 10060 - #N/A BULL BEAR MRNG 10364 10125 - #N/A BEAR BEAR MRNG 11457 6995 - BEAR- $ETOP 210 BEAR BEAR O/SLD 211 209 ** #N/A #N/A BEAR O/BT 218 214 - BULL #N/A BULL O/BT 215 202 ** BEAR- $FTSE 5080.42 BEAR BEAR O/SLD 5200.97 5074.11 ** #N/A BEAR BEAR O/BT 5299.57 5166.46 - BULL #N/A BULL O/BT 5190.00 4776.50 ** BEAR $DAX 5496.27 BEAR BEAR O/SLD 5646.01 5493.59 ** #N/A BEAR BEAR O/BT 5888.21 5712.82 - BULL BEAR BULL O/BT 5760.83 5263.11 ** BEAR $CAC 3663.78 BEAR BEAR O/SLD 3734.31 3661.07 ** #N/A BEAR BEAR O/BT 3913.81 3792.48 - BULL #N/A BULL O/BT 3856.67 3535.49 ** BEAR- $FVX 23.34 BEAR BEAR U/MR 23.85 23.14 - #N/A BULL BULL L/MR 24.42 22.64 * #N/A BEAR BULL U/MR 24.78 22.29 * BEAR $TNX 34.11 BEAR BEAR U/MR 34.62 33.90 - #N/A BULL BULL MRNG 34.86 33.11 - #N/A BEAR BULL MRNG 35.35 32.72 - #N/A $TYX 42.43 BEAR BEAR U/MR 42.90 42.31 - #N/A BULL BULL MRNG 43.01 41.23 - #N/A BEAR BEAR U/MR 43.91 40.17 * #N/A $CRB 270.39 BEAR BEAR L/MR 276.72 268.40 * BULL+ #N/A BEAR O/BT 285.18 276.05 - BULL BULL BULL O/BT 263.41 241.65 ** BEAR- $USD 76.48 BULL BULL O/BT 76.51 75.99 ** #N/A #N/A BULL O/SLD 75.91 74.94 - BEAR BEAR BEAR O/SLD 78.94 75.83 - #N/A $XAU 154.92 BEAR BEAR O/SLD 164.02 154.60 - #N/A BEAR BEAR O/BT 179.83 171.18 - #N/A #N/A BULL O/BT 176.18 143.35 ** #N/A $HUI 384.25 BEAR BEAR O/SLD 408.79 383.08 - #N/A BEAR BEAR U/MR 452.09 427.66 - BULL #N/A BULL O/BT 448.31 347.26 ** #N/A $AU 1028.1 BEAR BEAR O/SLD 1042.60 1026.90 ** #N/A BEAR BEAR O/BT 1072.00 1043.70 - BULL BULL BULL O/BT 1024.70 946.40 - BULL $AG 16.16 BEAR BEAR O/SLD 16.77 16.12 ** #N/A BEAR BEAR O/BT 18.18 17.21 - BULL BULL BULL O/BT 17.69 14.65 - #N/A $OIL 77.19 BEAR BEAR O/SLD 79.83 77.15 ** BULL+ #N/A BEAR O/BT 82.43 77.64 - BULL BULL BULL O/BT 73.16 65.05 ** #N/A $PT 1302 BEAR BEAR O/SLD 1323.00 1298.00 ** #N/A #N/A BEAR O/BT 1373.00 1338.00 - BULL BULL BULL O/BT 1346.00 1202.00 ** #N/A $VIX 27.91 BULL BULL O/BT 27.94 24.83 ** #N/A #N/A BULL L/MR 22.77 20.10 - #N/A #N/A BEAR O/SLD 29.57 22.19 ** #N/A $VXO 27.08 BULL BULL O/BT 27.13 24.08 ** #N/A #N/A BULL L/MR 22.23 19.44 - BEAR #N/A BULL O/SLD 103.41 16.89 ** #N/A $VXN 28.27 BULL BULL O/BT 28.27 25.40 ** #N/A #N/A BULL L/MR 23.43 20.75 - BEAR #N/A BULL O/SLD 29.82 23.14 ** #N/A $RUA 606.95 BEAR BEAR O/SLD 620.65 606.67 ** #N/A BEAR BEAR O/BT 645.10 628.14 - BULL BEAR BULL O/BT 634.09 579.00 ** BEAR $RUI 569.96 BEAR BEAR O/SLD 582.19 569.70 ** #N/A BEAR BEAR O/BT 604.08 588.84 - BULL #N/A BULL O/BT 592.69 542.52 ** BEAR $RUT 566.36 BEAR BEAR O/SLD 586.48 565.91 - BEAR BEAR BEAR U/MR 624.13 598.46 - BULL BEAR BULL O/BT 625.31 552.27 ** BEAR $MID 663.37 BEAR BEAR O/SLD 685.81 663.07 ** #N/A BEAR BEAR O/BT 717.75 695.31 - BULL BEAR BULL O/BT 710.20 633.41 ** BEAR $SML 301.57 BEAR BEAR O/SLD 311.26 301.30 - BEAR BEAR BEAR U/MR 329.73 316.15 - BULL BEAR BULL O/BT 327.11 291.82 ** BEAR $NFA 4643.16 BEAR BEAR O/SLD 4786.53 4637.43 - #N/A BEAR BEAR U/MR 5085.04 4917.74 - BULL BEAR BULL O/BT 5081.31 4533.15 ** BEAR- $BKX 42.68 BEAR BEAR O/SLD 44.15 42.61 - BEAR BEAR BEAR L/MR 47.58 45.67 * #N/A BEAR BEAR O/BT 48.95 43.45 ** BEAR-- $BIX 124.96 BEAR BEAR O/SLD 128.90 124.79 ** #N/A BEAR BEAR U/MR 137.67 130.50 - #N/A #N/A BULL O/BT 134.93 118.04 ** BEAR-- $XBD 112.12 #N/A BEAR MRNG 119.53 106.35 - BEAR BEAR BEAR U/MR 125.39 117.80 - #N/A BEAR BEAR O/BT 123.75 107.79 ** BEAR- $IXF 1886.61 BEAR BEAR O/SLD 1930.53 1885.31 - #N/A BEAR BEAR U/MR 2006.52 1932.23 * #N/A #N/A BULL O/BT 2016.77 1849.91 ** BEAR- $INSR 3383.72 BEAR BEAR O/SLD 3438.79 3383.72 - #N/A BEAR BEAR U/MR 3579.49 3469.71 - #N/A #N/A BULL O/BT 3495.23 3324.97 ** BEAR $BANK 1594.19 BEAR BEAR O/SLD 1619.01 1593.05 - BEAR BEAR BEAR L/MR 1698.77 1632.92 * #N/A BEAR BEAR U/MR 1750.11 1614.41 * BEAR-- $SOX 300.78 BEAR BEAR O/SLD 311.05 300.04 - BEAR BEAR BEAR MRNG 331.71 315.54 - BULL BEAR BULL O/BT 337.03 295.81 ** BEAR $BTK 827.23 BEAR BEAR O/SLD 861.40 826.98 - BEAR- BEAR BEAR O/SLD 938.08 876.81 ** BULL #N/A BEAR O/BT 972.65 886.02 - BULL
- 2. Wed 28-Oct-09 ST IT LT CLOSE MO PVT STOCH PVTHIGH PVTLOW FLG TREND+ MO PVT STOCH PVTHIGH PVTLOW FLG TREND+ MO PVT STOCH PVTHIGH PVTLOW FLG TREND+ $XTC 686.43 BEAR BEAR O/SLD 692.64 684.01 - BEAR BEAR BEAR U/MR 727.46 702.36 - #N/A BEAR BULL O/BT 725.92 650.72 ** BEAR $IXTC 200.88 BEAR BEAR O/SLD 205.13 200.71 - BEAR BEAR BEAR MRNG 215.43 208.88 - #N/A #N/A BULL O/BT 220.19 197.45 ** #N/A $NWX 221.63 BEAR BEAR O/SLD 228.08 221.57 - #N/A BEAR BEAR L/MR 243.74 232.80 * BULL #N/A BULL O/BT 241.59 201.23 ** #N/A $DDX 98.22 BEAR BEAR O/SLD 101.86 98.22 - #N/A BEAR BEAR L/MR 107.03 102.96 * BULL BEAR BULL O/BT 110.18 93.24 ** #N/A $IIX 213.48 BEAR BEAR O/SLD 218.76 213.36 ** #N/A #N/A BEAR O/BT 226.18 220.13 - BULL #N/A BULL O/BT 222.80 197.09 - #N/A $CYC 710.93 BEAR BEAR O/SLD 746.04 709.24 ** #N/A BEAR BEAR O/BT 798.93 769.81 - BULL BEAR BULL O/BT 772.81 672.77 ** #N/A $TRAN 3640.35 BEAR BEAR O/SLD 3760.51 3634.99 - BEAR BEAR BEAR U/MR 4066.40 3790.93 - #N/A BEAR BULL O/BT 4055.58 3571.69 ** BEAR $TRANQ 1800.65 BEAR BEAR O/SLD 1844.62 1798.94 - BEAR BEAR BEAR L/MR 1996.81 1882.91 * #N/A BEAR BULL U/MR 2045.28 1773.76 * BEAR- $XAL 23.95 BEAR BEAR O/SLD 25.18 23.86 - BEAR BEAR BEAR L/MR 28.55 25.49 * BULL BEAR BULL O/BT 30.95 22.26 ** BEAR $RLX 381.59 BEAR BEAR L/MR 392.50 381.08 * #N/A BEAR BEAR O/BT 399.39 381.82 - BULL #N/A BULL O/BT 389.09 354.91 ** #N/A $HGX 93.26 BEAR BEAR O/SLD 97.98 92.94 - BEAR BEAR BEAR L/MR 106.29 100.57 * #N/A BEAR BEAR U/MR 116.81 99.44 * BEAR- $CMR 636.75 BEAR BEAR O/SLD 647.11 636.48 ** #N/A BEAR BEAR O/BT 668.76 652.83 - BULL BULL BULL O/BT 648.48 601.68 ** #N/A $DRG 289.21 #N/A BEAR O/SLD 294.58 288.30 ** #N/A BEAR BEAR O/BT 300.69 291.05 - BULL BULL BULL O/BT 289.68 275.12 ** #N/A $HMO 1127.06 #N/A BULL L/MR 1165.11 1112.60 - BEAR #N/A BEAR L/MR 1206.74 1113.75 * #N/A BEAR BEAR MRNG 1290.55 1143.50 - BEAR $UTIL 366.05 BEAR BEAR O/SLD 371.32 365.85 - #N/A BEAR BEAR MRNG 388.62 375.95 - #N/A BEAR BEAR U/MR 385.91 365.79 * BEAR- $UTY 386.23 BEAR BEAR O/SLD 391.78 385.96 - #N/A #N/A BEAR MRNG 406.85 395.14 - #N/A BEAR BEAR U/MR 404.78 386.40 * BEAR- $XOI 1065.13 BEAR BEAR O/SLD 1094.61 1063.02 ** BULL #N/A BEAR O/BT 1133.85 1095.90 - BULL BULL BEAR O/BT 1156.87 744.56 ** BEAR $XNG 496.08 BEAR BEAR O/SLD 514.91 495.73 ** #N/A BEAR BEAR O/BT 549.49 516.82 - BULL BULL BULL O/BT 516.56 440.82 ** #N/A $OSX 190.1 BEAR BEAR O/SLD 198.46 189.71 ** #N/A BEAR BEAR O/BT 214.15 202.25 - BULL BULL BULL O/BT 199.07 168.53 ** BEAR MG135 503.69 BEAR BEAR O/SLD 535.85 501.47 - #N/A BEAR BEAR U/MR 589.05 556.89 - BULL #N/A BULL O/BT 580.71 459.44 ** #N/A MG136 204.41 BEAR BEAR O/SLD 221.71 202.52 ** #N/A BEAR BEAR O/BT 253.16 235.07 - BULL BULL BULL O/BT 240.27 166.01 ** #N/A %40Dma 23.24 BEAR BEAR O/SLD 23.24 23.24 - BEAR-- BEAR BEAR MRNG 82.38 52.67 - #N/A #N/A BEAR O/BT 89.02 68.01 ** #N/A %200Dma 87.82 BEAR BEAR O/SLD 87.82 87.82 - BEAR BEAR BEAR MRNG 93.20 91.56 - #N/A #N/A BEAR O/BT 93.56 88.20 - BULL