
More Related Content
What's hot
Viewers also liked
Viewers also liked (20)
Similar to Cob 20080723 2
More from macavity_d_katt
More from macavity_d_katt (20)
Recently uploaded
Recently uploaded (20)
Cob 20080723 2
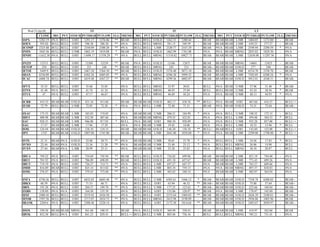
- 1. Wed 23-Jul-08 ST IT LT CLOSE MO PVT STOCH PVTHIGH PVTLOW FLG TREND+ MO PVT STOCH PVTHIGH PVTLOW FLG TREND+ MO PVT STOCH PVTHIGH PVTLOW FLG TREND+ $SPX 1282.19 #N/A BULL O/BT 1291.17 1276.06 ** BEAR BULL BULL O/SLD 1262.31 1200.44 - BEAR BEAR BEAR L/MR 1404.05 1272.00 - BEAR $OEX 593.02 BULL BULL O/BT 596.38 588.20 ** #N/A BULL BULL MRNG 581.15 549.59 - BEAR BEAR BEAR L/MR 639.23 577.27 - BEAR $COMP 2325.88 BULL BULL O/BT 2350.09 2300.20 ** #N/A BULL BULL L/MR 2320.77 2167.29 - BEAR #N/A BEAR L/MR 2549.94 2290.59 * #N/A $NDX 1845.56 BULL BULL U/MR 1865.19 1819.08 * BEAR #N/A BULL O/SLD 1862.99 1761.08 - #N/A #N/A BEAR MRNG 2055.82 1829.30 - #N/A $INDU 11632.38 #N/A BULL O/BT 11698.17 11558.29 ** #N/A BULL BULL MRNG 11510.82 10827.71 - BEAR- BEAR BEAR L/MR 12638.08 11287.56 - #N/A $N225 13313 BULL BULL O/BT 13389 13239 ** BEAR #N/A BULL O/SLD 13186 12671 - BEAR BEAR BEAR MRNG 14601 13453 - BEAR- $ETOP 250 BULL BULL O/BT 251 248 ** BEAR BULL BULL MRNG 245 232 - BEAR-- BEAR BEAR O/SLD 277 248 - BEAR- $FTSE 5449.9 BULL BULL O/BT 5467.20 5364.10 ** BEAR BULL BULL O/SLD 5376.40 5071.10 - BEAR- BEAR BEAR L/MR 6534.70 5338.70 - BEAR $DAX 6536.09 BULL BULL O/BT 6562.26 6485.05 ** #N/A BULL BULL MRNG 6396.30 5999.32 - BEAR BEAR BEAR L/MR 7102.05 6308.24 * #N/A $CAC 4408.74 BULL BULL O/BT 4419.48 4367.27 ** BEAR BULL BULL MRNG 4299.36 4002.87 - BEAR- BEAR BEAR O/SLD 5012.01 4348.31 - BEAR- $FVX 35.35 BULL BULL O/BT 35.68 35.05 - #N/A BULL BULL MRNG 33.97 30.01 - BULL #N/A BEAR U/MR 37.96 31.40 * BEAR- $TNX 41.48 #N/A BULL O/BT 41.74 41.24 - #N/A BULL BULL MRNG 40.93 37.69 - BULL BULL BEAR U/MR 43.24 38.56 * BEAR $TYX 47 #N/A BULL O/BT 47.17 46.67 - #N/A BULL BULL MRNG 46.69 44.24 - #N/A #N/A BEAR U/MR 48.13 44.93 * #N/A $CRB 414.15 BEAR BEAR O/SLD 421.16 413.80 - BEAR- BEAR BEAR O/SLD 462.17 430.76 ** BULL+ #N/A BEAR O/BT 467.60 416.27 - BULL++ $USD 72.79 BULL BULL U/MR 72.85 72.38 * #N/A #N/A BULL L/MR 72.40 71.31 - BEAR #N/A BEAR O/SLD 74.31 72.04 - BEAR-- $XAU 175.33 BEAR BEAR L/MR 185.03 174.85 - #N/A BEAR BEAR U/MR 206.21 184.99 * #N/A #N/A BULL U/MR 198.52 172.15 - BULL $HUI 408.98 BEAR BEAR L/MR 432.50 407.66 - #N/A BEAR BEAR MRNG 479.35 432.81 - #N/A #N/A BULL L/MR 459.48 384.53 * BULL $AU 920.35 BEAR BEAR L/MR 946.80 917.05 * BULL #N/A BEAR O/BT 988.50 950.09 - #N/A #N/A BULL U/MR 935.28 857.00 - BULL++ $AG 17.37 BEAR BEAR L/MR 17.96 17.29 - #N/A #N/A BEAR U/MR 19.45 18.06 - #N/A #N/A BULL L/MR 18.33 15.96 * BULL $OIL 124.44 BEAR BEAR O/SLD 128.10 124.33 - BEAR BEAR BEAR O/SLD 146.20 130.18 ** BULL+ BEAR BULL O/BT 142.60 122.00 - BULL++ $PT 1747 BEAR BEAR O/SLD 1807.00 1745.00 - BEAR-- BEAR BEAR L/MR 2041.00 1850.00 * #N/A #N/A BEAR L/MR 2299.00 1798.00 * BULL++ $VIX 21.31 BEAR #N/A O/SLD 22.08 20.73 ** #N/A BEAR BEAR U/MR 30.81 23.78 * #N/A BULL BULL L/MR 24.56 17.83 * BULL $VXO 22.44 BEAR #N/A O/SLD 23.36 21.20 ** #N/A BEAR BEAR U/MR 33.48 25.12 * #N/A BULL BULL MRNG 26.86 14.90 - BULL $VXN 27.44 BEAR #N/A L/MR 28.99 25.31 - #N/A BEAR BEAR U/MR 35.28 25.83 - #N/A BULL BULL MRNG 30.18 20.87 - BULL $RUA 749.22 #N/A BULL O/BT 754.69 745.94 ** BEAR BULL BULL O/SLD 736.82 699.86 - BEAR BEAR BEAR L/MR 821.19 744.40 - #N/A $RUI 701.92 #N/A BULL O/BT 706.89 698.89 ** BEAR BULL BULL O/SLD 691.18 657.67 - BEAR BEAR BEAR L/MR 771.43 699.26 - #N/A $RUT 719.19 #N/A BULL O/BT 726.27 714.71 ** #N/A BULL BULL L/MR 697.27 647.37 - #N/A BEAR BEAR L/MR 763.27 689.66 - #N/A $MID 816.89 BEAR BULL O/BT 825.14 813.02 ** #N/A BULL BULL L/MR 803.34 759.13 - #N/A #N/A BEAR MRNG 897.37 818.83 - #N/A $SML 376.47 #N/A BULL O/BT 379.43 373.60 ** #N/A BULL BULL L/MR 365.62 340.14 - #N/A BEAR BEAR L/MR 402.07 364.94 - #N/A $NFA 6750.26 BULL BULL O/BT 6832.05 6603.48 ** #N/A BULL BULL U/MR 6385.61 5446.12 * BEAR- BEAR BEAR O/SLD 7358.78 6200.02 - BEAR-- $BKX 68.39 #N/A BULL O/BT 71.53 66.71 - #N/A BULL BULL O/BT 63.94 46.52 ** BEAR-- BEAR BEAR O/SLD 75.88 57.64 - BEAR-- $BIX 193.38 #N/A BULL O/BT 204.57 189.70 ** #N/A BULL BULL U/MR 177.25 123.62 * BEAR-- BEAR BEAR O/SLD 225.66 169.84 - BEAR-- $XBD 158.89 #N/A #N/A O/BT 164.50 155.39 - #N/A BULL BULL O/BT 155.06 120.97 ** BEAR #N/A BEAR L/MR 170.47 145.69 - BEAR- $IXF 2480.45 BULL BULL O/BT 2519.42 2426.50 - #N/A BULL BULL O/BT 2375.64 1969.03 ** BEAR BEAR BEAR O/SLD 2626.39 2248.01 - BEAR-- $INSR 3707.56 BULL BULL O/BT 3717.07 3654.73 ** #N/A BULL BULL MRNG 3412.98 3198.89 - BEAR- BEAR BEAR O/SLD 3936.86 3403.96 - BEAR $BANK 2269.6 #N/A BULL O/BT 2308.48 2228.14 - #N/A BULL BULL O/BT 2172.30 1814.64 ** BEAR- BEAR BEAR O/SLD 2483.07 2050.97 - BEAR-- $SOX 350.38 BEAR BEAR MRNG 361.68 340.55 - BEAR #N/A BULL O/SLD 369.99 338.43 - BEAR BEAR BEAR L/MR 419.97 362.60 - BEAR $BTK 832.58 BULL #N/A O/BT 841.23 829.41 - BULL++ BULL BULL U/MR 805.04 756.16 - BULL BULL BULL MRNG 785.21 731.41 - #N/A
- 2. Wed 23-Jul-08 ST IT LT CLOSE MO PVT STOCH PVTHIGH PVTLOW FLG TREND+ MO PVT STOCH PVTHIGH PVTLOW FLG TREND+ MO PVT STOCH PVTHIGH PVTLOW FLG TREND+ $XTC 820.15 BEAR BULL U/MR 826.70 810.65 * #N/A #N/A BULL L/MR 819.92 782.64 - BEAR #N/A BEAR L/MR 892.76 809.73 - BEAR $IXTC 229.08 BEAR BULL U/MR 230.42 223.23 * BEAR- #N/A BULL O/SLD 228.55 215.20 - BEAR #N/A BEAR MRNG 270.85 232.39 - #N/A $NWX 212.93 BULL #N/A O/BT 214.69 209.54 ** #N/A BULL BULL O/SLD 205.75 191.35 - BEAR BEAR BEAR L/MR 245.80 208.18 - BEAR $DDX 103.42 BEAR BULL U/MR 103.93 100.42 * BEAR-- BULL BULL O/SLD 101.89 95.94 - BEAR- BEAR BEAR L/MR 130.71 107.73 - BEAR- $IIX 201.02 BEAR BULL U/MR 204.46 199.23 * BEAR #N/A BEAR L/MR 207.33 189.36 - BEAR #N/A BEAR MRNG 233.00 204.14 - #N/A $DOT 253.08 BULL BULL U/MR 257.05 250.01 * BEAR #N/A BULL O/SLD 255.69 239.95 - #N/A #N/A BEAR MRNG 283.49 252.38 - #N/A $CYC 874.35 BEAR BULL O/BT 884.52 866.65 ** #N/A BULL BULL MRNG 853.56 772.68 - BEAR- BEAR BEAR L/MR 982.15 850.81 * #N/A $TRAN 5138.61 #N/A #N/A O/BT 5195.42 5076.18 - #N/A BULL BULL L/MR 5010.51 4571.32 * #N/A #N/A BEAR U/MR 5492.95 4846.95 - BULL $TRANQ 2528.63 #N/A BULL O/BT 2589.40 2485.13 - #N/A BULL BULL L/MR 2552.32 2254.99 - #N/A BEAR BEAR L/MR 2779.74 2395.76 * #N/A $XAL 22.59 BULL BULL O/BT 23.04 20.82 - BULL+ BULL BULL O/BT 18.23 12.66 ** BEAR-- #N/A BULL O/SLD 20.93 15.63 - BEAR-- $RLX 360.98 #N/A BULL O/BT 371.05 348.68 ** #N/A BULL BULL MRNG 356.66 313.63 - BEAR BEAR BEAR O/SLD 408.82 352.34 - BEAR- $HGX 120.71 BULL BULL O/BT 124.34 115.52 - #N/A BULL BULL U/MR 114.36 93.75 * BEAR- BEAR BEAR O/SLD 133.61 107.63 - BEAR-- $CMR 675.09 BULL BULL O/BT 677.58 669.44 ** #N/A BULL BULL L/MR 669.62 641.90 - BEAR BEAR BEAR L/MR 710.34 645.74 * #N/A $DRG 304.75 BULL BULL MRNG 305.68 302.99 - BULL BULL BULL U/MR 310.67 293.62 * #N/A BULL BULL MRNG 302.60 277.26 - BEAR- $HMO 1398.75 BULL BULL O/BT 1398.75 1300.95 ** #N/A BULL BULL O/SLD 1226.51 1154.34 - BEAR-- #N/A BEAR O/SLD 1605.30 1241.34 - BEAR $UTIL 485.76 BEAR BEAR L/MR 497.94 483.68 - BEAR- BEAR BEAR L/MR 521.69 484.42 * #N/A #N/A BEAR MRNG 530.57 502.84 - BULL $UTY 509.46 BEAR BEAR L/MR 521.86 506.67 - BEAR- BEAR BEAR L/MR 543.02 506.85 * #N/A #N/A BEAR MRNG 551.35 525.25 - BULL $XOI 1293.18 BEAR BEAR O/SLD 1340.51 1288.57 - BEAR-- BEAR BEAR O/SLD 1422.75 1290.18 - BEAR BEAR BEAR U/MR 1663.95 1437.69 - BULL $XNG 595.06 BEAR BEAR O/SLD 623.12 592.81 - BEAR-- BEAR BEAR O/SLD 699.46 610.59 ** #N/A BEAR BEAR O/BT 761.52 701.11 - BULL++ $OSX 310.95 BEAR BEAR MRNG 326.79 308.16 - BEAR #N/A BEAR L/MR 338.26 309.30 * #N/A #N/A BEAR O/BT 359.70 329.12 - BULL+ MG135 549.28 BEAR BEAR L/MR 579.05 545.32 - #N/A BEAR BEAR MRNG 641.08 582.62 - #N/A #N/A BULL MRNG 632.45 530.49 - BULL MG136 285.53 BEAR BEAR MRNG 296.60 283.14 - #N/A #N/A BEAR L/MR 326.24 287.64 - BEAR BEAR BEAR L/MR 326.14 274.82 * #N/A %40Dma 33.85 BULL BULL O/BT 33.85 33.85 - #N/A BULL BULL O/SLD 19.41 11.13 - BEAR BEAR BEAR MRNG 62.87 14.81 - #N/A %200Dma 25.25 BULL BULL O/BT 25.25 25.25 ** BEAR BULL BULL O/SLD 22.44 20.15 - #N/A BEAR BEAR L/MR 45.77 23.92 - BEAR-