Downloaded 115 times
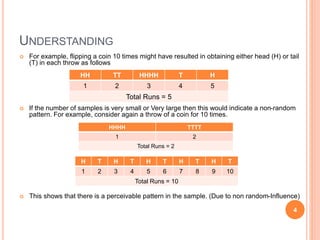
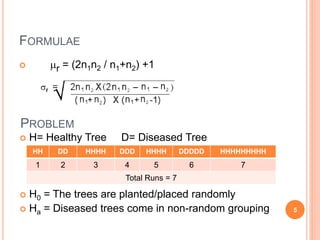
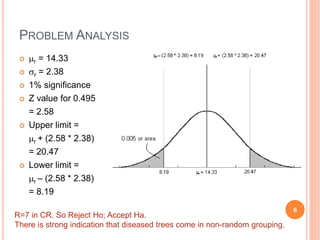
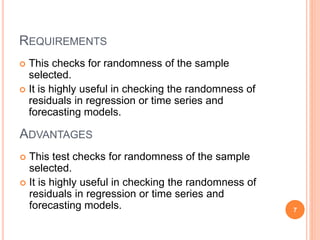

This document discusses a one sample runs test, which is used to determine if a sample is randomly drawn from a population. It defines a run as a series of like items. The document provides an example of coin flips and illustrates how different outcomes would indicate random or non-random patterns. It presents the formula for the runs test and applies it to an example of testing if diseased trees are randomly or non-randomly grouped. The requirements, advantages, and other applications of the runs test are outlined.