SlideShare a Scribd company logo
1 of 9
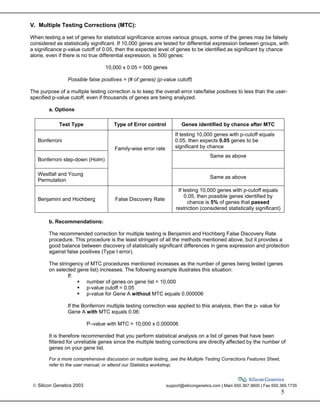
Download to read offline
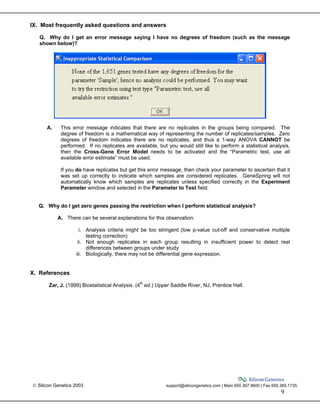
 Silicon Genetics 2003 support@silicongenetics.com | Main 650.367.9600 | Fax 650.365.1735
1
Statistical Analysis (1-way ANOVA)
Contents at a glance
I. Definition and Applications..................................................................................2
II. Before Performing 1-way ANOVA - A Checklist .................................................2
III. Overview of the Statistical Analysis (1-way tests) window..................................3
IV. 1-way ANOVA test ..............................................................................................4
a. Null hypothesis..........................................................................................4
b. Number of Genes Analyzed......................................................................4
c. Test Options..............................................................................................4
d. Recommendations ....................................................................................4
e. P-value......................................................................................................4
V. Multiple Testing Corrections................................................................................5
a. Options......................................................................................................5
b. Recommendations ....................................................................................5
VI. Post Hoc Tests....................................................................................................6
a. Options......................................................................................................6
VII. Interpreting the Results.......................................................................................6
a. Results of 1-way ANOVA without Post Hoc test applied...........................6
b. Results of 1-way ANOVA with Post Hoc test applied................................7
VIII. Viewing P-values Generated .............................................................................8
IX. Most frequently asked questions and answers ...................................................9
X. References .........................................................................................................9
 Silicon Genetics 2003 support@silicongenetics.com | Main 650.367.9600 | Fax 650.365.1735
2
I. Definition and Applications
One-way analysis of variance (ANOVA) tests allow you to determine if one given factor, such as drug treatment,
has a significant effect on gene expression behavior across any of the groups under study. A significant p-value
resulting from a 1-way ANOVA test would indicate that a gene is differentially expressed in at least one of the
groups analyzed. If there are more than two groups being analyzed, however, the 1-way ANOVA does not
specifically indicate which pair of groups exhibits statistical differences. Post Hoc tests can be applied in this
specific situation to determine which specific pair/pairs are differentially expressed. This document will provide
the necessary information for you to perform these analyses within GeneSpring.
II. Before Performing 1-way ANOVA – A Checklist
1. Do you have replicates for the experimental groups that you are about to compare? Statistical tests
that compare one group to another, such as Student’s t-test/ANOVA, need variance and means for
each group. Without replicates, the variance for each group cannot be computed using standard
methods. However, variance for experimental groups without replicates can be computed by
applying the GeneSpring Cross-Gene Error Model. If no replicates are available, apply the Error
Model based on Deviation from 1 before proceeding. Please refer to the GeneSpring user manual,
online tech notes, webinars, or cross-gene error model features sheet to learn more about the
Cross-Gene Error Model.
2. Have you filtered out genes whose measurements are mostly unreliable?
3. Have you defined one parameter in the Experiment Parameters window indicating which sample
belongs to which group?
4. If you plan to use a parametric test, have you changed the analysis mode to Log of Ratio in the
Experiment Interpretation window? Parametric tests assume that means of the populations under
study are normally distributed (Gaussian distribution). Interpreting your data in log mode will make
data more Normal/Gaussian than ratio mode.
It is mandatory that you either have replicates or apply the cross-gene error model if no replicates are available,
in order to perform 1-way ANOVA for groups under study. It is also recommended (though not mandatory) that
your statistical analysis be performed on a set of reliable genes, instead of all genes, on the chips.
 Silicon Genetics 2003 support@silicongenetics.com | Main 650.367.9600 | Fax 650.365.1735
3
III. Overview of the Statistical Analysis (1-way ANOVA tests) window
1. Go to Tools toolbar and select Statistical Analysis (ANOVA)
3. In the resulting window, select the 1-Way Tests tab
Figure 1: Statistical Analysis (ANOVA) 1-way tests window
o Choose Gene List: Select the gene list containing the set of genes you would like to analyze.
Statistical tests will be performed only on genes in the selected gene list. Again, it is
recommended that the all genes gene list should not be used. Instead, use a list of genes that
has been filtered to remove genes with measurements mostly in the noise range or mostly
flagged Absent.
o Choose Experiment: Choose the experiment and its proper interpretation to analyze. If you are
using parametric tests, then your experiment interpretation should be in log-of-ratio mode.
o Parameter to Test: Select the parameter and the underlying groups to compare. In the
example shown above, the parameter, ‘Drug Agent’ was selected to compare the effect of
different drug agents on Sprague-Dawley rats. If you would like to compare only selected
conditions for this parameter, open the Select Groups Manually window, and uncheck the
conditions that you would like to ignore. Only groups that are checked will be analyzed.
o Test Type: Select the appropriate 1-way ANOVA test type. If you are using a parametric test,
make sure your data has been log-transformed (by selecting log-of-ratio mode in experiment
interpretation window).
o False Discovery Rate: Indicates the overall rate of false positive. The wording for this option,
and its final effect on the number of false positives, changes according to the multiple testing
correction selected in the option below.
o Multiple Testing Correction: This test option is not required for analysis, but it will allow you
to keep the overall rate of false positive low.
o Post Hoc Tests: This test option is also not required for analysis, but selecting this option will
allow you to determine which pair(s) among the groups under study have expression means
that are statistically different.
 Silicon Genetics 2003 support@silicongenetics.com | Main 650.367.9600 | Fax 650.365.1735
4
IV. General background on 1-way ANOVA test
a. Null Hypothesis:
The hypothesis for each gene is that there is no difference in the mean gene expression
intensities in the groups tested. In other words, the gene will have equal means across every
group.
Example of a specific null hypothesis:
There is no difference in the mean gene expression intensities for the bcl-2 gene across all rat
groups treated with different drug agents.
b. Number of genes analyzed:
All genes in the selected gene list will be analyzed. If there are 10,000 genes on your gene list
(assuming you have all required measurements for each of the genes), then there are 10,000
separate analyses being performed and each gene will have a separate p-value.
c. Test Options:
Options
Specific test used
(analyzing 2 groups)
Specific test used
(analyzing more than 2 groups)
Parametric
(variances equal) Student’s T-test ANOVA
Parametric
(variances not equal) Welch t-test Welch ANOVA
Parametric (use all
available error estimate)
Welch t-test using error model
variances
Welch ANOVA using error model
variances
Nonparametric
Wilcoxon-Mann-Whitney test Kruskal-Wallis test
d. Recommendations:
• The Welch test (variances not assumed equal) is recommended for most cases. This is set as
the default.
• The parametric test, use all available error estimate, is similar to Welch test but has better
variance estimates. To use this option, the Cross-gene error model needs to be activated in
the Experiment Interpretation window.
• Student’s t-test/ANOVA (variances assumed equal) should be used if very few replicates are
available, or if some groups being analyzed do not have replicates.
• Nonparametric test makes the least assumptions about your data but should be used only when
there are more than 5 replicates per group.
e. P-value
Indicates the probability of getting a mean difference between the groups as high as what is
observed by chance. The lower the p-value, the more significant the difference between the
groups.
 Silicon Genetics 2003 support@silicongenetics.com | Main 650.367.9600 | Fax 650.365.1735
5
V. Multiple Testing Corrections (MTC):
When testing a set of genes for statistical significance across various groups, some of the genes may be falsely
considered as statistically significant. If 10,000 genes are tested for differential expression between groups, with
a significance p-value cutoff of 0.05, then the expected level of genes to be identified as significant by chance
alone, even if there is no true differential expression, is 500 genes:
10,000 x 0.05 = 500 genes
Possible false positives = (# of genes) (p-value cutoff)
The purpose of a multiple testing correction is to keep the overall error rate/false positives to less than the user-
specified p-value cutoff, even if thousands of genes are being analyzed.
a. Options
Test Type Type of Error control Genes identified by chance after MTC
Bonferroni
If testing 10,000 genes with p-cutoff equals
0.05, then expects 0.05 genes to be
significant by chance
Bonferroni step-down (Holm)
Family-wise error rate
Same as above
Westfall and Young
Permutation
Same as above
Benjamini and Hochberg False Discovery Rate
If testing 10,000 genes with p-cutoff equals
0.05, then possible genes identified by
chance is 5% of genes that passed
restriction (considered statistically significant)
b. Recommendations:
The recommended correction for multiple testing is Benjamini and Hochberg False Discovery Rate
procedure. This procedure is the least stringent of all the methods mentioned above, but it provides a
good balance between discovery of statistically significant differences in gene expression and protection
against false positives (Type I error).
The stringency of MTC procedures mentioned increases as the number of genes being tested (genes
on selected gene list) increases. The following example illustrates this situation:
If:
number of genes on gene list = 10,000
p-value cutoff = 0.05
p-value for Gene A without MTC equals 0.000006
If the Bonferroni multiple testing correction was applied to this analysis, then the p- value for
Gene A with MTC equals 0.06:
P–value with MTC = 10,000 x 0.000006
It is therefore recommended that you perform statistical analysis on a list of genes that have been
filtered for unreliable genes since the multiple testing corrections are directly affected by the number of
genes on your gene list.
For a more comprehensive discussion on multiple testing, see the Multiple Testing Corrections Features Sheet,
refer to the user manual, or attend our Statistics workshop.
 Silicon Genetics 2003 support@silicongenetics.com | Main 650.367.9600 | Fax 650.365.1735
6
VI. Post Hoc Tests:
1-way ANOVA determines whether a gene is differentially expressed in any of the conditions tested. However, it
does not indicate which specific group pair(s) are the ones where statistical differences occur. Post Hoc Test
can be used in conjunction with ANOVA to determine which specific group pair(s) are statistically different from
each other.
a. Options:
Test Name How it works
Tukey
All means for each condition are ranked in order of magnitude; group with lowest mean
gets a ranking of 1. The pairwise differences between means, starting with the largest
mean compared to the smallest mean, are tabulated between each group pair and
divided by the standard error. This value, q, is compared to a Studentized range critical
value. If q is larger than the critical value, then the expression between that group pair is
considered to be statistically different.
Student-
Newman-Keuls
(SNK) test:
This test is similar to the Tukey test, except with regard to how the critical value is
determined. All q’s in Tukey’s test are compared to the same critical value determined
for that experiment; whereas all q’s determined from SNK test are compared to a
different critical value. This makes the SNK test slightly less conservative than the Tukey
test.
** There are nonparametric and parametric versions of Tukey and Student-Newman-Keuls test.
GeneSpring will apply the correct option based on whether a parametric or nonparametric ANOVA test
was chosen.
VII. Interpreting the Results
a. Results from 1-way ANOVA without Post Hoc test applied
Figure 2 below shows an example of a 1-way ANOVA result without a Post Hoc test applied. The Notes
section indicates what setting was used for this analysis and the percentage of genes that could have
been identified by chance. The genes in this gene list were found to have measurements considered
statistically different across at least one group-pair. You cannot tell which exact group was differentially
expressed from this analysis.
Figure 2: 1-way ANOVA result
 Silicon Genetics 2003 support@silicongenetics.com | Main 650.367.9600 | Fax 650.365.1735
7
b. Results of 1-way ANOVA with Post Hoc test applied
1-way ANOVA with Post Hoc test applied will return the window shown in Figure 2, and also the
windows shown in Figures 3 and 4 below.
Figure 3: 1-way ANOVA with Post Hoc test, Summary by Gene tab
This window lists all the genes considered differentially expressed by statistical criteria. Groups with the highest
color differential have the most significant difference. Groups with the same color show no statistical difference
for that gene. A group colored grey is considered to be unknown because the significance of its mean difference
cannot be determined with confidence from the test used.
 Silicon Genetics 2003 support@silicongenetics.com | Main 650.367.9600 | Fax 650.365.1735
8
Figure 4: 1-way ANOVA with Post Hoc test, Summary by Groups tab
This window indicates the total number of genes that are statistically differentially expressed between the
groups being compared in the matrix. Greater color saturation indicates greater difference (or similarity). Total
number of genes analyzed is shown in the box colored grey. Gene list can be generated from each, or
combination of the boxes, by highlighting the appropriate boxes and selecting Make List of Union or Make List
of Intersection.
VIII. Viewing P-values Generated
The associated p-value for the genes on this gene list could be viewed in GeneSpring using the following
methods:
1. Gene List Inspector: Double-click on the selected gene list to open up the Gene List Inspector
window. P values are shown under the P-value columns.
2. Ordered List: Select the gene list and go to View ⇒ Ordered List. Genes are displayed according
to p-values: smallest p-values are on the left-hand side, highest p-values are on the right-hand side.
3. Export out of GeneSpring: Highlight the gene list and go to Edit ⇒ Copy ⇒ Copy Annotated
Gene List and select to export out Gene List Associated Values.
 Silicon Genetics 2003 support@silicongenetics.com | Main 650.367.9600 | Fax 650.365.1735
9
IX. Most frequently asked questions and answers
Q. Why do I get an error message saying I have no degrees of freedom (such as the message
shown below)?
A. This error message indicates that there are no replicates in the groups being compared. The
degree of freedom is a mathematical way of representing the number of replicates/samples. Zero
degrees of freedom indicates there are no replicates, and thus a 1-way ANOVA CANNOT be
performed. If no replicates are available, but you would still like to perform a statistical analysis,
then the Cross-Gene Error Model needs to be activated and the “Parametric test, use all
available error estimate” must be used.
If you do have replicates but get this error message, then check your parameter to ascertain that it
was set up correctly to indicate which samples are considered replicates. GeneSpring will not
automatically know which samples are replicates unless specified correctly in the Experiment
Parameter window and selected in the Parameter to Test field.
Q. Why do I get zero genes passing the restriction when I perform statistical analysis?
A. There can be several explanations for this observation:
i. Analysis criteria might be too stringent (low p-value cut-off and conservative multiple
testing correction)
ii. Not enough replicates in each group resulting in insufficient power to detect real
differences between groups under study
iii. Biologically, there may not be differential gene expression.
X. References
Zar, J. (1999) Biostatistical Analysis. (4th
ed.) Upper Saddle River, NJ, Prentice Hall.

More Related Content

What's hot

What's hot (17)

Analysis of variance (ANOVA) everything you need to know
Analysis of variance (ANOVA) everything you need to knowAnalysis of variance (ANOVA) everything you need to know
Analysis of variance (ANOVA) everything you need to know
 
In Anova
In  AnovaIn  Anova
In Anova
 
ANOVA (Educational Statistics)
ANOVA (Educational Statistics)ANOVA (Educational Statistics)
ANOVA (Educational Statistics)
 
ANOVA in R by Aman Chauhan
ANOVA in R by Aman ChauhanANOVA in R by Aman Chauhan
ANOVA in R by Aman Chauhan
 
Anova copy
Anova   copyAnova   copy
Anova copy
 
Anova; analysis of variance
Anova; analysis of varianceAnova; analysis of variance
Anova; analysis of variance
 
Anova test
Anova testAnova test
Anova test
 
Analysis of variance (ANOVA)
Analysis of variance (ANOVA)Analysis of variance (ANOVA)
Analysis of variance (ANOVA)
 
Annova test
Annova testAnnova test
Annova test
 
Analysis of Variance
Analysis of VarianceAnalysis of Variance
Analysis of Variance
 
Analysis of Variance - Meaning and Types
Analysis of Variance - Meaning and TypesAnalysis of Variance - Meaning and Types
Analysis of Variance - Meaning and Types
 
Two way anova+manova
Two way anova+manovaTwo way anova+manova
Two way anova+manova
 
Full anova and manova by ammara aftab
Full anova and manova by ammara aftabFull anova and manova by ammara aftab
Full anova and manova by ammara aftab
 
Analysis of variance (anova)
Analysis of variance (anova)Analysis of variance (anova)
Analysis of variance (anova)
 
Applied statistics lecture_8
Applied statistics lecture_8Applied statistics lecture_8
Applied statistics lecture_8
 
Data analysis with spss anova
Data analysis with spss anovaData analysis with spss anova
Data analysis with spss anova
 
Manova
ManovaManova
Manova
 

Similar to 1 way ANOVA(Analysis Of VAriance)

Experimental design cartoon part 5 sample size
Experimental design cartoon part 5 sample sizeExperimental design cartoon part 5 sample size
Experimental design cartoon part 5 sample sizeKevin Hamill
 
Statistical issues in subgroup analyses
Statistical issues in subgroup analysesStatistical issues in subgroup analyses
Statistical issues in subgroup analysesFrancois MAIGNEN
 
Happiness Data SetAuthor Jackson, S.L. (2017) Statistics plain
Happiness Data SetAuthor Jackson, S.L. (2017) Statistics plain Happiness Data SetAuthor Jackson, S.L. (2017) Statistics plain
Happiness Data SetAuthor Jackson, S.L. (2017) Statistics plain ShainaBoling829
 
Experimental Design1.ppt
Experimental Design1.pptExperimental Design1.ppt
Experimental Design1.ppthend110183
 
(Individuals With Disabilities Act Transformation Over the Years)D
(Individuals With Disabilities Act Transformation Over the Years)D(Individuals With Disabilities Act Transformation Over the Years)D
(Individuals With Disabilities Act Transformation Over the Years)DSilvaGraf83
 
(Individuals With Disabilities Act Transformation Over the Years)D
(Individuals With Disabilities Act Transformation Over the Years)D(Individuals With Disabilities Act Transformation Over the Years)D
(Individuals With Disabilities Act Transformation Over the Years)DMoseStaton39
 
Diversity-Aware Mutation Adequacy Criterion for Improving Fault Detection Cap...
Diversity-Aware Mutation Adequacy Criterion for Improving Fault Detection Cap...Diversity-Aware Mutation Adequacy Criterion for Improving Fault Detection Cap...
Diversity-Aware Mutation Adequacy Criterion for Improving Fault Detection Cap...Donghwan Shin
 
Analysis of Single-Cell Sequencing Data by CLC/Ingenuity: Single Cell Analysi...
Analysis of Single-Cell Sequencing Data by CLC/Ingenuity: Single Cell Analysi...Analysis of Single-Cell Sequencing Data by CLC/Ingenuity: Single Cell Analysi...
Analysis of Single-Cell Sequencing Data by CLC/Ingenuity: Single Cell Analysi...QIAGEN
 
Worked examples of sampling uncertainty evaluation
Worked examples of sampling uncertainty evaluationWorked examples of sampling uncertainty evaluation
Worked examples of sampling uncertainty evaluationGH Yeoh
 
Constructs, variables, hypotheses
Constructs, variables, hypothesesConstructs, variables, hypotheses
Constructs, variables, hypothesesPedro Martinez
 
WEEK 6 – EXERCISES Enter your answers in the spaces pr.docx
WEEK 6 – EXERCISES Enter your answers in the spaces pr.docxWEEK 6 – EXERCISES Enter your answers in the spaces pr.docx
WEEK 6 – EXERCISES Enter your answers in the spaces pr.docxwendolynhalbert
 
Nonparametric tests assignment
Nonparametric tests assignmentNonparametric tests assignment
Nonparametric tests assignmentROOHASHAHID1
 
Vergoulas Choosing the appropriate statistical test (2019 Hippokratia journal)
Vergoulas Choosing the appropriate statistical test (2019 Hippokratia journal)Vergoulas Choosing the appropriate statistical test (2019 Hippokratia journal)
Vergoulas Choosing the appropriate statistical test (2019 Hippokratia journal)Vaggelis Vergoulas
 
Basic of Statistical Inference Part-V: Types of Hypothesis Test (Parametric)
Basic of Statistical Inference Part-V: Types of Hypothesis Test (Parametric) Basic of Statistical Inference Part-V: Types of Hypothesis Test (Parametric)
Basic of Statistical Inference Part-V: Types of Hypothesis Test (Parametric) Dexlab Analytics
 

Similar to 1 way ANOVA(Analysis Of VAriance) (20)

Experimental design cartoon part 5 sample size
Experimental design cartoon part 5 sample sizeExperimental design cartoon part 5 sample size
Experimental design cartoon part 5 sample size
 
Chapter 5 anova analysis
Chapter 5 anova analysisChapter 5 anova analysis
Chapter 5 anova analysis
 
Statistical issues in subgroup analyses
Statistical issues in subgroup analysesStatistical issues in subgroup analyses
Statistical issues in subgroup analyses
 
Happiness Data SetAuthor Jackson, S.L. (2017) Statistics plain
Happiness Data SetAuthor Jackson, S.L. (2017) Statistics plain Happiness Data SetAuthor Jackson, S.L. (2017) Statistics plain
Happiness Data SetAuthor Jackson, S.L. (2017) Statistics plain
 
Experimental Design1.ppt
Experimental Design1.pptExperimental Design1.ppt
Experimental Design1.ppt
 
t-test Parametric test Biostatics and Research Methodology
t-test Parametric test Biostatics and Research Methodologyt-test Parametric test Biostatics and Research Methodology
t-test Parametric test Biostatics and Research Methodology
 
ANOVA Parametric test: Biostatics and Research Methodology
ANOVA Parametric test: Biostatics and Research MethodologyANOVA Parametric test: Biostatics and Research Methodology
ANOVA Parametric test: Biostatics and Research Methodology
 
(Individuals With Disabilities Act Transformation Over the Years)D
(Individuals With Disabilities Act Transformation Over the Years)D(Individuals With Disabilities Act Transformation Over the Years)D
(Individuals With Disabilities Act Transformation Over the Years)D
 
(Individuals With Disabilities Act Transformation Over the Years)D
(Individuals With Disabilities Act Transformation Over the Years)D(Individuals With Disabilities Act Transformation Over the Years)D
(Individuals With Disabilities Act Transformation Over the Years)D
 
Diversity-Aware Mutation Adequacy Criterion for Improving Fault Detection Cap...
Diversity-Aware Mutation Adequacy Criterion for Improving Fault Detection Cap...Diversity-Aware Mutation Adequacy Criterion for Improving Fault Detection Cap...
Diversity-Aware Mutation Adequacy Criterion for Improving Fault Detection Cap...
 
Analysis of Single-Cell Sequencing Data by CLC/Ingenuity: Single Cell Analysi...
Analysis of Single-Cell Sequencing Data by CLC/Ingenuity: Single Cell Analysi...Analysis of Single-Cell Sequencing Data by CLC/Ingenuity: Single Cell Analysi...
Analysis of Single-Cell Sequencing Data by CLC/Ingenuity: Single Cell Analysi...
 
Sec 1.3 collecting sample data
Sec 1.3 collecting sample data  Sec 1.3 collecting sample data
Sec 1.3 collecting sample data
 
Worked examples of sampling uncertainty evaluation
Worked examples of sampling uncertainty evaluationWorked examples of sampling uncertainty evaluation
Worked examples of sampling uncertainty evaluation
 
Constructs, variables, hypotheses
Constructs, variables, hypothesesConstructs, variables, hypotheses
Constructs, variables, hypotheses
 
WEEK 6 – EXERCISES Enter your answers in the spaces pr.docx
WEEK 6 – EXERCISES Enter your answers in the spaces pr.docxWEEK 6 – EXERCISES Enter your answers in the spaces pr.docx
WEEK 6 – EXERCISES Enter your answers in the spaces pr.docx
 
lecture9
lecture9lecture9
lecture9
 
Nonparametric tests assignment
Nonparametric tests assignmentNonparametric tests assignment
Nonparametric tests assignment
 
E178.13738
E178.13738E178.13738
E178.13738
 
Vergoulas Choosing the appropriate statistical test (2019 Hippokratia journal)
Vergoulas Choosing the appropriate statistical test (2019 Hippokratia journal)Vergoulas Choosing the appropriate statistical test (2019 Hippokratia journal)
Vergoulas Choosing the appropriate statistical test (2019 Hippokratia journal)
 
Basic of Statistical Inference Part-V: Types of Hypothesis Test (Parametric)
Basic of Statistical Inference Part-V: Types of Hypothesis Test (Parametric) Basic of Statistical Inference Part-V: Types of Hypothesis Test (Parametric)
Basic of Statistical Inference Part-V: Types of Hypothesis Test (Parametric)
 

More from musadoto

The design of Farm cart 0011 report 1 2020
The design of Farm cart 0011  report 1 2020The design of Farm cart 0011  report 1 2020
The design of Farm cart 0011 report 1 2020musadoto
 
IRRIGATION SYSTEMS AND DESIGN - IWRE 317 questions collection 1997 - 2018 ...
IRRIGATION SYSTEMS AND DESIGN - IWRE 317 questions collection 1997 - 2018    ...IRRIGATION SYSTEMS AND DESIGN - IWRE 317 questions collection 1997 - 2018    ...
IRRIGATION SYSTEMS AND DESIGN - IWRE 317 questions collection 1997 - 2018 ...musadoto
 
CONSTRUCTION [soil treatment, foundation backfill, Damp Proof Membrane[DPM] a...
CONSTRUCTION [soil treatment, foundation backfill, Damp Proof Membrane[DPM] a...CONSTRUCTION [soil treatment, foundation backfill, Damp Proof Membrane[DPM] a...
CONSTRUCTION [soil treatment, foundation backfill, Damp Proof Membrane[DPM] a...musadoto
 
Assignment thermal 2018 . ...
Assignment thermal 2018                   .                                  ...Assignment thermal 2018                   .                                  ...
Assignment thermal 2018 . ...musadoto
 
BASICS OF COMPUTER PROGRAMMING-TAKE HOME ASSIGNMENT 2018
BASICS OF COMPUTER PROGRAMMING-TAKE HOME ASSIGNMENT 2018BASICS OF COMPUTER PROGRAMMING-TAKE HOME ASSIGNMENT 2018
BASICS OF COMPUTER PROGRAMMING-TAKE HOME ASSIGNMENT 2018musadoto
 
ENGINEERING SYSTEM DYNAMICS-TAKE HOME ASSIGNMENT 2018
ENGINEERING SYSTEM DYNAMICS-TAKE HOME ASSIGNMENT 2018ENGINEERING SYSTEM DYNAMICS-TAKE HOME ASSIGNMENT 2018
ENGINEERING SYSTEM DYNAMICS-TAKE HOME ASSIGNMENT 2018musadoto
 
Hardeninig of steel (Jominy test)-CoET- udsm
Hardeninig of steel (Jominy test)-CoET- udsmHardeninig of steel (Jominy test)-CoET- udsm
Hardeninig of steel (Jominy test)-CoET- udsmmusadoto
 
Ultrasonic testing report-JUNE 2018
Ultrasonic testing report-JUNE 2018Ultrasonic testing report-JUNE 2018
Ultrasonic testing report-JUNE 2018musadoto
 
Ae 219 - BASICS OF PASCHAL PROGRAMMING-2017 test manual solution
Ae 219 - BASICS OF PASCHAL PROGRAMMING-2017 test manual solutionAe 219 - BASICS OF PASCHAL PROGRAMMING-2017 test manual solution
Ae 219 - BASICS OF PASCHAL PROGRAMMING-2017 test manual solutionmusadoto
 
Fluid mechanics ...
Fluid mechanics                                                              ...Fluid mechanics                                                              ...
Fluid mechanics ...musadoto
 
Fluid mechanics (a letter to a friend) part 1 ...
Fluid mechanics (a letter to a friend) part 1                                ...Fluid mechanics (a letter to a friend) part 1                                ...
Fluid mechanics (a letter to a friend) part 1 ...musadoto
 
Fluids mechanics (a letter to a friend) part 1 ...
Fluids mechanics (a letter to a friend) part 1                               ...Fluids mechanics (a letter to a friend) part 1                               ...
Fluids mechanics (a letter to a friend) part 1 ...musadoto
 
Fresh concrete -building materials for engineers
Fresh concrete -building materials  for engineersFresh concrete -building materials  for engineers
Fresh concrete -building materials for engineersmusadoto
 
surveying- lecture notes for engineers
surveying- lecture notes for engineerssurveying- lecture notes for engineers
surveying- lecture notes for engineersmusadoto
 
Fresh concrete -building materials for engineers
Fresh concrete -building materials  for engineersFresh concrete -building materials  for engineers
Fresh concrete -building materials for engineersmusadoto
 
DIESEL ENGINE POWER REPORT -AE 215 -SOURCES OF FARM POWER
DIESEL ENGINE POWER REPORT -AE 215 -SOURCES OF FARM POWERDIESEL ENGINE POWER REPORT -AE 215 -SOURCES OF FARM POWER
DIESEL ENGINE POWER REPORT -AE 215 -SOURCES OF FARM POWERmusadoto
 
Farm and human power REPORT - AE 215-SOURCES OF FARM POWER
Farm and human power  REPORT - AE 215-SOURCES OF FARM POWER Farm and human power  REPORT - AE 215-SOURCES OF FARM POWER
Farm and human power REPORT - AE 215-SOURCES OF FARM POWER musadoto
 
ENGINE POWER PETROL REPORT-AE 215-SOURCES OF FARM POWER
ENGINE POWER PETROL REPORT-AE 215-SOURCES OF FARM POWERENGINE POWER PETROL REPORT-AE 215-SOURCES OF FARM POWER
ENGINE POWER PETROL REPORT-AE 215-SOURCES OF FARM POWERmusadoto
 
TRACTOR POWER REPORT -AE 215 SOURCES OF FARM POWER 2018
TRACTOR POWER REPORT -AE 215  SOURCES OF FARM POWER 2018TRACTOR POWER REPORT -AE 215  SOURCES OF FARM POWER 2018
TRACTOR POWER REPORT -AE 215 SOURCES OF FARM POWER 2018musadoto
 
WIND ENERGY REPORT AE 215- 2018 SOURCES OF FARM POWER
WIND ENERGY REPORT AE 215- 2018 SOURCES OF FARM POWERWIND ENERGY REPORT AE 215- 2018 SOURCES OF FARM POWER
WIND ENERGY REPORT AE 215- 2018 SOURCES OF FARM POWERmusadoto
 

More from musadoto (20)

The design of Farm cart 0011 report 1 2020
The design of Farm cart 0011  report 1 2020The design of Farm cart 0011  report 1 2020
The design of Farm cart 0011 report 1 2020
 
IRRIGATION SYSTEMS AND DESIGN - IWRE 317 questions collection 1997 - 2018 ...
IRRIGATION SYSTEMS AND DESIGN - IWRE 317 questions collection 1997 - 2018    ...IRRIGATION SYSTEMS AND DESIGN - IWRE 317 questions collection 1997 - 2018    ...
IRRIGATION SYSTEMS AND DESIGN - IWRE 317 questions collection 1997 - 2018 ...
 
CONSTRUCTION [soil treatment, foundation backfill, Damp Proof Membrane[DPM] a...
CONSTRUCTION [soil treatment, foundation backfill, Damp Proof Membrane[DPM] a...CONSTRUCTION [soil treatment, foundation backfill, Damp Proof Membrane[DPM] a...
CONSTRUCTION [soil treatment, foundation backfill, Damp Proof Membrane[DPM] a...
 
Assignment thermal 2018 . ...
Assignment thermal 2018                   .                                  ...Assignment thermal 2018                   .                                  ...
Assignment thermal 2018 . ...
 
BASICS OF COMPUTER PROGRAMMING-TAKE HOME ASSIGNMENT 2018
BASICS OF COMPUTER PROGRAMMING-TAKE HOME ASSIGNMENT 2018BASICS OF COMPUTER PROGRAMMING-TAKE HOME ASSIGNMENT 2018
BASICS OF COMPUTER PROGRAMMING-TAKE HOME ASSIGNMENT 2018
 
ENGINEERING SYSTEM DYNAMICS-TAKE HOME ASSIGNMENT 2018
ENGINEERING SYSTEM DYNAMICS-TAKE HOME ASSIGNMENT 2018ENGINEERING SYSTEM DYNAMICS-TAKE HOME ASSIGNMENT 2018
ENGINEERING SYSTEM DYNAMICS-TAKE HOME ASSIGNMENT 2018
 
Hardeninig of steel (Jominy test)-CoET- udsm
Hardeninig of steel (Jominy test)-CoET- udsmHardeninig of steel (Jominy test)-CoET- udsm
Hardeninig of steel (Jominy test)-CoET- udsm
 
Ultrasonic testing report-JUNE 2018
Ultrasonic testing report-JUNE 2018Ultrasonic testing report-JUNE 2018
Ultrasonic testing report-JUNE 2018
 
Ae 219 - BASICS OF PASCHAL PROGRAMMING-2017 test manual solution
Ae 219 - BASICS OF PASCHAL PROGRAMMING-2017 test manual solutionAe 219 - BASICS OF PASCHAL PROGRAMMING-2017 test manual solution
Ae 219 - BASICS OF PASCHAL PROGRAMMING-2017 test manual solution
 
Fluid mechanics ...
Fluid mechanics                                                              ...Fluid mechanics                                                              ...
Fluid mechanics ...
 
Fluid mechanics (a letter to a friend) part 1 ...
Fluid mechanics (a letter to a friend) part 1                                ...Fluid mechanics (a letter to a friend) part 1                                ...
Fluid mechanics (a letter to a friend) part 1 ...
 
Fluids mechanics (a letter to a friend) part 1 ...
Fluids mechanics (a letter to a friend) part 1                               ...Fluids mechanics (a letter to a friend) part 1                               ...
Fluids mechanics (a letter to a friend) part 1 ...
 
Fresh concrete -building materials for engineers
Fresh concrete -building materials  for engineersFresh concrete -building materials  for engineers
Fresh concrete -building materials for engineers
 
surveying- lecture notes for engineers
surveying- lecture notes for engineerssurveying- lecture notes for engineers
surveying- lecture notes for engineers
 
Fresh concrete -building materials for engineers
Fresh concrete -building materials  for engineersFresh concrete -building materials  for engineers
Fresh concrete -building materials for engineers
 
DIESEL ENGINE POWER REPORT -AE 215 -SOURCES OF FARM POWER
DIESEL ENGINE POWER REPORT -AE 215 -SOURCES OF FARM POWERDIESEL ENGINE POWER REPORT -AE 215 -SOURCES OF FARM POWER
DIESEL ENGINE POWER REPORT -AE 215 -SOURCES OF FARM POWER
 
Farm and human power REPORT - AE 215-SOURCES OF FARM POWER
Farm and human power  REPORT - AE 215-SOURCES OF FARM POWER Farm and human power  REPORT - AE 215-SOURCES OF FARM POWER
Farm and human power REPORT - AE 215-SOURCES OF FARM POWER
 
ENGINE POWER PETROL REPORT-AE 215-SOURCES OF FARM POWER
ENGINE POWER PETROL REPORT-AE 215-SOURCES OF FARM POWERENGINE POWER PETROL REPORT-AE 215-SOURCES OF FARM POWER
ENGINE POWER PETROL REPORT-AE 215-SOURCES OF FARM POWER
 
TRACTOR POWER REPORT -AE 215 SOURCES OF FARM POWER 2018
TRACTOR POWER REPORT -AE 215  SOURCES OF FARM POWER 2018TRACTOR POWER REPORT -AE 215  SOURCES OF FARM POWER 2018
TRACTOR POWER REPORT -AE 215 SOURCES OF FARM POWER 2018
 
WIND ENERGY REPORT AE 215- 2018 SOURCES OF FARM POWER
WIND ENERGY REPORT AE 215- 2018 SOURCES OF FARM POWERWIND ENERGY REPORT AE 215- 2018 SOURCES OF FARM POWER
WIND ENERGY REPORT AE 215- 2018 SOURCES OF FARM POWER
 

Recently uploaded

call girls in Kamla Market (DELHI) 🔝 >༒9953330565🔝 genuine Escort Service 🔝✔️✔️
call girls in Kamla Market (DELHI) 🔝 >༒9953330565🔝 genuine Escort Service 🔝✔️✔️call girls in Kamla Market (DELHI) 🔝 >༒9953330565🔝 genuine Escort Service 🔝✔️✔️
call girls in Kamla Market (DELHI) 🔝 >༒9953330565🔝 genuine Escort Service 🔝✔️✔️9953056974 Low Rate Call Girls In Saket, Delhi NCR
 
The Most Excellent Way | 1 Corinthians 13
The Most Excellent Way | 1 Corinthians 13The Most Excellent Way | 1 Corinthians 13
The Most Excellent Way | 1 Corinthians 13Steve Thomason
 
Hybridoma Technology ( Production , Purification , and Application )
Hybridoma Technology  ( Production , Purification , and Application  ) Hybridoma Technology  ( Production , Purification , and Application  )
Hybridoma Technology ( Production , Purification , and Application ) Sakshi Ghasle
 
Alper Gobel In Media Res Media Component
Alper Gobel In Media Res Media ComponentAlper Gobel In Media Res Media Component
Alper Gobel In Media Res Media ComponentInMediaRes1
 
Class 11 Legal Studies Ch-1 Concept of State .pdf
Class 11 Legal Studies Ch-1 Concept of State .pdfClass 11 Legal Studies Ch-1 Concept of State .pdf
Class 11 Legal Studies Ch-1 Concept of State .pdfakmcokerachita
 
Software Engineering Methodologies (overview)
Software Engineering Methodologies (overview)Software Engineering Methodologies (overview)
Software Engineering Methodologies (overview)eniolaolutunde
 
“Oh GOSH! Reflecting on Hackteria's Collaborative Practices in a Global Do-It...
“Oh GOSH! Reflecting on Hackteria's Collaborative Practices in a Global Do-It...“Oh GOSH! Reflecting on Hackteria's Collaborative Practices in a Global Do-It...
“Oh GOSH! Reflecting on Hackteria's Collaborative Practices in a Global Do-It...Marc Dusseiller Dusjagr
 
_Math 4-Q4 Week 5.pptx Steps in Collecting Data
_Math 4-Q4 Week 5.pptx Steps in Collecting Data_Math 4-Q4 Week 5.pptx Steps in Collecting Data
_Math 4-Q4 Week 5.pptx Steps in Collecting DataJhengPantaleon
 
Mastering the Unannounced Regulatory Inspection
Mastering the Unannounced Regulatory InspectionMastering the Unannounced Regulatory Inspection
Mastering the Unannounced Regulatory InspectionSafetyChain Software
 
microwave assisted reaction. General introduction
microwave assisted reaction. General introductionmicrowave assisted reaction. General introduction
microwave assisted reaction. General introductionMaksud Ahmed
 
Separation of Lanthanides/ Lanthanides and Actinides
Separation of Lanthanides/ Lanthanides and ActinidesSeparation of Lanthanides/ Lanthanides and Actinides
Separation of Lanthanides/ Lanthanides and ActinidesFatimaKhan178732
 
Paris 2024 Olympic Geographies - an activity
Paris 2024 Olympic Geographies - an activityParis 2024 Olympic Geographies - an activity
Paris 2024 Olympic Geographies - an activityGeoBlogs
 
CARE OF CHILD IN INCUBATOR..........pptx
CARE OF CHILD IN INCUBATOR..........pptxCARE OF CHILD IN INCUBATOR..........pptx
CARE OF CHILD IN INCUBATOR..........pptxGaneshChakor2
 
SOCIAL AND HISTORICAL CONTEXT - LFTVD.pptx
SOCIAL AND HISTORICAL CONTEXT - LFTVD.pptxSOCIAL AND HISTORICAL CONTEXT - LFTVD.pptx
SOCIAL AND HISTORICAL CONTEXT - LFTVD.pptxiammrhaywood
 
mini mental status format.docx
mini    mental       status     format.docxmini    mental       status     format.docx
mini mental status format.docxPoojaSen20
 
ECONOMIC CONTEXT - LONG FORM TV DRAMA - PPT
ECONOMIC CONTEXT - LONG FORM TV DRAMA - PPTECONOMIC CONTEXT - LONG FORM TV DRAMA - PPT
ECONOMIC CONTEXT - LONG FORM TV DRAMA - PPTiammrhaywood
 
The basics of sentences session 2pptx copy.pptx
The basics of sentences session 2pptx copy.pptxThe basics of sentences session 2pptx copy.pptx
The basics of sentences session 2pptx copy.pptxheathfieldcps1
 
Presiding Officer Training module 2024 lok sabha elections
Presiding Officer Training module 2024 lok sabha electionsPresiding Officer Training module 2024 lok sabha elections
Presiding Officer Training module 2024 lok sabha electionsanshu789521
 

Recently uploaded (20)

call girls in Kamla Market (DELHI) 🔝 >༒9953330565🔝 genuine Escort Service 🔝✔️✔️
call girls in Kamla Market (DELHI) 🔝 >༒9953330565🔝 genuine Escort Service 🔝✔️✔️call girls in Kamla Market (DELHI) 🔝 >༒9953330565🔝 genuine Escort Service 🔝✔️✔️
call girls in Kamla Market (DELHI) 🔝 >༒9953330565🔝 genuine Escort Service 🔝✔️✔️
 
The Most Excellent Way | 1 Corinthians 13
The Most Excellent Way | 1 Corinthians 13The Most Excellent Way | 1 Corinthians 13
The Most Excellent Way | 1 Corinthians 13
 
Hybridoma Technology ( Production , Purification , and Application )
Hybridoma Technology  ( Production , Purification , and Application  ) Hybridoma Technology  ( Production , Purification , and Application  )
Hybridoma Technology ( Production , Purification , and Application )
 
Alper Gobel In Media Res Media Component
Alper Gobel In Media Res Media ComponentAlper Gobel In Media Res Media Component
Alper Gobel In Media Res Media Component
 
Class 11 Legal Studies Ch-1 Concept of State .pdf
Class 11 Legal Studies Ch-1 Concept of State .pdfClass 11 Legal Studies Ch-1 Concept of State .pdf
Class 11 Legal Studies Ch-1 Concept of State .pdf
 
Software Engineering Methodologies (overview)
Software Engineering Methodologies (overview)Software Engineering Methodologies (overview)
Software Engineering Methodologies (overview)
 
“Oh GOSH! Reflecting on Hackteria's Collaborative Practices in a Global Do-It...
“Oh GOSH! Reflecting on Hackteria's Collaborative Practices in a Global Do-It...“Oh GOSH! Reflecting on Hackteria's Collaborative Practices in a Global Do-It...
“Oh GOSH! Reflecting on Hackteria's Collaborative Practices in a Global Do-It...
 
_Math 4-Q4 Week 5.pptx Steps in Collecting Data
_Math 4-Q4 Week 5.pptx Steps in Collecting Data_Math 4-Q4 Week 5.pptx Steps in Collecting Data
_Math 4-Q4 Week 5.pptx Steps in Collecting Data
 
Mastering the Unannounced Regulatory Inspection
Mastering the Unannounced Regulatory InspectionMastering the Unannounced Regulatory Inspection
Mastering the Unannounced Regulatory Inspection
 
microwave assisted reaction. General introduction
microwave assisted reaction. General introductionmicrowave assisted reaction. General introduction
microwave assisted reaction. General introduction
 
Separation of Lanthanides/ Lanthanides and Actinides
Separation of Lanthanides/ Lanthanides and ActinidesSeparation of Lanthanides/ Lanthanides and Actinides
Separation of Lanthanides/ Lanthanides and Actinides
 
Model Call Girl in Bikash Puri Delhi reach out to us at 🔝9953056974🔝
Model Call Girl in Bikash Puri  Delhi reach out to us at 🔝9953056974🔝Model Call Girl in Bikash Puri  Delhi reach out to us at 🔝9953056974🔝
Model Call Girl in Bikash Puri Delhi reach out to us at 🔝9953056974🔝
 
Paris 2024 Olympic Geographies - an activity
Paris 2024 Olympic Geographies - an activityParis 2024 Olympic Geographies - an activity
Paris 2024 Olympic Geographies - an activity
 
CARE OF CHILD IN INCUBATOR..........pptx
CARE OF CHILD IN INCUBATOR..........pptxCARE OF CHILD IN INCUBATOR..........pptx
CARE OF CHILD IN INCUBATOR..........pptx
 
SOCIAL AND HISTORICAL CONTEXT - LFTVD.pptx
SOCIAL AND HISTORICAL CONTEXT - LFTVD.pptxSOCIAL AND HISTORICAL CONTEXT - LFTVD.pptx
SOCIAL AND HISTORICAL CONTEXT - LFTVD.pptx
 
mini mental status format.docx
mini    mental       status     format.docxmini    mental       status     format.docx
mini mental status format.docx
 
ECONOMIC CONTEXT - LONG FORM TV DRAMA - PPT
ECONOMIC CONTEXT - LONG FORM TV DRAMA - PPTECONOMIC CONTEXT - LONG FORM TV DRAMA - PPT
ECONOMIC CONTEXT - LONG FORM TV DRAMA - PPT
 
The basics of sentences session 2pptx copy.pptx
The basics of sentences session 2pptx copy.pptxThe basics of sentences session 2pptx copy.pptx
The basics of sentences session 2pptx copy.pptx
 
Presiding Officer Training module 2024 lok sabha elections
Presiding Officer Training module 2024 lok sabha electionsPresiding Officer Training module 2024 lok sabha elections
Presiding Officer Training module 2024 lok sabha elections
 
Staff of Color (SOC) Retention Efforts DDSD
Staff of Color (SOC) Retention Efforts DDSDStaff of Color (SOC) Retention Efforts DDSD
Staff of Color (SOC) Retention Efforts DDSD
 

1 way ANOVA(Analysis Of VAriance)

  • 1.  Silicon Genetics 2003 support@silicongenetics.com | Main 650.367.9600 | Fax 650.365.1735 1 Statistical Analysis (1-way ANOVA) Contents at a glance I. Definition and Applications..................................................................................2 II. Before Performing 1-way ANOVA - A Checklist .................................................2 III. Overview of the Statistical Analysis (1-way tests) window..................................3 IV. 1-way ANOVA test ..............................................................................................4 a. Null hypothesis..........................................................................................4 b. Number of Genes Analyzed......................................................................4 c. Test Options..............................................................................................4 d. Recommendations ....................................................................................4 e. P-value......................................................................................................4 V. Multiple Testing Corrections................................................................................5 a. Options......................................................................................................5 b. Recommendations ....................................................................................5 VI. Post Hoc Tests....................................................................................................6 a. Options......................................................................................................6 VII. Interpreting the Results.......................................................................................6 a. Results of 1-way ANOVA without Post Hoc test applied...........................6 b. Results of 1-way ANOVA with Post Hoc test applied................................7 VIII. Viewing P-values Generated .............................................................................8 IX. Most frequently asked questions and answers ...................................................9 X. References .........................................................................................................9
  • 2.  Silicon Genetics 2003 support@silicongenetics.com | Main 650.367.9600 | Fax 650.365.1735 2 I. Definition and Applications One-way analysis of variance (ANOVA) tests allow you to determine if one given factor, such as drug treatment, has a significant effect on gene expression behavior across any of the groups under study. A significant p-value resulting from a 1-way ANOVA test would indicate that a gene is differentially expressed in at least one of the groups analyzed. If there are more than two groups being analyzed, however, the 1-way ANOVA does not specifically indicate which pair of groups exhibits statistical differences. Post Hoc tests can be applied in this specific situation to determine which specific pair/pairs are differentially expressed. This document will provide the necessary information for you to perform these analyses within GeneSpring. II. Before Performing 1-way ANOVA – A Checklist 1. Do you have replicates for the experimental groups that you are about to compare? Statistical tests that compare one group to another, such as Student’s t-test/ANOVA, need variance and means for each group. Without replicates, the variance for each group cannot be computed using standard methods. However, variance for experimental groups without replicates can be computed by applying the GeneSpring Cross-Gene Error Model. If no replicates are available, apply the Error Model based on Deviation from 1 before proceeding. Please refer to the GeneSpring user manual, online tech notes, webinars, or cross-gene error model features sheet to learn more about the Cross-Gene Error Model. 2. Have you filtered out genes whose measurements are mostly unreliable? 3. Have you defined one parameter in the Experiment Parameters window indicating which sample belongs to which group? 4. If you plan to use a parametric test, have you changed the analysis mode to Log of Ratio in the Experiment Interpretation window? Parametric tests assume that means of the populations under study are normally distributed (Gaussian distribution). Interpreting your data in log mode will make data more Normal/Gaussian than ratio mode. It is mandatory that you either have replicates or apply the cross-gene error model if no replicates are available, in order to perform 1-way ANOVA for groups under study. It is also recommended (though not mandatory) that your statistical analysis be performed on a set of reliable genes, instead of all genes, on the chips.
  • 3.  Silicon Genetics 2003 support@silicongenetics.com | Main 650.367.9600 | Fax 650.365.1735 3 III. Overview of the Statistical Analysis (1-way ANOVA tests) window 1. Go to Tools toolbar and select Statistical Analysis (ANOVA) 3. In the resulting window, select the 1-Way Tests tab Figure 1: Statistical Analysis (ANOVA) 1-way tests window o Choose Gene List: Select the gene list containing the set of genes you would like to analyze. Statistical tests will be performed only on genes in the selected gene list. Again, it is recommended that the all genes gene list should not be used. Instead, use a list of genes that has been filtered to remove genes with measurements mostly in the noise range or mostly flagged Absent. o Choose Experiment: Choose the experiment and its proper interpretation to analyze. If you are using parametric tests, then your experiment interpretation should be in log-of-ratio mode. o Parameter to Test: Select the parameter and the underlying groups to compare. In the example shown above, the parameter, ‘Drug Agent’ was selected to compare the effect of different drug agents on Sprague-Dawley rats. If you would like to compare only selected conditions for this parameter, open the Select Groups Manually window, and uncheck the conditions that you would like to ignore. Only groups that are checked will be analyzed. o Test Type: Select the appropriate 1-way ANOVA test type. If you are using a parametric test, make sure your data has been log-transformed (by selecting log-of-ratio mode in experiment interpretation window). o False Discovery Rate: Indicates the overall rate of false positive. The wording for this option, and its final effect on the number of false positives, changes according to the multiple testing correction selected in the option below. o Multiple Testing Correction: This test option is not required for analysis, but it will allow you to keep the overall rate of false positive low. o Post Hoc Tests: This test option is also not required for analysis, but selecting this option will allow you to determine which pair(s) among the groups under study have expression means that are statistically different.
  • 4.  Silicon Genetics 2003 support@silicongenetics.com | Main 650.367.9600 | Fax 650.365.1735 4 IV. General background on 1-way ANOVA test a. Null Hypothesis: The hypothesis for each gene is that there is no difference in the mean gene expression intensities in the groups tested. In other words, the gene will have equal means across every group. Example of a specific null hypothesis: There is no difference in the mean gene expression intensities for the bcl-2 gene across all rat groups treated with different drug agents. b. Number of genes analyzed: All genes in the selected gene list will be analyzed. If there are 10,000 genes on your gene list (assuming you have all required measurements for each of the genes), then there are 10,000 separate analyses being performed and each gene will have a separate p-value. c. Test Options: Options Specific test used (analyzing 2 groups) Specific test used (analyzing more than 2 groups) Parametric (variances equal) Student’s T-test ANOVA Parametric (variances not equal) Welch t-test Welch ANOVA Parametric (use all available error estimate) Welch t-test using error model variances Welch ANOVA using error model variances Nonparametric Wilcoxon-Mann-Whitney test Kruskal-Wallis test d. Recommendations: • The Welch test (variances not assumed equal) is recommended for most cases. This is set as the default. • The parametric test, use all available error estimate, is similar to Welch test but has better variance estimates. To use this option, the Cross-gene error model needs to be activated in the Experiment Interpretation window. • Student’s t-test/ANOVA (variances assumed equal) should be used if very few replicates are available, or if some groups being analyzed do not have replicates. • Nonparametric test makes the least assumptions about your data but should be used only when there are more than 5 replicates per group. e. P-value Indicates the probability of getting a mean difference between the groups as high as what is observed by chance. The lower the p-value, the more significant the difference between the groups.
  • 5.  Silicon Genetics 2003 support@silicongenetics.com | Main 650.367.9600 | Fax 650.365.1735 5 V. Multiple Testing Corrections (MTC): When testing a set of genes for statistical significance across various groups, some of the genes may be falsely considered as statistically significant. If 10,000 genes are tested for differential expression between groups, with a significance p-value cutoff of 0.05, then the expected level of genes to be identified as significant by chance alone, even if there is no true differential expression, is 500 genes: 10,000 x 0.05 = 500 genes Possible false positives = (# of genes) (p-value cutoff) The purpose of a multiple testing correction is to keep the overall error rate/false positives to less than the user- specified p-value cutoff, even if thousands of genes are being analyzed. a. Options Test Type Type of Error control Genes identified by chance after MTC Bonferroni If testing 10,000 genes with p-cutoff equals 0.05, then expects 0.05 genes to be significant by chance Bonferroni step-down (Holm) Family-wise error rate Same as above Westfall and Young Permutation Same as above Benjamini and Hochberg False Discovery Rate If testing 10,000 genes with p-cutoff equals 0.05, then possible genes identified by chance is 5% of genes that passed restriction (considered statistically significant) b. Recommendations: The recommended correction for multiple testing is Benjamini and Hochberg False Discovery Rate procedure. This procedure is the least stringent of all the methods mentioned above, but it provides a good balance between discovery of statistically significant differences in gene expression and protection against false positives (Type I error). The stringency of MTC procedures mentioned increases as the number of genes being tested (genes on selected gene list) increases. The following example illustrates this situation: If: number of genes on gene list = 10,000 p-value cutoff = 0.05 p-value for Gene A without MTC equals 0.000006 If the Bonferroni multiple testing correction was applied to this analysis, then the p- value for Gene A with MTC equals 0.06: P–value with MTC = 10,000 x 0.000006 It is therefore recommended that you perform statistical analysis on a list of genes that have been filtered for unreliable genes since the multiple testing corrections are directly affected by the number of genes on your gene list. For a more comprehensive discussion on multiple testing, see the Multiple Testing Corrections Features Sheet, refer to the user manual, or attend our Statistics workshop.
  • 6.  Silicon Genetics 2003 support@silicongenetics.com | Main 650.367.9600 | Fax 650.365.1735 6 VI. Post Hoc Tests: 1-way ANOVA determines whether a gene is differentially expressed in any of the conditions tested. However, it does not indicate which specific group pair(s) are the ones where statistical differences occur. Post Hoc Test can be used in conjunction with ANOVA to determine which specific group pair(s) are statistically different from each other. a. Options: Test Name How it works Tukey All means for each condition are ranked in order of magnitude; group with lowest mean gets a ranking of 1. The pairwise differences between means, starting with the largest mean compared to the smallest mean, are tabulated between each group pair and divided by the standard error. This value, q, is compared to a Studentized range critical value. If q is larger than the critical value, then the expression between that group pair is considered to be statistically different. Student- Newman-Keuls (SNK) test: This test is similar to the Tukey test, except with regard to how the critical value is determined. All q’s in Tukey’s test are compared to the same critical value determined for that experiment; whereas all q’s determined from SNK test are compared to a different critical value. This makes the SNK test slightly less conservative than the Tukey test. ** There are nonparametric and parametric versions of Tukey and Student-Newman-Keuls test. GeneSpring will apply the correct option based on whether a parametric or nonparametric ANOVA test was chosen. VII. Interpreting the Results a. Results from 1-way ANOVA without Post Hoc test applied Figure 2 below shows an example of a 1-way ANOVA result without a Post Hoc test applied. The Notes section indicates what setting was used for this analysis and the percentage of genes that could have been identified by chance. The genes in this gene list were found to have measurements considered statistically different across at least one group-pair. You cannot tell which exact group was differentially expressed from this analysis. Figure 2: 1-way ANOVA result
  • 7.  Silicon Genetics 2003 support@silicongenetics.com | Main 650.367.9600 | Fax 650.365.1735 7 b. Results of 1-way ANOVA with Post Hoc test applied 1-way ANOVA with Post Hoc test applied will return the window shown in Figure 2, and also the windows shown in Figures 3 and 4 below. Figure 3: 1-way ANOVA with Post Hoc test, Summary by Gene tab This window lists all the genes considered differentially expressed by statistical criteria. Groups with the highest color differential have the most significant difference. Groups with the same color show no statistical difference for that gene. A group colored grey is considered to be unknown because the significance of its mean difference cannot be determined with confidence from the test used.
  • 8.  Silicon Genetics 2003 support@silicongenetics.com | Main 650.367.9600 | Fax 650.365.1735 8 Figure 4: 1-way ANOVA with Post Hoc test, Summary by Groups tab This window indicates the total number of genes that are statistically differentially expressed between the groups being compared in the matrix. Greater color saturation indicates greater difference (or similarity). Total number of genes analyzed is shown in the box colored grey. Gene list can be generated from each, or combination of the boxes, by highlighting the appropriate boxes and selecting Make List of Union or Make List of Intersection. VIII. Viewing P-values Generated The associated p-value for the genes on this gene list could be viewed in GeneSpring using the following methods: 1. Gene List Inspector: Double-click on the selected gene list to open up the Gene List Inspector window. P values are shown under the P-value columns. 2. Ordered List: Select the gene list and go to View ⇒ Ordered List. Genes are displayed according to p-values: smallest p-values are on the left-hand side, highest p-values are on the right-hand side. 3. Export out of GeneSpring: Highlight the gene list and go to Edit ⇒ Copy ⇒ Copy Annotated Gene List and select to export out Gene List Associated Values.
  • 9.  Silicon Genetics 2003 support@silicongenetics.com | Main 650.367.9600 | Fax 650.365.1735 9 IX. Most frequently asked questions and answers Q. Why do I get an error message saying I have no degrees of freedom (such as the message shown below)? A. This error message indicates that there are no replicates in the groups being compared. The degree of freedom is a mathematical way of representing the number of replicates/samples. Zero degrees of freedom indicates there are no replicates, and thus a 1-way ANOVA CANNOT be performed. If no replicates are available, but you would still like to perform a statistical analysis, then the Cross-Gene Error Model needs to be activated and the “Parametric test, use all available error estimate” must be used. If you do have replicates but get this error message, then check your parameter to ascertain that it was set up correctly to indicate which samples are considered replicates. GeneSpring will not automatically know which samples are replicates unless specified correctly in the Experiment Parameter window and selected in the Parameter to Test field. Q. Why do I get zero genes passing the restriction when I perform statistical analysis? A. There can be several explanations for this observation: i. Analysis criteria might be too stringent (low p-value cut-off and conservative multiple testing correction) ii. Not enough replicates in each group resulting in insufficient power to detect real differences between groups under study iii. Biologically, there may not be differential gene expression. X. References Zar, J. (1999) Biostatistical Analysis. (4th ed.) Upper Saddle River, NJ, Prentice Hall.