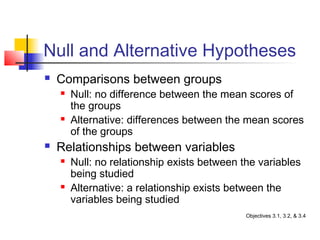
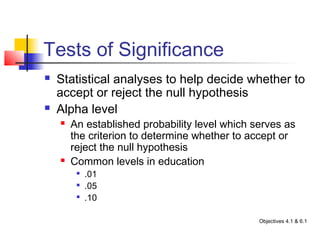
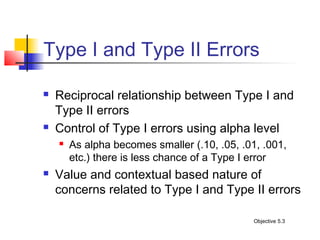
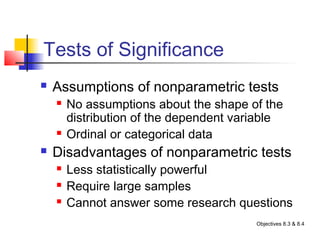
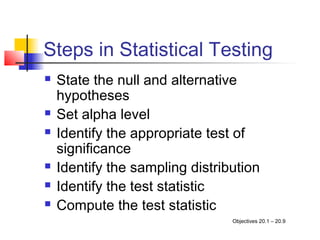
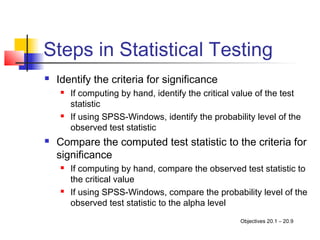
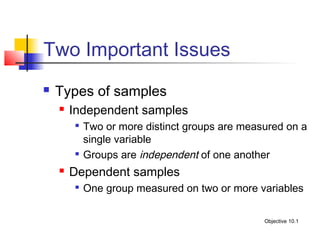
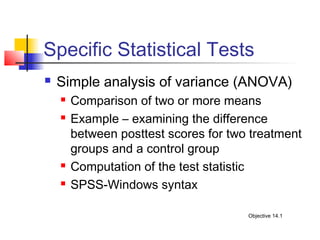
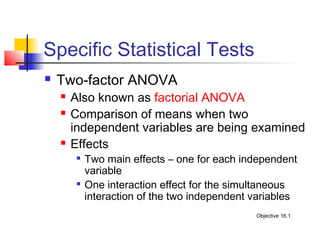
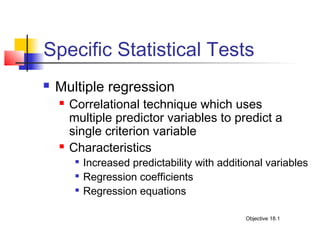
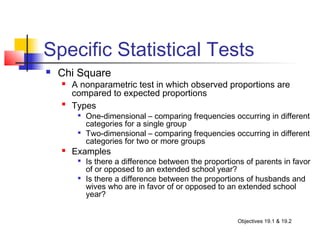
Educational Research

           Chapter 12
      Inferential Statistics

    Gay, Mills, and Airasian
Topics Discussed in this Chapter
   Concepts underlying inferential statistics
   Types of inferential statistics
       Parametric
         
             T tests
         
             ANOVA
                  One-way
                  Factorial
                  Post-hoc comparisons
            Multiple regression
            ANCOVA
       Nonparametric
         
             Chi square
Important Perspectives
   Inferential statistics
       Allow researchers to generalize to a population of
        individuals based on information obtained from a
        sample of those individuals
       Assess whether the results obtained from a
        sample are the same as those that would have
        been calculated for the entire population
   Probabilistic nature of inferential analyses
Underlying Concepts
   Sampling distributions
   Standard error
   Null and alternative hypotheses
   Tests of significance
   Type I and Type II errors
   One-tailed and two-tailed tests
   Degrees of freedom
   Tests of significance
Sampling Distributions
   A distribution of sample statistics
       A distribution of mean scores
       A distribution of the differences between two mean scores
       A distribution of the ratio of two variances
   Known statistical properties of sampling distributions
       The mean of the sampling distribution of means is an
        excellent estimate of the population mean
       The standard error of the mean is an excellent estimate of
        the “standard deviation” of the sampling distribution of the
        mean

                                                Objectives 1.1 & 1.2
Standard Error
   Sampling error – the expected random or chance
    variation of means in sampling distributions
   The calculation of standard errors to estimate
    sampling error
       Standard error of the mean
            Formula
            Dependency on sample size with n in the denominator
                  The larger the sample, the smaller the standard error of the mean
       Standard error of the differences between two means


                                                               Objectives 1.2, 1.3, & 1.4
Null and Alternative Hypotheses
   The null hypothesis represents a
    statistical tool important to inferential
    tests of significance
   The alternative hypothesis usually
    represents the research hypothesis
    related to the study
Null and Alternative Hypotheses
   Comparisons between groups
       Null: no difference between the mean scores of
        the groups
       Alternative: differences between the mean scores
        of the groups
   Relationships between variables
       Null: no relationship exists between the variables
        being studied
       Alternative: a relationship exists between the
        variables being studied
                                              Objectives 3.1, 3.2, & 3.4
Null and Alternative Hypotheses
   Acceptance of the null                Rejection of the null
    hypothesis                             hypothesis
       The difference between
                                              The difference between
                                               groups is so large it can
        groups is too small to
                                               be attributed to
        attribute it to anything but           something other than
        chance                                 chance (e.g.,
       The relationship between               experimental treatment)
        variables is too small to             The relationship between
        attribute it to anything but           variables is so large it
        chance                                 can be attributed to
                                               something other than
                                               chance (e.g., a real
                                               relationship)
                                                           Objectives 3.3 & 4.2
Tests of Significance
   Statistical analyses to help decide whether to
    accept or reject the null hypothesis
   Alpha level
       An established probability level which serves as
        the criterion to determine whether to accept or
        reject the null hypothesis
       Common levels in education
         
             .01
         
             .05
         
             .10

                                                Objectives 4.1 & 6.1
Tests of Significance
   Specific tests are used in specific
    situations based on the number of
    samples and the statistics of interest
       One-sample tests of the mean, variance,
        proportions, correlations, etc.
       Two-sample tests of means, variances,
        proportions, correlations, etc.

                                        Objective 4.1
Type I and Type II Errors
   Correct decisions
       The null hypothesis is true and it is accepted
       The null hypothesis is false and it is rejected
   Incorrect decisions
       Type I error - the null hypothesis is true and it is
        rejected
       Type II error - the null hypothesis is false and it is
        accepted

                                                 Objectives 5.1 & 5.2
Type I and Type II Errors

   Reciprocal relationship between Type I and
    Type II errors
   Control of Type I errors using alpha level
       As alpha becomes smaller (.10, .05, .01, .001,
        etc.) there is less chance of a Type I error
   Value and contextual based nature of
    concerns related to Type I and Type II errors

                                               Objective 5.3
One-Tailed and Two-Tailed Tests
   One-tailed – an anticipated outcome in a specific
    direction
       Treatment group is significantly higher than the control group
       Treatment group is significantly lower than the control group
   Two-tailed – anticipated outcome not directional
       Treatment and control groups are equal
   Ample justification needed for using one-tailed tests


                                                     Objectives 7.1 & 7.2
Degrees of Freedom
   Statistical artifacts that affect the
    computational formulas used in tests of
    significance
   Used when entering statistical tables to
    establish the critical values of the test
    statistics
Tests of Significance


   Two types
       Parametric
       Nonparametric
Tests of Significance
   Four assumptions of parametric tests
       Normal distribution of the dependent variable
       Interval or ratio data
       Independence of subjects
       Homogeneity of variance
   Advantages of parametric tests
       More statistically powerful
       More versatile
                                             Objectives 8.1 & 8.2
Tests of Significance
   Assumptions of nonparametric tests
       No assumptions about the shape of the
        distribution of the dependent variable
       Ordinal or categorical data
   Disadvantages of nonparametric tests
       Less statistically powerful
       Require large samples
       Cannot answer some research questions
                                         Objectives 8.3 & 8.4
Types of Inferential Statistics

   Two issues discussed
       Steps involved in testing for significance
       Types of tests
Steps in Statistical Testing
   State the null and alternative
    hypotheses
   Set alpha level
   Identify the appropriate test of
    significance
   Identify the sampling distribution
   Identify the test statistic
   Compute the test statistic
                                 Objectives 20.1 – 20.9
Steps in Statistical Testing
   Identify the criteria for significance
       If computing by hand, identify the critical value of the test
        statistic
       If using SPSS-Windows, identify the probability level of the
        observed test statistic
   Compare the computed test statistic to the criteria for
    significance
       If computing by hand, compare the observed test statistic to
        the critical value
       If using SPSS-Windows, compare the probability level of the
        observed test statistic to the alpha level
                                                     Objectives 20.1 – 20.9
Steps in Statistical Testing
   Accept or reject the null hypothesis
       Accept
         
             The observed test statistic is smaller than the critical
             value
         
             The observed probability level of the observed statistic is
             smaller than alpha
       Reject
         
             The observed test statistic is larger than the critical value
         
             The observed probability level of the observed statistic is
             smaller than alpha
                                                              Objective 20.9
Two Important Issues
   Types of samples
       Independent samples
           Two or more distinct groups are measured on a
            single variable
           Groups are independent of one another
       Dependent samples
           One group measured on two or more variables

                                                Objective 10.1
Two Important Issues
   Gain scores
       Subtracting the pretest scores from the posttest
        scores
       Serious problems with this analysis
            Each subject does not have the same opportunity for
             “gain”
                  A person scoring close to the top of the test doesn’t have
                   as much to gain as someone scoring in the middle of the
                   test
            Low reliability
       ANCOVA as an appropriate analysis
                                                             Objectives 13.1 & 13.2
Specific Statistical Tests
   T test for independent samples
       Comparison of two means from independent
        samples
            Samples in which the subjects in one group are not
             related to the subjects in the other group
       Example - examining the difference between the
        mean pretest scores for an experimental and
        control group
       Computation of the test statistic
       SPSS-Windows syntax
                                                       Objectives 9.1 & 11.1
Specific Statistical Tests
   T test for dependent samples
       Comparison of two means from dependent
        samples
         
             One group is selected and mean scores are compared
             for two variables
         
             Two groups are compared but the subjects in each group
             are matched
       Example – examining the difference between
        pretest and posttest mean scores for a single
        class of students
       Computation of the test statistic
       SPSS-Windows syntax
                                                       Objectives 9.1 & 12.1
Specific Statistical Tests
   Simple analysis of variance (ANOVA)
       Comparison of two or more means
       Example – examining the difference
        between posttest scores for two treatment
        groups and a control group
       Computation of the test statistic
       SPSS-Windows syntax

                                       Objective 14.1
Specific Statistical Tests
   Multiple comparisons
       Omnibus ANOVA results
         
             Significant difference indicates whether a difference
             exists across all pairs of scores
         
             Need to know which specific pairs are different
       Types of tests
            A priori contrasts
         
             Post-hoc comparisons
                  Scheffe
                  Tukey HSD
                  Duncan’s Multiple Range
         
             Conservative or liberal control of alpha
                                                        Objectives 15.1 & 15.2
Specific Statistical Tests
   Multiple comparisons (continued)
       Example – examining the difference
        between mean scores for Groups 1 & 2,
        Groups 1 & 3, and Groups 2 & 3
       Computation of the test statistic
       SPSS-Windows syntax


                                       Objective 15.3
Specific Statistical Tests
   Two-factor ANOVA
       Also known as factorial ANOVA
       Comparison of means when two
        independent variables are being examined
       Effects
         
             Two main effects – one for each independent
             variable
         
             One interaction effect for the simultaneous
             interaction of the two independent variables
                                                Objective 16.1
Specific Statistical Tests

   Two-factor ANOVA (continued)
       Example – examining the mean score
        differences for male and female students in
        an experimental or control group
       Computation of the test statistic
       SPSS-Windows syntax

                                         Objective 16.1
Specific Statistical Tests
   Analysis of covariance (ANCOVA)
       Comparison of two or more means with statistical
        control of an extraneous variable
       Use of a covariate
         
             Advantages
                  Statistically controlling for initial group differences (i.e.,
                   equating the groups)
                  Increased statistical power
         
             Pretest is typically the covariate
       Computation of the test statistic
       SPSS-Windows syntax
                                                                   Objectives 17.1 & 17.2
Specific Statistical Tests
   Multiple regression
       Correlational technique which uses
        multiple predictor variables to predict a
        single criterion variable
       Characteristics
            Increased predictability with additional variables
            Regression coefficients
            Regression equations

                                                 Objective 18.1
Specific Statistical Tests

   Multiple regression (continued)
       Example – predicting college freshmen’s
        GPA on the basis of their ACT scores, high
        school GPA, and high school rank in class
       Computation of the test statistic
       SPSS-Windows syntax

                                          Objective 18.2
Specific Statistical Tests
   Chi Square
       A nonparametric test in which observed proportions are
        compared to expected proportions
    
        Types
            One-dimensional – comparing frequencies occurring in different
             categories for a single group
            Two-dimensional – comparing frequencies occurring in different
             categories for two or more groups
       Examples
            Is there a difference between the proportions of parents in favor
             of or opposed to an extended school year?
            Is there a difference between the proportions of husbands and
             wives who are in favor of or opposed to an extended school
             year?


                                                        Objectives 19.1 & 19.2
Specific Statistical Tests
   Chi Square (continued)
       Computation of the test statistic
       SPSS-Windows syntax
         
             One-dimensional uses Nonparametric Tests
             procedures
            Two-dimensional uses Crosstabs procedures


                                            Objectives 19.1 & 19.2

Ch12

  • 1.
    Educational Research Chapter 12 Inferential Statistics Gay, Mills, and Airasian
  • 2.
    Topics Discussed inthis Chapter  Concepts underlying inferential statistics  Types of inferential statistics  Parametric  T tests  ANOVA  One-way  Factorial  Post-hoc comparisons  Multiple regression  ANCOVA  Nonparametric  Chi square
  • 3.
    Important Perspectives  Inferential statistics  Allow researchers to generalize to a population of individuals based on information obtained from a sample of those individuals  Assess whether the results obtained from a sample are the same as those that would have been calculated for the entire population  Probabilistic nature of inferential analyses
  • 4.
    Underlying Concepts  Sampling distributions  Standard error  Null and alternative hypotheses  Tests of significance  Type I and Type II errors  One-tailed and two-tailed tests  Degrees of freedom  Tests of significance
  • 5.
    Sampling Distributions  A distribution of sample statistics  A distribution of mean scores  A distribution of the differences between two mean scores  A distribution of the ratio of two variances  Known statistical properties of sampling distributions  The mean of the sampling distribution of means is an excellent estimate of the population mean  The standard error of the mean is an excellent estimate of the “standard deviation” of the sampling distribution of the mean Objectives 1.1 & 1.2
  • 6.
    Standard Error  Sampling error – the expected random or chance variation of means in sampling distributions  The calculation of standard errors to estimate sampling error  Standard error of the mean  Formula  Dependency on sample size with n in the denominator  The larger the sample, the smaller the standard error of the mean  Standard error of the differences between two means Objectives 1.2, 1.3, & 1.4
  • 7.
    Null and AlternativeHypotheses  The null hypothesis represents a statistical tool important to inferential tests of significance  The alternative hypothesis usually represents the research hypothesis related to the study
  • 8.
    Null and AlternativeHypotheses  Comparisons between groups  Null: no difference between the mean scores of the groups  Alternative: differences between the mean scores of the groups  Relationships between variables  Null: no relationship exists between the variables being studied  Alternative: a relationship exists between the variables being studied Objectives 3.1, 3.2, & 3.4
  • 9.
    Null and AlternativeHypotheses  Acceptance of the null  Rejection of the null hypothesis hypothesis  The difference between  The difference between groups is so large it can groups is too small to be attributed to attribute it to anything but something other than chance chance (e.g.,  The relationship between experimental treatment) variables is too small to  The relationship between attribute it to anything but variables is so large it chance can be attributed to something other than chance (e.g., a real relationship) Objectives 3.3 & 4.2
  • 10.
    Tests of Significance  Statistical analyses to help decide whether to accept or reject the null hypothesis  Alpha level  An established probability level which serves as the criterion to determine whether to accept or reject the null hypothesis  Common levels in education  .01  .05  .10 Objectives 4.1 & 6.1
  • 11.
    Tests of Significance  Specific tests are used in specific situations based on the number of samples and the statistics of interest  One-sample tests of the mean, variance, proportions, correlations, etc.  Two-sample tests of means, variances, proportions, correlations, etc. Objective 4.1
  • 12.
    Type I andType II Errors  Correct decisions  The null hypothesis is true and it is accepted  The null hypothesis is false and it is rejected  Incorrect decisions  Type I error - the null hypothesis is true and it is rejected  Type II error - the null hypothesis is false and it is accepted Objectives 5.1 & 5.2
  • 13.
    Type I andType II Errors  Reciprocal relationship between Type I and Type II errors  Control of Type I errors using alpha level  As alpha becomes smaller (.10, .05, .01, .001, etc.) there is less chance of a Type I error  Value and contextual based nature of concerns related to Type I and Type II errors Objective 5.3
  • 14.
    One-Tailed and Two-TailedTests  One-tailed – an anticipated outcome in a specific direction  Treatment group is significantly higher than the control group  Treatment group is significantly lower than the control group  Two-tailed – anticipated outcome not directional  Treatment and control groups are equal  Ample justification needed for using one-tailed tests Objectives 7.1 & 7.2
  • 15.
    Degrees of Freedom  Statistical artifacts that affect the computational formulas used in tests of significance  Used when entering statistical tables to establish the critical values of the test statistics
  • 16.
    Tests of Significance  Two types  Parametric  Nonparametric
  • 17.
    Tests of Significance  Four assumptions of parametric tests  Normal distribution of the dependent variable  Interval or ratio data  Independence of subjects  Homogeneity of variance  Advantages of parametric tests  More statistically powerful  More versatile Objectives 8.1 & 8.2
  • 18.
    Tests of Significance  Assumptions of nonparametric tests  No assumptions about the shape of the distribution of the dependent variable  Ordinal or categorical data  Disadvantages of nonparametric tests  Less statistically powerful  Require large samples  Cannot answer some research questions Objectives 8.3 & 8.4
  • 19.
    Types of InferentialStatistics  Two issues discussed  Steps involved in testing for significance  Types of tests
  • 20.
    Steps in StatisticalTesting  State the null and alternative hypotheses  Set alpha level  Identify the appropriate test of significance  Identify the sampling distribution  Identify the test statistic  Compute the test statistic Objectives 20.1 – 20.9
  • 21.
    Steps in StatisticalTesting  Identify the criteria for significance  If computing by hand, identify the critical value of the test statistic  If using SPSS-Windows, identify the probability level of the observed test statistic  Compare the computed test statistic to the criteria for significance  If computing by hand, compare the observed test statistic to the critical value  If using SPSS-Windows, compare the probability level of the observed test statistic to the alpha level Objectives 20.1 – 20.9
  • 22.
    Steps in StatisticalTesting  Accept or reject the null hypothesis  Accept  The observed test statistic is smaller than the critical value  The observed probability level of the observed statistic is smaller than alpha  Reject  The observed test statistic is larger than the critical value  The observed probability level of the observed statistic is smaller than alpha Objective 20.9
  • 23.
    Two Important Issues  Types of samples  Independent samples  Two or more distinct groups are measured on a single variable  Groups are independent of one another  Dependent samples  One group measured on two or more variables Objective 10.1
  • 24.
    Two Important Issues  Gain scores  Subtracting the pretest scores from the posttest scores  Serious problems with this analysis  Each subject does not have the same opportunity for “gain”  A person scoring close to the top of the test doesn’t have as much to gain as someone scoring in the middle of the test  Low reliability  ANCOVA as an appropriate analysis Objectives 13.1 & 13.2
  • 25.
    Specific Statistical Tests  T test for independent samples  Comparison of two means from independent samples  Samples in which the subjects in one group are not related to the subjects in the other group  Example - examining the difference between the mean pretest scores for an experimental and control group  Computation of the test statistic  SPSS-Windows syntax Objectives 9.1 & 11.1
  • 26.
    Specific Statistical Tests  T test for dependent samples  Comparison of two means from dependent samples  One group is selected and mean scores are compared for two variables  Two groups are compared but the subjects in each group are matched  Example – examining the difference between pretest and posttest mean scores for a single class of students  Computation of the test statistic  SPSS-Windows syntax Objectives 9.1 & 12.1
  • 27.
    Specific Statistical Tests  Simple analysis of variance (ANOVA)  Comparison of two or more means  Example – examining the difference between posttest scores for two treatment groups and a control group  Computation of the test statistic  SPSS-Windows syntax Objective 14.1
  • 28.
    Specific Statistical Tests  Multiple comparisons  Omnibus ANOVA results  Significant difference indicates whether a difference exists across all pairs of scores  Need to know which specific pairs are different  Types of tests  A priori contrasts  Post-hoc comparisons  Scheffe  Tukey HSD  Duncan’s Multiple Range  Conservative or liberal control of alpha Objectives 15.1 & 15.2
  • 29.
    Specific Statistical Tests  Multiple comparisons (continued)  Example – examining the difference between mean scores for Groups 1 & 2, Groups 1 & 3, and Groups 2 & 3  Computation of the test statistic  SPSS-Windows syntax Objective 15.3
  • 30.
    Specific Statistical Tests  Two-factor ANOVA  Also known as factorial ANOVA  Comparison of means when two independent variables are being examined  Effects  Two main effects – one for each independent variable  One interaction effect for the simultaneous interaction of the two independent variables Objective 16.1
  • 31.
    Specific Statistical Tests  Two-factor ANOVA (continued)  Example – examining the mean score differences for male and female students in an experimental or control group  Computation of the test statistic  SPSS-Windows syntax Objective 16.1
  • 32.
    Specific Statistical Tests  Analysis of covariance (ANCOVA)  Comparison of two or more means with statistical control of an extraneous variable  Use of a covariate  Advantages  Statistically controlling for initial group differences (i.e., equating the groups)  Increased statistical power  Pretest is typically the covariate  Computation of the test statistic  SPSS-Windows syntax Objectives 17.1 & 17.2
  • 33.
    Specific Statistical Tests  Multiple regression  Correlational technique which uses multiple predictor variables to predict a single criterion variable  Characteristics  Increased predictability with additional variables  Regression coefficients  Regression equations Objective 18.1
  • 34.
    Specific Statistical Tests  Multiple regression (continued)  Example – predicting college freshmen’s GPA on the basis of their ACT scores, high school GPA, and high school rank in class  Computation of the test statistic  SPSS-Windows syntax Objective 18.2
  • 35.
    Specific Statistical Tests  Chi Square  A nonparametric test in which observed proportions are compared to expected proportions  Types  One-dimensional – comparing frequencies occurring in different categories for a single group  Two-dimensional – comparing frequencies occurring in different categories for two or more groups  Examples  Is there a difference between the proportions of parents in favor of or opposed to an extended school year?  Is there a difference between the proportions of husbands and wives who are in favor of or opposed to an extended school year? Objectives 19.1 & 19.2
  • 36.
    Specific Statistical Tests  Chi Square (continued)  Computation of the test statistic  SPSS-Windows syntax  One-dimensional uses Nonparametric Tests procedures  Two-dimensional uses Crosstabs procedures Objectives 19.1 & 19.2