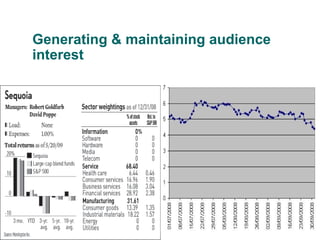
Business Communication
Using Visual Aids
The purpose of visual aids
1. Generating & holding audience
interest
2. Increasing audience recall
3. Clarifying & emphasizing information
4. Adding credibility & persuasiveness
Generating & maintaining audience
interest
Increasing audience recall
 The more senses involved in a
communication transaction the more likely
the receiver is to understand the sender’s
message and remember it.
Clarifying Information
Adding credibility & persuasiveness
 Oral presentation with visual support is more
persuasive and more effecitve from the
audience’s viewpoint than are those without
visual support. The audience is more likely to
approve the ideas of the person’s using
visual aids.
Why use visual aids?
Many possible types of visual aids
 Overhead Transparencies (OHT, Acetate)
 Slides
 Flip Charts and Posters
 Objects and Models
 Handouts
 Whiteboards and Chalkboards
 Computer Assisted Audiovisuals (PPT)
 Audio or Video (tapes, CDs, DVDs…)
Flip Charts
 For briefing small
groups
 Can be used to record
audience comments
and questions
 Not suitable for a use in
large audience settings
 Useful in extended presentations where
ideas are changed through interaction with
the audience
 Vital in group brainstorming sessions where
ideas must be recorded, narrowed, and
solidified in front of the group
 Make sure the information is large enough for
the entire audience to see
Flip Charts
Posters
 Smaller audience sizes
(except for marketing)
 Posters are permanent
and removable
 Eloberate posters
require extensive
preparation and may be
costly
Posters and Flipcharts
Advantages
 Can be placed close to audiences
 They can provide interactive communication
 They can stand alone without explanation
 They can remain displayed to remind
listeners of key concepts
Overhead Transparencies
 For audience of 20 to
50 people
 Necessity when
giving a presentation
in a room not
equipped with a
computer projection
system
 Old fashioned in
some industries
Transparencies
 Advantages of transparencies
– Projection equipment is simple and
dependable
– Speakers need not turn their backs to the
audience
– They work in well-lit rooms
– Easily stored and carried
– Easily produced
– Can be eliminated during the speech
Transparencies
 Guidelines
 Number transparencies
 Maintain eye contact with the audience
 Point on the projector, not screen
 Keep relevant information hidden until
needed
 Turn projector light off when not in use
Handouts
 Their use allows speakers to go into depth on
some points while skimming over others
 They can be especially useful for complex
presentations
 They provide something for audience
members to take with them for future reference
 Handouts give a sense of security and
ownership to speakers
Handouts
 Guidelines
 Be sure about the quality
 Include helpful lists, maps, tables etc
 Be sure thay are up to date
 Decide how to deal with them during the
presentation
Computer presentations (ppt)
 Many types of audiences
 Inexpensive and customizable
 Needs to be well-prepared
Tips for using slides
 Use bullet statements when possible (no
more than 7 per slide)
 Avoid too much verbiage and clutter
 Keep it simple (less is more)
 Keep sound effects to a minimum
Tips for using slides
Only use long quotes and/or sentences if
necessary (in which case, bring in each
sentence one at a time)
Avoid turning back to audience and reading
too much
Tips for using slides
Give handouts of PowerPoint slides
before speech for audience note-taking
(optional)
Use slides as your notes or use
PowerPoint handouts for additional
notes
Tips for using slides
Use graphs for important statistics
(particularly when referring to dramatic
gains or losses)
Reduce walking in front of projector
Tips for using slides
Build suspense for topic by leaving first
slide blank
Avoid being tied to the mouse
Use pictures as metaphors or similes
Tips for using slides
Use slides as punch lines for humor
Use pictures and/or clipart on slides to
enhance the mood
Tips for using slides
Avoid putting too much verbiage
around pictures (Keep it simple)
Apply transitions and animations for
effect (Don’t overdo. Decide what to
emphasize.)
Tips for using slides
 Maintain consistency (For example, use
design templates)
 Be prepared for technical difficulties (Always
have a plan B)
Which visual aid to choose?
It depends on
– Your goal
– Your audience
– Your budget
– Available technology
Tips for effective use of visual aids
 Give handouts before or after speech only
if not a distraction
 Explain the handout’s relevancy to topic
 Keep visual aids clear and simple
 Avoid lulls while you demonstrate
Tips for effective use of visual aids
 Practice using visual aids
 Make visual aids easy for audience to see
 Set up before and discuss after the
showing of video clips
Tips for effective use of visual aids
 Use pictures or other visual aids to spark
a story (there are stories in objects)
 Avoid using animals and/or children if
distracting
 Demonstrate a task by using how-to-
objects
Visual Aid Categories
Figures (charts)
Tables
Pictures and diagrams
Charts
In a bar chart, the height or length of
each bar represents the frequency of
occurence..
Bar Graphs
 Include no more than six bars
 Label the bars themselves
 Label the horizontal and vertical axes
0
20
40
60
80
100
1st Qtr 2nd Qtr 3rd Qtr 4 th Qtr
East
West
North
Bar Chart
Bar Chart (data reordered)
Charts
The most frequently used diagram to
emphasise the proportion or share of
occurences is the pie chart. A pie
chart is divided into proportional
segments according to the share each
has of the total value.
Pie Charts
 Avoid slicing the pie into more than seven slices
 Label the pie pieces at or near the slice
1st Qt r
2 n d Qt r
3 rd Qt r
4 t h Qt r
Ice Rink Expenses
Staff 34%
Refrigeration 27%
Gas 8%
Snack bar 6%
Maintenance 4%
Water 3%
Sewer 2%
Office supplies
2%
Too many
slices
Too Much Emphasis on Service, Too
Little on R & D
Production
Marketing
Sales
Service Research & Development
PR
Pie Chart
Graphs
Most suitable diagram for exploring the
trend is a line graph in which your
data values for each time period are
joined with a line to represent the trend.
U.S. Slowdown Produces Downturns in
Other Countries
-2
-1
0
1
2
3
4
5
6
7
U.S.
England
Germany
Ireland
Thailand
Japan
Korea
4th 2006 1st 2007 2nd 2007 3rd 2007
% GDP
Growth
How would you
fix this graph?
U.S. Slowdown Produces Downturns in
Other Countries
0
1
2
3
4
5
6
4th 2006 1st 2007 2nd 2007 3rd 2007
U.S.
Europe
Asia
% GDP
Growth
Europe = England, Ireland, and Germany
Asia = Thailand, Japan, and Korea
Line Graph
EXAMPLES
Example of a
bad presentation
Stand-up
Example of a bad
presentation 1

visual_aids.ppt For Business Communication

  • 1.
  • 2.
    The purpose ofvisual aids 1. Generating & holding audience interest 2. Increasing audience recall 3. Clarifying & emphasizing information 4. Adding credibility & persuasiveness
  • 3.
    Generating & maintainingaudience interest
  • 4.
    Increasing audience recall The more senses involved in a communication transaction the more likely the receiver is to understand the sender’s message and remember it.
  • 5.
  • 6.
    Adding credibility &persuasiveness  Oral presentation with visual support is more persuasive and more effecitve from the audience’s viewpoint than are those without visual support. The audience is more likely to approve the ideas of the person’s using visual aids.
  • 8.
  • 9.
    Many possible typesof visual aids  Overhead Transparencies (OHT, Acetate)  Slides  Flip Charts and Posters  Objects and Models  Handouts  Whiteboards and Chalkboards  Computer Assisted Audiovisuals (PPT)  Audio or Video (tapes, CDs, DVDs…)
  • 10.
    Flip Charts  Forbriefing small groups  Can be used to record audience comments and questions  Not suitable for a use in large audience settings
  • 11.
     Useful inextended presentations where ideas are changed through interaction with the audience  Vital in group brainstorming sessions where ideas must be recorded, narrowed, and solidified in front of the group  Make sure the information is large enough for the entire audience to see Flip Charts
  • 12.
    Posters  Smaller audiencesizes (except for marketing)  Posters are permanent and removable  Eloberate posters require extensive preparation and may be costly
  • 13.
    Posters and Flipcharts Advantages Can be placed close to audiences  They can provide interactive communication  They can stand alone without explanation  They can remain displayed to remind listeners of key concepts
  • 14.
    Overhead Transparencies  Foraudience of 20 to 50 people  Necessity when giving a presentation in a room not equipped with a computer projection system  Old fashioned in some industries
  • 15.
    Transparencies  Advantages oftransparencies – Projection equipment is simple and dependable – Speakers need not turn their backs to the audience – They work in well-lit rooms – Easily stored and carried – Easily produced – Can be eliminated during the speech
  • 16.
    Transparencies  Guidelines  Numbertransparencies  Maintain eye contact with the audience  Point on the projector, not screen  Keep relevant information hidden until needed  Turn projector light off when not in use
  • 17.
    Handouts  Their useallows speakers to go into depth on some points while skimming over others  They can be especially useful for complex presentations  They provide something for audience members to take with them for future reference  Handouts give a sense of security and ownership to speakers
  • 18.
    Handouts  Guidelines  Besure about the quality  Include helpful lists, maps, tables etc  Be sure thay are up to date  Decide how to deal with them during the presentation
  • 19.
    Computer presentations (ppt) Many types of audiences  Inexpensive and customizable  Needs to be well-prepared
  • 20.
    Tips for usingslides  Use bullet statements when possible (no more than 7 per slide)  Avoid too much verbiage and clutter  Keep it simple (less is more)  Keep sound effects to a minimum
  • 21.
    Tips for usingslides Only use long quotes and/or sentences if necessary (in which case, bring in each sentence one at a time) Avoid turning back to audience and reading too much
  • 22.
    Tips for usingslides Give handouts of PowerPoint slides before speech for audience note-taking (optional) Use slides as your notes or use PowerPoint handouts for additional notes
  • 23.
    Tips for usingslides Use graphs for important statistics (particularly when referring to dramatic gains or losses) Reduce walking in front of projector
  • 24.
    Tips for usingslides Build suspense for topic by leaving first slide blank Avoid being tied to the mouse Use pictures as metaphors or similes
  • 25.
    Tips for usingslides Use slides as punch lines for humor Use pictures and/or clipart on slides to enhance the mood
  • 26.
    Tips for usingslides Avoid putting too much verbiage around pictures (Keep it simple) Apply transitions and animations for effect (Don’t overdo. Decide what to emphasize.)
  • 27.
    Tips for usingslides  Maintain consistency (For example, use design templates)  Be prepared for technical difficulties (Always have a plan B)
  • 28.
    Which visual aidto choose? It depends on – Your goal – Your audience – Your budget – Available technology
  • 29.
    Tips for effectiveuse of visual aids  Give handouts before or after speech only if not a distraction  Explain the handout’s relevancy to topic  Keep visual aids clear and simple  Avoid lulls while you demonstrate
  • 30.
    Tips for effectiveuse of visual aids  Practice using visual aids  Make visual aids easy for audience to see  Set up before and discuss after the showing of video clips
  • 31.
    Tips for effectiveuse of visual aids  Use pictures or other visual aids to spark a story (there are stories in objects)  Avoid using animals and/or children if distracting  Demonstrate a task by using how-to- objects
  • 32.
    Visual Aid Categories Figures(charts) Tables Pictures and diagrams
  • 33.
    Charts In a barchart, the height or length of each bar represents the frequency of occurence..
  • 34.
    Bar Graphs  Includeno more than six bars  Label the bars themselves  Label the horizontal and vertical axes 0 20 40 60 80 100 1st Qtr 2nd Qtr 3rd Qtr 4 th Qtr East West North
  • 35.
  • 36.
    Bar Chart (datareordered)
  • 37.
    Charts The most frequentlyused diagram to emphasise the proportion or share of occurences is the pie chart. A pie chart is divided into proportional segments according to the share each has of the total value.
  • 38.
    Pie Charts  Avoidslicing the pie into more than seven slices  Label the pie pieces at or near the slice 1st Qt r 2 n d Qt r 3 rd Qt r 4 t h Qt r
  • 39.
    Ice Rink Expenses Staff34% Refrigeration 27% Gas 8% Snack bar 6% Maintenance 4% Water 3% Sewer 2% Office supplies 2% Too many slices
  • 40.
    Too Much Emphasison Service, Too Little on R & D Production Marketing Sales Service Research & Development PR
  • 41.
  • 42.
    Graphs Most suitable diagramfor exploring the trend is a line graph in which your data values for each time period are joined with a line to represent the trend.
  • 43.
    U.S. Slowdown ProducesDownturns in Other Countries -2 -1 0 1 2 3 4 5 6 7 U.S. England Germany Ireland Thailand Japan Korea 4th 2006 1st 2007 2nd 2007 3rd 2007 % GDP Growth How would you fix this graph?
  • 44.
    U.S. Slowdown ProducesDownturns in Other Countries 0 1 2 3 4 5 6 4th 2006 1st 2007 2nd 2007 3rd 2007 U.S. Europe Asia % GDP Growth Europe = England, Ireland, and Germany Asia = Thailand, Japan, and Korea
  • 45.
  • 47.
    EXAMPLES Example of a badpresentation Stand-up Example of a bad presentation 1