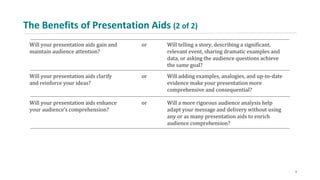
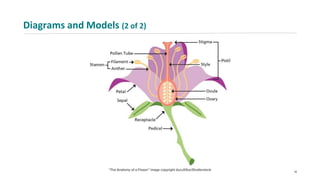
Chapter 5.4
Presentation Aids
Copyright © 2022 W. W. Norton & Company
Introduction
• Presentation aids engage your audience’s senses in a way that
boosts their interest, enhances message comprehension, and
stimulates critical thinking
• Presentation aids include but are not limited to supplementary
audio, visual, and hands-on resources available for presenting
and highlighting key ideas and supporting material in a
presentation
2
The Benefits of Presentation Aids (1 of 2)
• Presentation aids are common and expected in many rhetorical
situations
• Poorly used presentation aids can be a distraction, but when used
wisely and well, they offer many benefits:
• Attract and hold audience attention
• Enhance clarity and comprehension
• Set an appropriate mood
• Convey meaning better than words can for image- and sound-
based topics
• Save you and your audience time, particularly when trying to
explain complex ideas or a set of statistics
3
The Benefits of Presentation Aids (2 of 2)
Will your presentation aids gain and
maintain audience attention?
or Will telling a story, describing a significant,
relevant event, sharing dramatic examples and
data, or asking the audience questions achieve
the same goal?
Will your presentation aids clarify
and reinforce your ideas?
or Will adding examples, analogies, and up-to-date
evidence make your presentation more
comprehensive and consequential?
Will your presentation aids enhance
your audience’s comprehension?
or Will a more rigorous audience analysis help
adapt your message and delivery without using
any or as many presentation aids to enrich
audience comprehension?
4
Types of Presentation Aids
• You need to decide which type or types of aids you should use
• The following are various common types of presentation aids:
• Pie Charts, Graphs, and Tables
• Diagrams and Models
• Photographs and Illustrations
• Maps
• Handouts
• Sound Effects and Music
• Video Clips and Animation
5
PowerPoint for Class Speeches: DO
• 6x6 rule
• Font size at least 28
• Simple, clean fonts
• Design for camera OR auditorium
• Easy to read colors
6
PowerPoint for Class Speeches: AVOID
• Chartjunk
• Unnecessary or meaningless color and font changes
• Unclear graphics
• Reading it
7
Pie Charts, Graphs, and Tables (1 of 7)
• Pie charts show proportions in relation to a whole
• The wedges in a pie chart should be arranged in a progression
from small to large or large to small in a clockwise direction,
unless it is logically beneficial otherwise
• Pie charts work best when they are simple in design, clearly
labeled, have no more than six pieces, and show the percentage
relationship between parts and the whole
• If you need more than six, group the remainders as “others”
• Add emphasis by using the most contrasting colors or intense
shading pattern for each slice of the pie chart, or insert a thick
white line between wedges
8
Pie Charts, Graphs, and Tables (2 of 7)
9
Pie Charts, Graphs, and Tables (3 of 7)
• Graphs are primarily used to compare data and show pattern
• In a bar graph, make sure the space between bars is smaller than
the width of the bars
• If needed, use a contrasting color or shading to emphasize the
most important item on the graph
• Line graphs are better than bar graphs when tracking small
changes
• They can also be used to compare changes for multiple groups
• Area graphs are used to depict individual and competing trends
• Pictographs use repeated icons or symbols to visualize simple data
10
Pie Charts, Graphs, and Tables (4 of 7)
11
Pie Charts, Graphs, and Tables (5 of 7)
12
Pie Charts, Graphs, and Tables (6 of 7)
13
Pie Charts, Graphs, and Tables (7 of 7)
• Tables take many forms
• According to Margaret Rabb, author of The Presentation Design
Book: “When graphs aren’t specific enough and verbal
descriptions are too cumbersome, tables offer elegant solutions
for showing exact numeric values.”*
14
Diagrams and Models (1 of 2)
• Diagrams show how things work on a two-dimension page or slide
• Diagramming software available with hundreds of templates can
help you arrange information and data on organizational charts,
flowcharts, mind maps, and process diagrams
• Models are usually three-dimensional representations of an object
on a smaller scale than the original
• Models can be simple or elaborate, made at home or purchased,
held in your hand or shown on a screen
15
Diagrams and Models (2 of 2)
16
Photographs and Illustrations (1 of 2)
• Photographs and illustrations depict an action or skill, enliven
interest in a message, direct audience attention, and evoke
emotions
• They facilitate quickly gaining your audience’s understanding
when describing something visually unique or complex
• They can also depict abstract emotions or ideas
• Photos and illustrations can also tell (or help tell) a story
• Cartoons are a type of illustration that comments on, pokes fun at,
or ridicules a real situation or issue in a clever, succinct way
17
Photographs and Illustrations (2 of 2)
18
Maps (1 of 2)
• Maps “translate data into spatial patterns”*
• They also help explain the scale of a place or phenomenon
• Maps can also link statistical data to population characteristics.
19
Maps (2 of 2)
20
Rules
• 6x6: No more than 6 words per line AND 6 lines per slide
• Cite everything in-text and make a reference list slide(s) (Smith, 2019)
• Blue/purple background with white letters is easiest to read
• Try to present information without words/text when possible to
engage different types of learning.
• Do not include video or audio files
21
Handouts
• Handouts can help listeners comprehend the meaning of your
message
• It’s a good idea to use handouts if your presentation contains a lot
of technical information or if you don’t want your audience to take
many notes
• Do not distribute a text of your speech
• The nature and content of your handout should determine at what
point you share it with audience members
22
Sound Effects and Music
• You can also use sound effects and music to support your message
• The following guidelines can help you select appropriate sounds:
• Make sure the sounds match your message
• Recorded expert testimony or excerpts from a taped speech
can enliven a presentation
• Avoid trite sound effects
• Keep each sound clip brief
23
Video Clips and Animation
• Consider the following guidelines when using video clips and
animation in your presentation:
• Make them brief
• Make sure that the image quality of the video is good enough
to be shown
• Use only videos that are relevant to your purpose
24
Others
• Other types of presentation aids include objects, costumes,
physical demonstrations, and audience activities
• Make sure any presentation aid is relevant to your topic and
purpose and has the potential to gain attention, save time, and
clarify or reinforce the content of your message
• You are the most important presentation aid
• Your appearance, your voice, your nonverbal behavior, and
your physical delivery affect audience interest and attitude in
every rhetorical situation
25
Matching Presentation Aids to Your Purpose
Purpose Presentation aids
To explain the parts
of an internal
combustion engine
• A drawing of an engine
• Physical pieces of an engine
• Animated cartoon of an operating engine
To compare rap
music and talking
Blues
• Audio excerpts of each musical form
• Live performance
• Table comparing distinct musical characteristics
To demonstrate how
to separate egg
whites from egg
yolks
• Live demonstration
• Still photos on slides
• Audience participation
To learn the causes
and treatment of
sickle cell anemia
• Table listing symptoms
• Diagram or illustration of a sickle cell anemia blood cell
• Family tree diagram tracing inheritance of the disease
To identify the perils
of climate change in
the United States
• Graph of trends since 1950
• Map of recent weather disasters in the United States
• Handout listing validated research studies and essays
26
Applying Ethical Standards to Presentation Aids (1 of 2)
• Apply ethical standards to how you select, prepare, and use
presentation aids
• Make sure your presentation aids do not mislead the audience
• Acknowledge the source of presentation aids that are someone
else’s work or design
27
Applying Ethical Standards to Presentation Aids (2 of 2)
• Consider the following graphs:
28
Digital Presentation Aids
• Digital presentation aids are created, viewed, and/or heard,
distributed, modified, and preserved on electronic devices
• Use the following guidelines to decide when and how to use
digital presentation aids:
• Make sure the content of your presentation is clear and well
organized before choosing presentation aids
• Decide what types of digital presentation aids you need to
support your purpose and where they will go
• Assess the number and sequence of your presentation aids
• Plan for verbal transitions between presentation aids
29
Basic Strategies for Creating Digital Presentation Aids (1 of 2)
• Apply these three critical strategies for creating digital
presentation aids:
• Headline Your Visuals: A headline is an engaging title that
communicates a visual’s message or point of view
• Preview and Highlight: Your visuals should preview what you will
say and highlight the most important facts and features of your
presentation
• Build Sequentially: Use progressive disclosure to reveal each
concept on a slide individually so listeners focus their attention on
you, not the words or images on the screen
30
Basic Strategies for Creating Digital Presentation Aids (2 of 2)
31
Visual Design Principles for Digital Presentation Aids
• The following principles serve as established guidelines for
creating purposeful, effective, and memorable digital presentation
aids:
• Create a consistent look
• Exercise restraint
• Choose readable type
• Select suitable colors and templates
32
Create a Consistent Look
• Make sure your digital aids have a uniform appearance
throughout your presentation
• Create a master design for your presentation to ensure
consistency
• Make sure every design element looks appropriate and
complements that overall look and feel
33
Exercise Restraint
• Replace words with graphics, images, and diagrams when you
can
• Use key words or phrases to arouse audience curiosity and
highlight important information
• Limit the number of bullet points on a slide
• Make only one key point on each slide, and make sure the
headline states that point
• Limit the number of slides
34
Choose Readable Type
• Don’t use more than two different typefaces on a slide
• Avoid ornate and difficult-to-read type
• Opt for more legible typefaces, such as Helvetica, Verdana, Arial,
and Times New Roman
• Avoid using all uppercase letters
• Use highlights sparingly
• Ensure your font size is clearly legible
35
Select Suitable Colors and Templates (1 of 2)
• Choose text colors that ensure the words on your slides are
legible and engaging
• Consider whether the color scheme is appropriate for the
rhetorical situation and your purpose
• If in doubt, stick to proven color schemes
• You can find numerous templates on your own computer or on
easily accessible software
• In most cases, simple templates work the best
36
Select Suitable Colors and Templates (2 of 2)
37
Delivering Presentation Aids (1 of 4)
• Make sure you know how to integrate your presentation aids
smoothly and professionally into your delivery
• Speak extemporaneously
• Use notes sparingly
• Establish and maintain eye contact
• Analyze their feedback and determine whether you are
achieving your purpose
38
Delivering Presentation Aids (2 of 4)
• Consider the following recommendations for delivering
presentation aids:
Focusing • Establish rapport with your audience before you start using
your aids.
• For most SPEAKING OCCASIONS, it is better not to show the
visual aid until after you’ve started speaking.
• Don’t turn your back to the audience or focus your attention
on the aid.
• Number each of your slides. If you need to go back or skip
ahead because of time or because someone asks a question,
your listeners can easily find where you are.
• When using Zoom, Teams, or another mediated technology,
remember what the audience will see. You may be in a little
box in the upp
39
Delivering Presentation Aids (3 of 4)
Pointing • Avoid laser pointers. Their beam is small and can be difficult to
hold steady.
• If necessary, rest your hand or a rigid pointer gently on a flip
chart, board, or screen.
• Put the pointer down when you are finished with it. Don’t wave
it around.
• Touch, turn, talk: touch the aid, turn toward the audience, talk.
• In many mediated technologies, you can use your computer’s
cursor as a pointer.
Show and
tell
• Explain what is relevant and important about the aid.
• Show and tell at the same time. Give verbal cues as you handle
and highlight features of an object or point to a slide
component.
• In most cases, don’t read aloud all the written words on a visual
to your audience. (Sometimes, though, you may want to read an
important phrase to reinforce its importance.)
• If possible, use a remote to change slides.
40
Delivering Presentation Aids (4 of 4)
Timing • Display the aid for as long as a person needs to read the text
twice.
• Avoid long pauses between aids.
• When you finish talking about an aid, remove it or put it aside.
• Use a blank slide when visual content isn’t needed so you can
refocus audience attention on you. (Tip: If you hit the B key in
PowerPoint, your screen will turn black. If you tap the W key,
your screen will turn white. To get back to your slides, simply
hit the letter again.)
41
Conclusion
• Always remember that presentation aids are only aids, not your
presentation
• Strategically chosen, well-crafted presentation aids can grab
audience attention, raise their interest, and help in
comprehension
• Using presentation aids will increase the time you need to
practice, as well as the length of your presentation
• Work on the timing and handling of your aids
• You may be the presentation aid best remembered by the
audience
42
Credits
This concludes the Lecture PowerPoint presentation for Chapter 5.4.
For more resources, please visit The Norton Field Guide to Speaking:
http://digital.wwnorton.com/nfgspeaking.
Copyright © 2022 W. W. Norton & Company

Norton Field Guide for Speaking 5.4

  • 1.
    Chapter 5.4 Presentation Aids Copyright© 2022 W. W. Norton & Company
  • 2.
    Introduction • Presentation aidsengage your audience’s senses in a way that boosts their interest, enhances message comprehension, and stimulates critical thinking • Presentation aids include but are not limited to supplementary audio, visual, and hands-on resources available for presenting and highlighting key ideas and supporting material in a presentation 2
  • 3.
    The Benefits ofPresentation Aids (1 of 2) • Presentation aids are common and expected in many rhetorical situations • Poorly used presentation aids can be a distraction, but when used wisely and well, they offer many benefits: • Attract and hold audience attention • Enhance clarity and comprehension • Set an appropriate mood • Convey meaning better than words can for image- and sound- based topics • Save you and your audience time, particularly when trying to explain complex ideas or a set of statistics 3
  • 4.
    The Benefits ofPresentation Aids (2 of 2) Will your presentation aids gain and maintain audience attention? or Will telling a story, describing a significant, relevant event, sharing dramatic examples and data, or asking the audience questions achieve the same goal? Will your presentation aids clarify and reinforce your ideas? or Will adding examples, analogies, and up-to-date evidence make your presentation more comprehensive and consequential? Will your presentation aids enhance your audience’s comprehension? or Will a more rigorous audience analysis help adapt your message and delivery without using any or as many presentation aids to enrich audience comprehension? 4
  • 5.
    Types of PresentationAids • You need to decide which type or types of aids you should use • The following are various common types of presentation aids: • Pie Charts, Graphs, and Tables • Diagrams and Models • Photographs and Illustrations • Maps • Handouts • Sound Effects and Music • Video Clips and Animation 5
  • 6.
    PowerPoint for ClassSpeeches: DO • 6x6 rule • Font size at least 28 • Simple, clean fonts • Design for camera OR auditorium • Easy to read colors 6
  • 7.
    PowerPoint for ClassSpeeches: AVOID • Chartjunk • Unnecessary or meaningless color and font changes • Unclear graphics • Reading it 7
  • 8.
    Pie Charts, Graphs,and Tables (1 of 7) • Pie charts show proportions in relation to a whole • The wedges in a pie chart should be arranged in a progression from small to large or large to small in a clockwise direction, unless it is logically beneficial otherwise • Pie charts work best when they are simple in design, clearly labeled, have no more than six pieces, and show the percentage relationship between parts and the whole • If you need more than six, group the remainders as “others” • Add emphasis by using the most contrasting colors or intense shading pattern for each slice of the pie chart, or insert a thick white line between wedges 8
  • 9.
    Pie Charts, Graphs,and Tables (2 of 7) 9
  • 10.
    Pie Charts, Graphs,and Tables (3 of 7) • Graphs are primarily used to compare data and show pattern • In a bar graph, make sure the space between bars is smaller than the width of the bars • If needed, use a contrasting color or shading to emphasize the most important item on the graph • Line graphs are better than bar graphs when tracking small changes • They can also be used to compare changes for multiple groups • Area graphs are used to depict individual and competing trends • Pictographs use repeated icons or symbols to visualize simple data 10
  • 11.
    Pie Charts, Graphs,and Tables (4 of 7) 11
  • 12.
    Pie Charts, Graphs,and Tables (5 of 7) 12
  • 13.
    Pie Charts, Graphs,and Tables (6 of 7) 13
  • 14.
    Pie Charts, Graphs,and Tables (7 of 7) • Tables take many forms • According to Margaret Rabb, author of The Presentation Design Book: “When graphs aren’t specific enough and verbal descriptions are too cumbersome, tables offer elegant solutions for showing exact numeric values.”* 14
  • 15.
    Diagrams and Models(1 of 2) • Diagrams show how things work on a two-dimension page or slide • Diagramming software available with hundreds of templates can help you arrange information and data on organizational charts, flowcharts, mind maps, and process diagrams • Models are usually three-dimensional representations of an object on a smaller scale than the original • Models can be simple or elaborate, made at home or purchased, held in your hand or shown on a screen 15
  • 16.
  • 17.
    Photographs and Illustrations(1 of 2) • Photographs and illustrations depict an action or skill, enliven interest in a message, direct audience attention, and evoke emotions • They facilitate quickly gaining your audience’s understanding when describing something visually unique or complex • They can also depict abstract emotions or ideas • Photos and illustrations can also tell (or help tell) a story • Cartoons are a type of illustration that comments on, pokes fun at, or ridicules a real situation or issue in a clever, succinct way 17
  • 18.
  • 19.
    Maps (1 of2) • Maps “translate data into spatial patterns”* • They also help explain the scale of a place or phenomenon • Maps can also link statistical data to population characteristics. 19
  • 20.
  • 21.
    Rules • 6x6: Nomore than 6 words per line AND 6 lines per slide • Cite everything in-text and make a reference list slide(s) (Smith, 2019) • Blue/purple background with white letters is easiest to read • Try to present information without words/text when possible to engage different types of learning. • Do not include video or audio files 21
  • 22.
    Handouts • Handouts canhelp listeners comprehend the meaning of your message • It’s a good idea to use handouts if your presentation contains a lot of technical information or if you don’t want your audience to take many notes • Do not distribute a text of your speech • The nature and content of your handout should determine at what point you share it with audience members 22
  • 23.
    Sound Effects andMusic • You can also use sound effects and music to support your message • The following guidelines can help you select appropriate sounds: • Make sure the sounds match your message • Recorded expert testimony or excerpts from a taped speech can enliven a presentation • Avoid trite sound effects • Keep each sound clip brief 23
  • 24.
    Video Clips andAnimation • Consider the following guidelines when using video clips and animation in your presentation: • Make them brief • Make sure that the image quality of the video is good enough to be shown • Use only videos that are relevant to your purpose 24
  • 25.
    Others • Other typesof presentation aids include objects, costumes, physical demonstrations, and audience activities • Make sure any presentation aid is relevant to your topic and purpose and has the potential to gain attention, save time, and clarify or reinforce the content of your message • You are the most important presentation aid • Your appearance, your voice, your nonverbal behavior, and your physical delivery affect audience interest and attitude in every rhetorical situation 25
  • 26.
    Matching Presentation Aidsto Your Purpose Purpose Presentation aids To explain the parts of an internal combustion engine • A drawing of an engine • Physical pieces of an engine • Animated cartoon of an operating engine To compare rap music and talking Blues • Audio excerpts of each musical form • Live performance • Table comparing distinct musical characteristics To demonstrate how to separate egg whites from egg yolks • Live demonstration • Still photos on slides • Audience participation To learn the causes and treatment of sickle cell anemia • Table listing symptoms • Diagram or illustration of a sickle cell anemia blood cell • Family tree diagram tracing inheritance of the disease To identify the perils of climate change in the United States • Graph of trends since 1950 • Map of recent weather disasters in the United States • Handout listing validated research studies and essays 26
  • 27.
    Applying Ethical Standardsto Presentation Aids (1 of 2) • Apply ethical standards to how you select, prepare, and use presentation aids • Make sure your presentation aids do not mislead the audience • Acknowledge the source of presentation aids that are someone else’s work or design 27
  • 28.
    Applying Ethical Standardsto Presentation Aids (2 of 2) • Consider the following graphs: 28
  • 29.
    Digital Presentation Aids •Digital presentation aids are created, viewed, and/or heard, distributed, modified, and preserved on electronic devices • Use the following guidelines to decide when and how to use digital presentation aids: • Make sure the content of your presentation is clear and well organized before choosing presentation aids • Decide what types of digital presentation aids you need to support your purpose and where they will go • Assess the number and sequence of your presentation aids • Plan for verbal transitions between presentation aids 29
  • 30.
    Basic Strategies forCreating Digital Presentation Aids (1 of 2) • Apply these three critical strategies for creating digital presentation aids: • Headline Your Visuals: A headline is an engaging title that communicates a visual’s message or point of view • Preview and Highlight: Your visuals should preview what you will say and highlight the most important facts and features of your presentation • Build Sequentially: Use progressive disclosure to reveal each concept on a slide individually so listeners focus their attention on you, not the words or images on the screen 30
  • 31.
    Basic Strategies forCreating Digital Presentation Aids (2 of 2) 31
  • 32.
    Visual Design Principlesfor Digital Presentation Aids • The following principles serve as established guidelines for creating purposeful, effective, and memorable digital presentation aids: • Create a consistent look • Exercise restraint • Choose readable type • Select suitable colors and templates 32
  • 33.
    Create a ConsistentLook • Make sure your digital aids have a uniform appearance throughout your presentation • Create a master design for your presentation to ensure consistency • Make sure every design element looks appropriate and complements that overall look and feel 33
  • 34.
    Exercise Restraint • Replacewords with graphics, images, and diagrams when you can • Use key words or phrases to arouse audience curiosity and highlight important information • Limit the number of bullet points on a slide • Make only one key point on each slide, and make sure the headline states that point • Limit the number of slides 34
  • 35.
    Choose Readable Type •Don’t use more than two different typefaces on a slide • Avoid ornate and difficult-to-read type • Opt for more legible typefaces, such as Helvetica, Verdana, Arial, and Times New Roman • Avoid using all uppercase letters • Use highlights sparingly • Ensure your font size is clearly legible 35
  • 36.
    Select Suitable Colorsand Templates (1 of 2) • Choose text colors that ensure the words on your slides are legible and engaging • Consider whether the color scheme is appropriate for the rhetorical situation and your purpose • If in doubt, stick to proven color schemes • You can find numerous templates on your own computer or on easily accessible software • In most cases, simple templates work the best 36
  • 37.
    Select Suitable Colorsand Templates (2 of 2) 37
  • 38.
    Delivering Presentation Aids(1 of 4) • Make sure you know how to integrate your presentation aids smoothly and professionally into your delivery • Speak extemporaneously • Use notes sparingly • Establish and maintain eye contact • Analyze their feedback and determine whether you are achieving your purpose 38
  • 39.
    Delivering Presentation Aids(2 of 4) • Consider the following recommendations for delivering presentation aids: Focusing • Establish rapport with your audience before you start using your aids. • For most SPEAKING OCCASIONS, it is better not to show the visual aid until after you’ve started speaking. • Don’t turn your back to the audience or focus your attention on the aid. • Number each of your slides. If you need to go back or skip ahead because of time or because someone asks a question, your listeners can easily find where you are. • When using Zoom, Teams, or another mediated technology, remember what the audience will see. You may be in a little box in the upp 39
  • 40.
    Delivering Presentation Aids(3 of 4) Pointing • Avoid laser pointers. Their beam is small and can be difficult to hold steady. • If necessary, rest your hand or a rigid pointer gently on a flip chart, board, or screen. • Put the pointer down when you are finished with it. Don’t wave it around. • Touch, turn, talk: touch the aid, turn toward the audience, talk. • In many mediated technologies, you can use your computer’s cursor as a pointer. Show and tell • Explain what is relevant and important about the aid. • Show and tell at the same time. Give verbal cues as you handle and highlight features of an object or point to a slide component. • In most cases, don’t read aloud all the written words on a visual to your audience. (Sometimes, though, you may want to read an important phrase to reinforce its importance.) • If possible, use a remote to change slides. 40
  • 41.
    Delivering Presentation Aids(4 of 4) Timing • Display the aid for as long as a person needs to read the text twice. • Avoid long pauses between aids. • When you finish talking about an aid, remove it or put it aside. • Use a blank slide when visual content isn’t needed so you can refocus audience attention on you. (Tip: If you hit the B key in PowerPoint, your screen will turn black. If you tap the W key, your screen will turn white. To get back to your slides, simply hit the letter again.) 41
  • 42.
    Conclusion • Always rememberthat presentation aids are only aids, not your presentation • Strategically chosen, well-crafted presentation aids can grab audience attention, raise their interest, and help in comprehension • Using presentation aids will increase the time you need to practice, as well as the length of your presentation • Work on the timing and handling of your aids • You may be the presentation aid best remembered by the audience 42
  • 43.
    Credits This concludes theLecture PowerPoint presentation for Chapter 5.4. For more resources, please visit The Norton Field Guide to Speaking: http://digital.wwnorton.com/nfgspeaking. Copyright © 2022 W. W. Norton & Company

Editor's Notes

  • #14 Kevin Mercadante, “Gender Pay Gap in 2021: The Long and Winding Road to Parity,” Money under 30, December 28, 2020, https://www.moneyunder30 .com/the-gender-pay-gap-in-the-21st-century
  • #15 Margaret Y. Rabb, The Presentation Design Book: Tips, Techniques & Advice for Creating Effective, Attractive Slides, Overheads, Screen Shows, Multimedia & More, 2nd ed. (Chapel Hill, NC: Ventana Press, 1993), 154
  • #20 Stephen M. Kosslyn, Clear and to the Point: 8 Psychological Principles for Compelling PowerPoint® Presentations (New York: Oxford University Press, 2007), 210