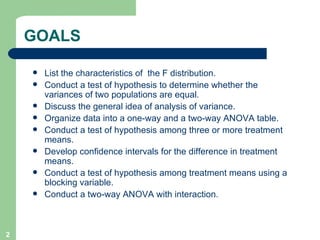
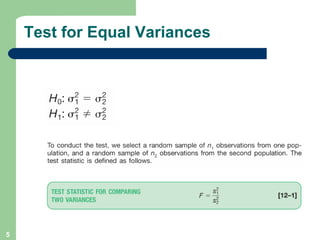
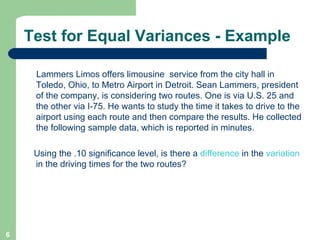
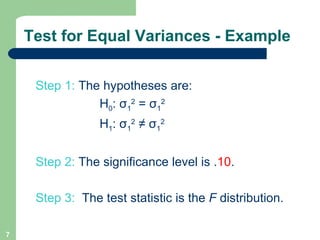
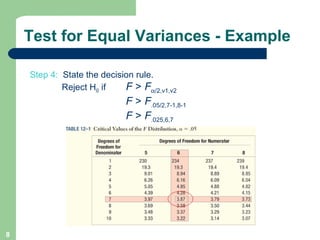
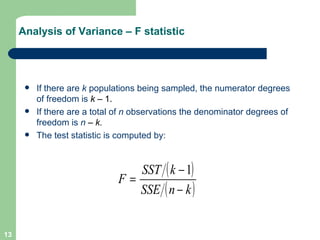
This document discusses analysis of variance (ANOVA) techniques. It defines the F-distribution and its characteristics. It then covers testing for equal variances between two populations and comparing means of two or more populations using one-way and two-way ANOVA. Examples are provided to illustrate hypothesis testing using the F-statistic to compare variances and population means. Finally, it discusses developing confidence intervals for differences in treatment means and using ANOVA in Excel.
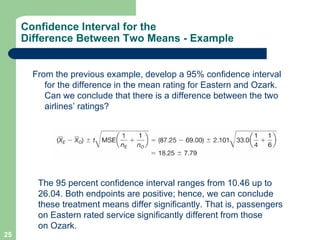
![Confidence Interval for the Difference Between Two Means where t is obtained from the t table with degrees of freedom ( n - k ). MSE = [ SSE /( n - k )]](https://image.slidesharecdn.com/chapter12-091211160703-phpapp01/85/Chapter-12-24-320.jpg)