Download to read offline
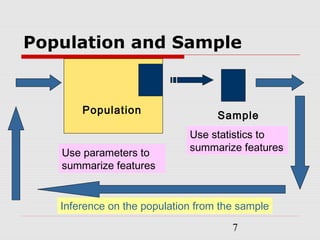
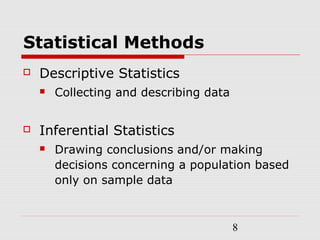
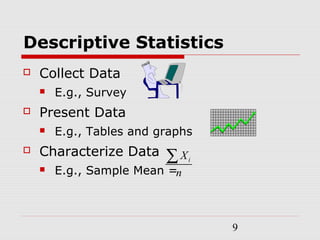
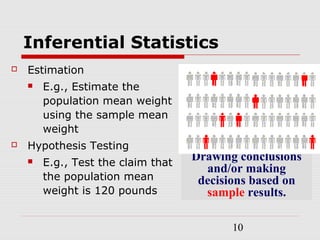
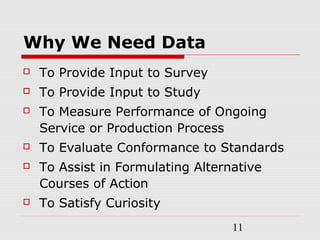
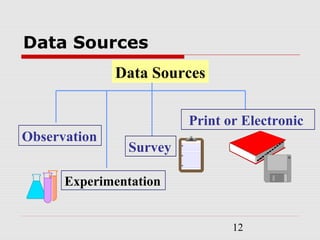
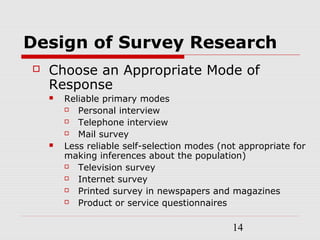
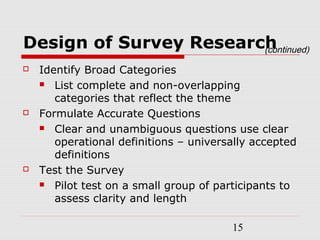
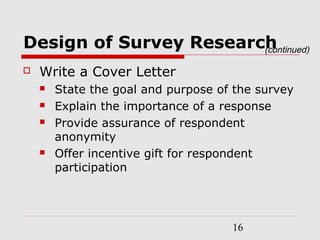
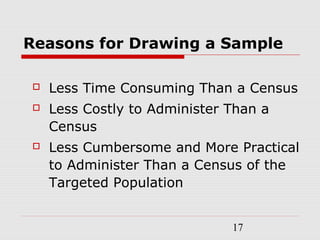
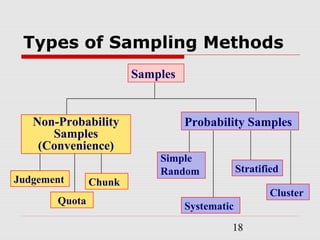

This chapter introduces foundational statistical concepts. It discusses why managers need statistics to properly present information, draw conclusions from samples, and improve processes. It also covers the difference between descriptive and inferential statistics, important definitions like population and parameter, why data is needed, sources of data, survey design, sampling methods, and types of survey errors.