Downloaded 38 times
![IJSRD - International Journal for Scientific Research & Development| Vol. 2, Issue 08, 2014 | ISSN (online): 2321-0613
All rights reserved by www.ijsrd.com 292
Land Use Land Cover Change Detection of Gulbarga City Using Remote
Sensing and GIS
Snehit S H1
Shivasharanappa2
1
M.tech 1
Associate Professor
1,2
Department of Environmental Engineering
1,2
PDA College of Engineering Gulbarga, Karnataka, India
Abstract— Land use and land cover(LULC) recently these
days became a major component to handle natural resources
and managing changes occurring in the environment.which
is due to expansion of the urban area it has lead to critical
losses of agriculture land,vegetation land and water
bodies.followed by this the urban sprawl created a
environmental issues. For example :decreased air quality
and increase in the temperature etc. Land use and land cover
change is driven by human actions and also drives changes
that limit availability of products and services for human
and animals, and it can undermine ecological wellbeing
also. Land use and land cover is an important component in
understanding various interactions of the human activities
with the environment and thus it is necessary to be able to
simulate changes. Therefore, this study was aimed at
understanding land use and land cover change in Gulbarga
city. In this work we took Gulbarga city to study the urban
expansion and LULC change that took place in 2001 and
2012 to know the changes happened in the year 2012 by
comparing with data of 2001.remote sensing methodology is
used in this study which provides major coverage mapping
& classification of land cover features such as
vegetation,soil,water,forest etc. A wide range of
environmental parameters can be measured including the
land use, vegetation types, surface temperatures , soil types,
precipitation, phytoplankton, turbidity, surface elevation and
geology.satellite images of two different years i.e 2001 and
2012 are taken in to consideration.after image processing
classification is done so as to classify images in to various
different land use categories.
Keywords: land use land cover (LULC), remote sensing,
gis,change detection, classification
I. INTRODUCTION
Land-use refers human Land use refers human exercises
ashore for gigantic uses like farming, woods advancement,
settlement improvement,etc. Land-cover refers to natural
covering of land by vegetation, water body, rocky land,
etc.change detection is a method of identifying the
enormous differences in LULC overtime. Land-use and
land-cover are linked to climate and weather in critical
ways. Key links between changes in land cover and climate
include the exchange of greenhouse gases (such as the water
vapor, the carbon dioxide, the methane, and the nitrous
oxide) between the land surface and the atmosphere, the
radiation (both solar and longwave) balance of the land
surface, the exchange of heat between the land surface and
the atmosphere, and the hardness of the land surface and its
uptake of momentum from the atmosphere. Because of these
strong links between land cover and climate,the changes in
land use and land cover can be important contributors to
climate change and variability. Land use/ Land-cover
change information has an important role to play at local
and regional as well as at macro level planning.. The land
use land-cover changes occur naturally in a progressive and
gradual way.
II. LITRATURE REVIEW
A. Innocent Ezeomedo And Joel Igbokwe,(Nigeria) :
He reported The center of this paper is to portray the fast and
commonsense methodology to Mapping and Analysis of
Landuse and Landcover examples and progressions utilizing
high determination satellite pictures. The study was done in
Onitsha urban and its environs in south-eastern Nigeria. For
this reason, multitemporal information comprising of
existing Topographical guide, SPOT-5, and IKONOS
pictures were transformed utilizing spatial examination
devices of resampling, georeferencing, grouping and post-
characterization overlay, to guide the examples and degree of
landuse and landcover in the study zone and additionally
focus the greatness of progressions between the years of
investment, 1964, 2005 and 2008 separately. The aftereffect
of the study demonstrates that the fabricated up territories
have been on a steady positive and basically uncontrolled
extension from 8.12% of the study territory in 1964 to
41.64% in 2005 and to 67.62% in 2008. Then again,
vegetation, including developed and uncultivated
horticultural grounds has been on an unfaltering decay, from
79.10% in 1964 to 51.78% in 2005 and an unimportant
18.74% in 2008. The study prescribed that the Government
and open orgs concerned ought to create approaches and
methodologies to attain an adjusted, facilitated and
reasonable improvement in the urban zone and its
environs.finally reasoned that the present study exhibits the
value of satellite information for the readiness of precise and
avant-garde area utilization/area spread maps portraying
existing area classes for breaking down their change design
by usage of computerized picture transforming
techniques.result of order obviously indicates consistent
positive increment in urbanization and adjusted decrease in
the urban vegetation.it is presumed that satellite symbolism
might be extremely successful and quick in change
identification of landuse and landcover changes. [1]
B. Hussain Ali Oumer (Ethiopia):
He reported that the Land utilize and area spread change is
determined by human activities furthermore drives changes
that point of confinement accessibility of items and
administrations for human and domesticated animals, and it
can undermine ecological wellbeing also. Thusly, this study
was gone for comprehension area utilize and area spread
change within Lenche Dima and Kuhar Michael of Amhara
district, Ethiopia. Time-arrangement satellite pictures that
included Landsat MSS, TM, Etm+ and ASTER, which
secured the timeline between 1972/3 to 2005, were utilized.](https://image.slidesharecdn.com/ijsrdv2i8088-150923095131-lva1-app6891/75/Land-Use-Land-Cover-Change-Detection-of-Gulbarga-City-Using-Remote-Sensing-and-GIS-1-2048.jpg)
![Land Use Land Cover Change Detection of Gulbarga City Using Remote Sensing and GIS
(IJSRD/Vol. 2/Issue 08/2014/067)
All rights reserved by www.ijsrd.com 293
Financial Survey and survey of reports was done to
comprehend recorded patterns, gather ground truth and other
optional data needed. Investigation of information and other
information was fulfilled through incorporated utilization of
ERDAS envision (form 9.1), ENVI (adaptation 4.3) and
Arcgis (rendition 9.2) product bundles alongside Microsoft
office systematic tools.remote sensing dissection uncovered
scene level change of developed area to have a net increment
in Kuhar Michael, while a decay is found for Lenche Dima.
Nonetheless, financial overviews demonstrated that family
level developed area has diminished from 1.2ha to 1ha and
from 2.2ha to 1.8ha in Kuhar Michael and Lenche Dima
individually, in the course of the last 30years. Real helping
variables included populace expand, event of dry spell, land
redistribution, and area debasement. Likewise, normal area
holding for every family unit has diminished from 1.6ha to
1.5ha and from 2.9ha to 2.2ha in Kuhar Michael and Lenche
Dima, respectively.his Key Objective was to comprehend
changes in area utilize and area spread happening within
Kuhar Michael and Lenche Dima catchments focused around
examination of remotely sensed data.to recognize and
analyze drivers of area utilize and area spread change as a
part of the study areas.to examine the effect on vegetation,
crop generation and creature sustain motion in the study
areas.finally Concluded that Remote sensing results
demonstrated that the region of developed land in both
studyareas has experienced a change, yet with varying
greatness and rates In Kuhar Michael, an augmentation was
found in the midst of the introductory two periods with
yearly rates of 1.7% and 0.6% , while an abatement was
uncovered in the midst of the third period at yearly rate of -
1% . Notwithstanding the occasional varieties in change of
developed area, the general rate of progress amid the entire
time of examination (1972-2005) is discovered to be 0.8%
for every annum, which brought about a net
increase.however, in Lenche Dima, developed area
demonstrated a declining pattern both at family and scene
level amid most investigation periods generally because of
area corruption .[2]
C. Prakasam.c (A research endeavor of KODAIKANAL
TALUK, Tamil nadu) :
He reported that Land utilize and area spread is an essential
segment in understanding the communications of the human
exercises with nature's domain and in this manner it is
important to have the capacity to mimic progressions.
Observational perception uncovered a change in area
utilization area spread characterization in Kodaikanal taluk,
an a piece of Western Ghats found in Tamilnadu state. In
this paper an endeavor is rolled out to study the
improvements in area utilize and area blanket within
Kodaikanal Taluk in excess of 40 years period (1969-
2008).the study has been carried out through remote sensing
methodology utilizing SOI Taluk guide of Kodaikanal
(1969), and Land Sat symbolisms of May 2003 and April
2008. The area utilization area spread characterization was
performed focused around the Survey of India Kodaikanal
Taluk guide and Satellite symbolisms. GIS programming is
utilized to set up the topical maps. Ground truth perceptions
were likewise performed to check the exactness of the
grouping. The present study has brought to light that
timberland region that involved around 70 for every penny
of the Taluk's zone in 1969 has diminished to 33 for every
penny in 2008. Agrarian area, Built up range, Harvested
land and Waste land additionally have encountered change.
Builtup grounds (Settlement) have expanded from 3 for
every penny to 21 for every penny of the aggregate region.
Kodaikanal range is recognized as one of the biodiversity
zone in India. Fitting area use arranging is vital for a
manageable improvement of Kodaikanal Taluk.the Key
Objective was to break down the nature and degree area
utilization/area spread changes in Kodaikanal Taluk in the
past 40 years and to recognize the principle constrains
behind the changes.so at last reasoned that Kodaikanal is a
celebrated slope station in south India the real wellspring of
pay is through tourism. The real land use in Kodaikanal
Taluk is woods. Anyhow the area under woodland spread
has encountered a declining pattern in the previous forty
years. Here woodland area changed over to Agricultural
land, Builtup, and Harvested land because of this
progressions we misfortune our common biological system
and biodiversity additionally. The increment in horticultural
area is an inviting pattern. Anyhow observational perception
uncovers that because of increment in expense of
development, issues because of lack of work, supply of low
quality defiled composts and value vacillation in the
business sector the agriculturists like to offer their property
to property promoters. Thus there is a danger of decrease in
the degree of area under horticulture within a brief period of
time. The increment in the zone under developed grounds
may prompt a ton of ecological and biological issues. [3]
III. STUDY AREA
Fig.1: Location Map of Gulbarga city
Gulbarga City is arranged in North piece of
Gulbarga region. It reaches out from 76° 02' to 77° 42' 0"
East Longitude and 16° 11' to 17° 46' 0" North
Latitude..area is of 64.00sq.kms & populace is of 5.43
lakhs,number of properties are 50459 & number of wards
are of 55. Two real waterways, Krishna and substantial
number of tanks which, notwithstanding the streams, water
the area. The Bhima, stream in the locale. Dark soil is
overwhelming soil sort in the region.. Bajra, toor, sugarcane,
groundnut, sunflower, sesame, castor bean, dark gram,
jowar, wheat, cotton, ragi, Bengal gram, and linseed are
developed in this district.the aggregate water supply is
50mld & for every capita water supply is 100 Lpcd.the
climate in Gulbarga comprises of 3 primary seasons. The
late spring period is from late February to mid June. It is
trailed by the south west storm which begins from the late](https://image.slidesharecdn.com/ijsrdv2i8088-150923095131-lva1-app6891/75/Land-Use-Land-Cover-Change-Detection-of-Gulbarga-City-Using-Remote-Sensing-and-GIS-2-2048.jpg)
![Land Use Land Cover Change Detection of Gulbarga City Using Remote Sensing and GIS
(IJSRD/Vol. 2/Issue 08/2014/067)
All rights reserved by www.ijsrd.com 294
June to late September substantial precipitation may go up
to 750mm.fig-1 shows location map of Gulbarga city.[4]
The temperatures amid the diverse seasons are:
Summer : 38 to 44 °C
Monsoon: 27 to 37 °C
Winter : 11 to 26 °C
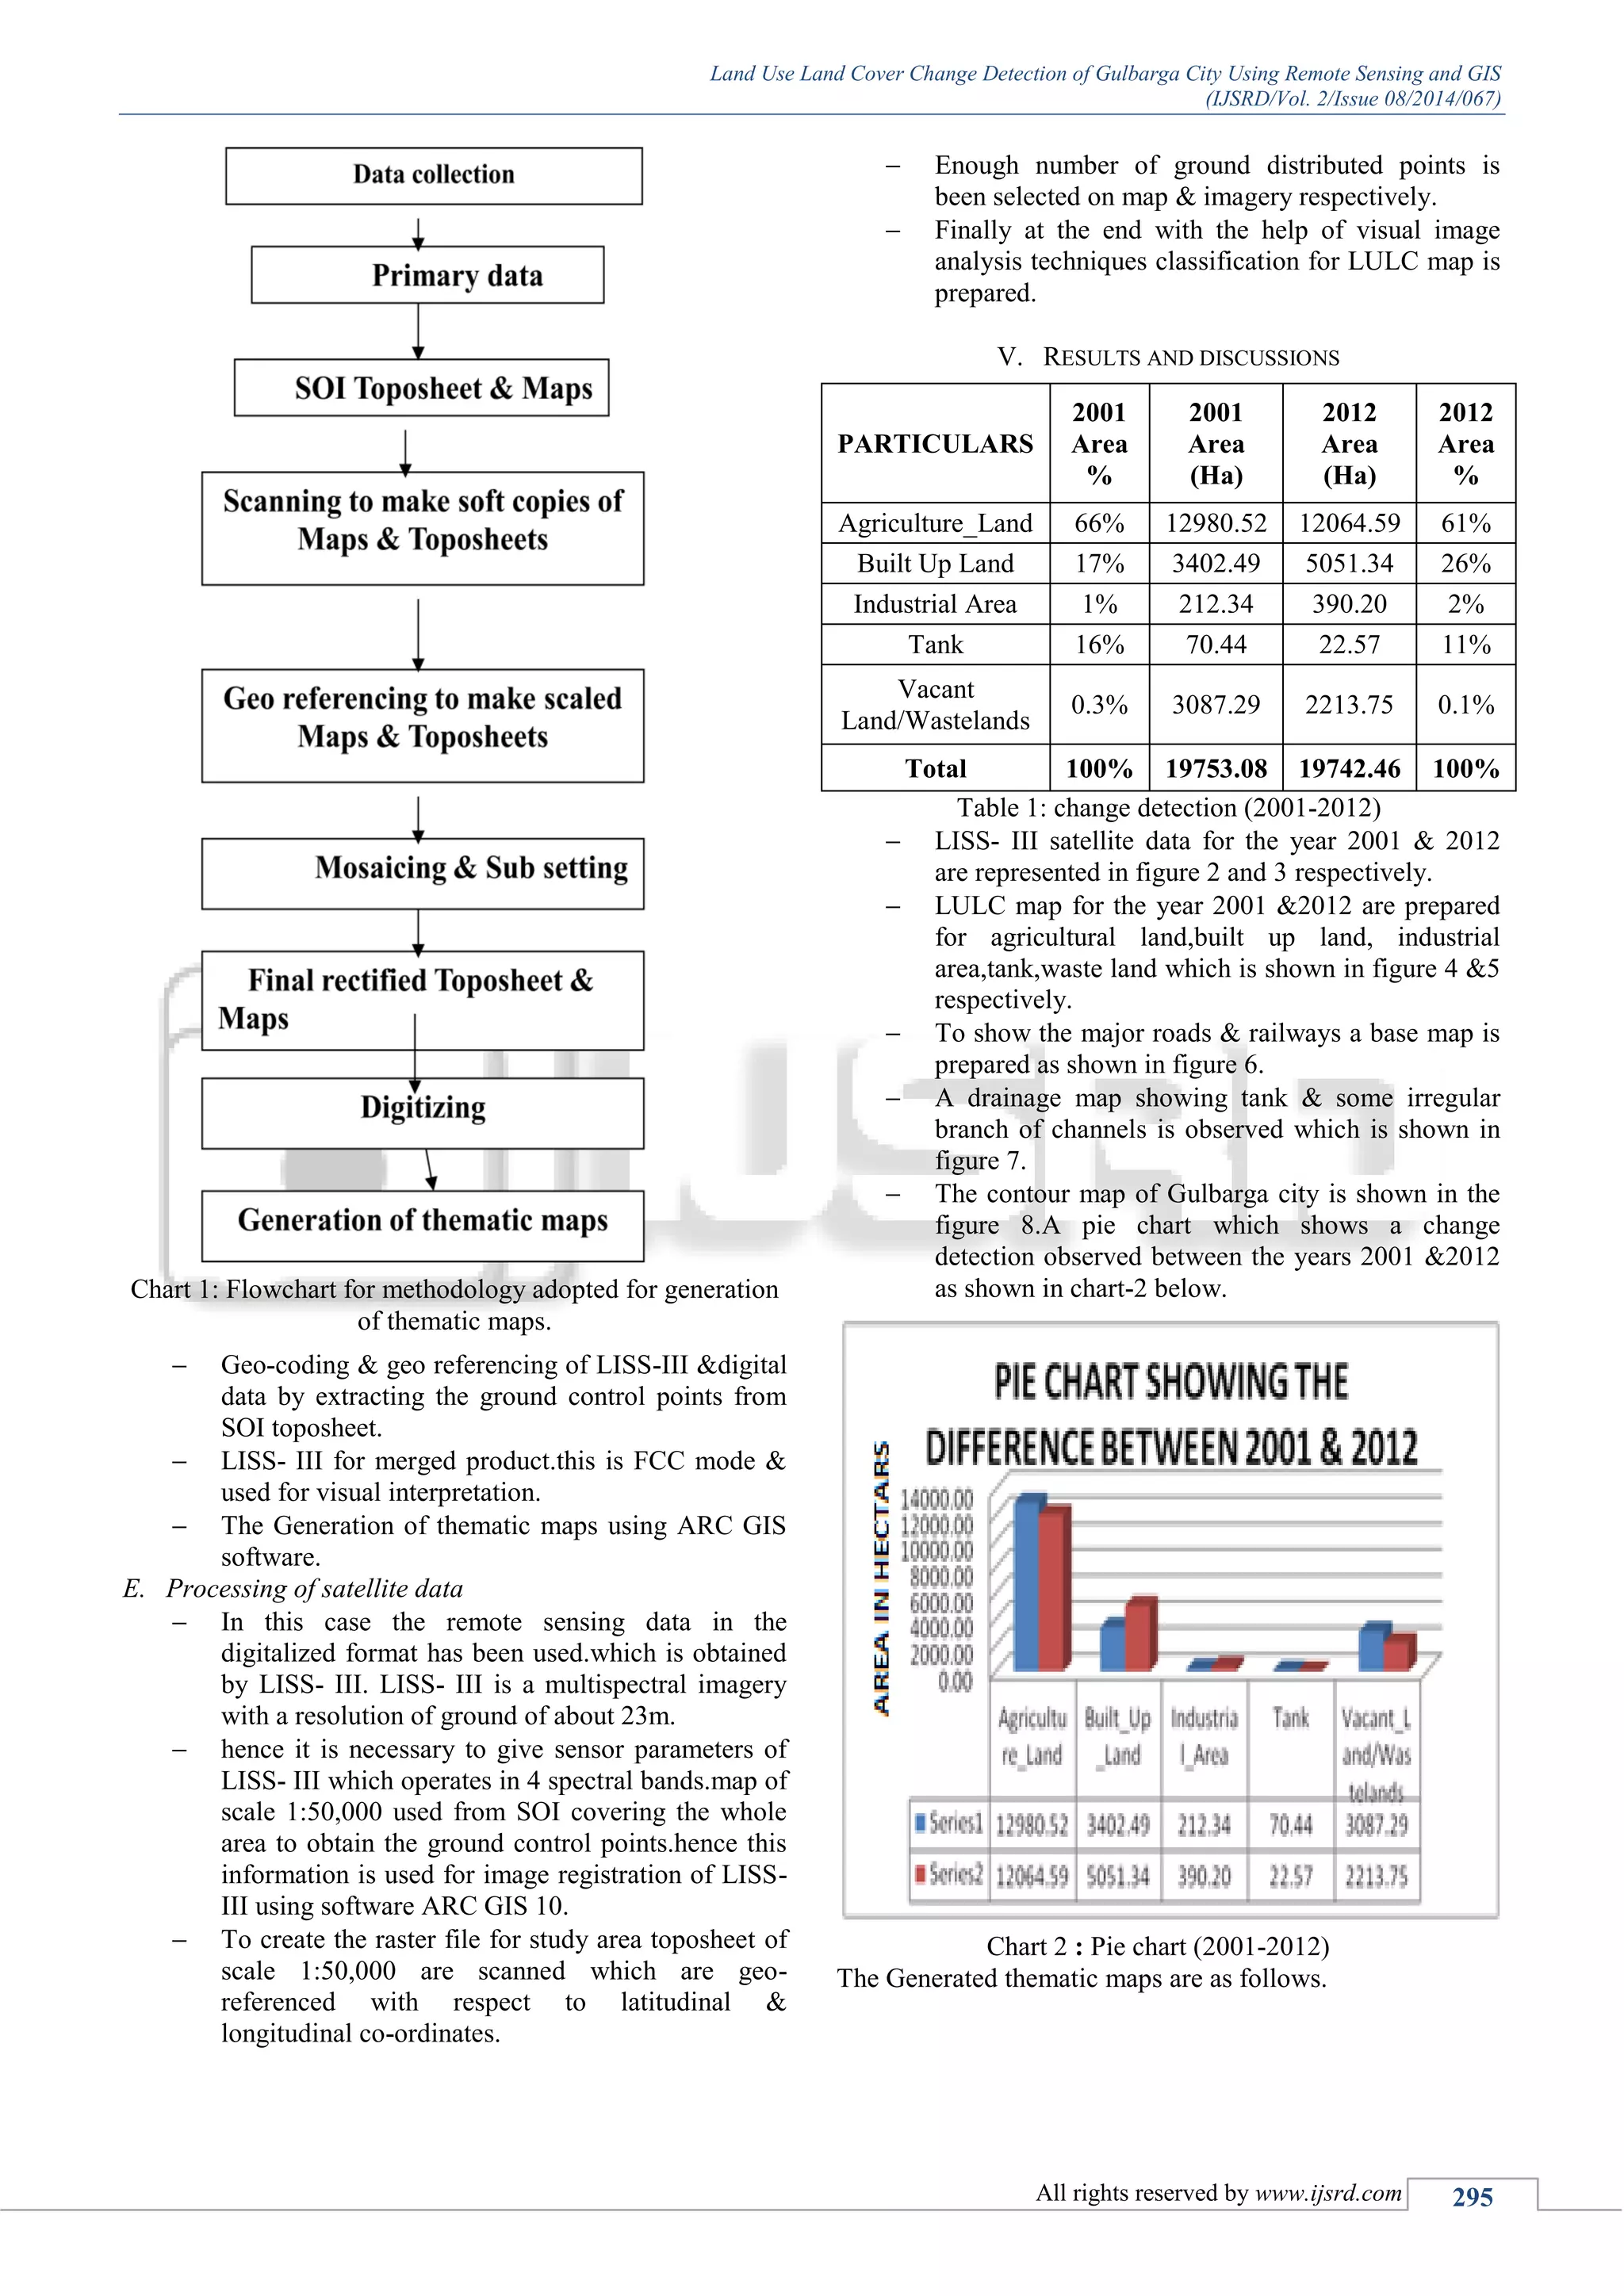
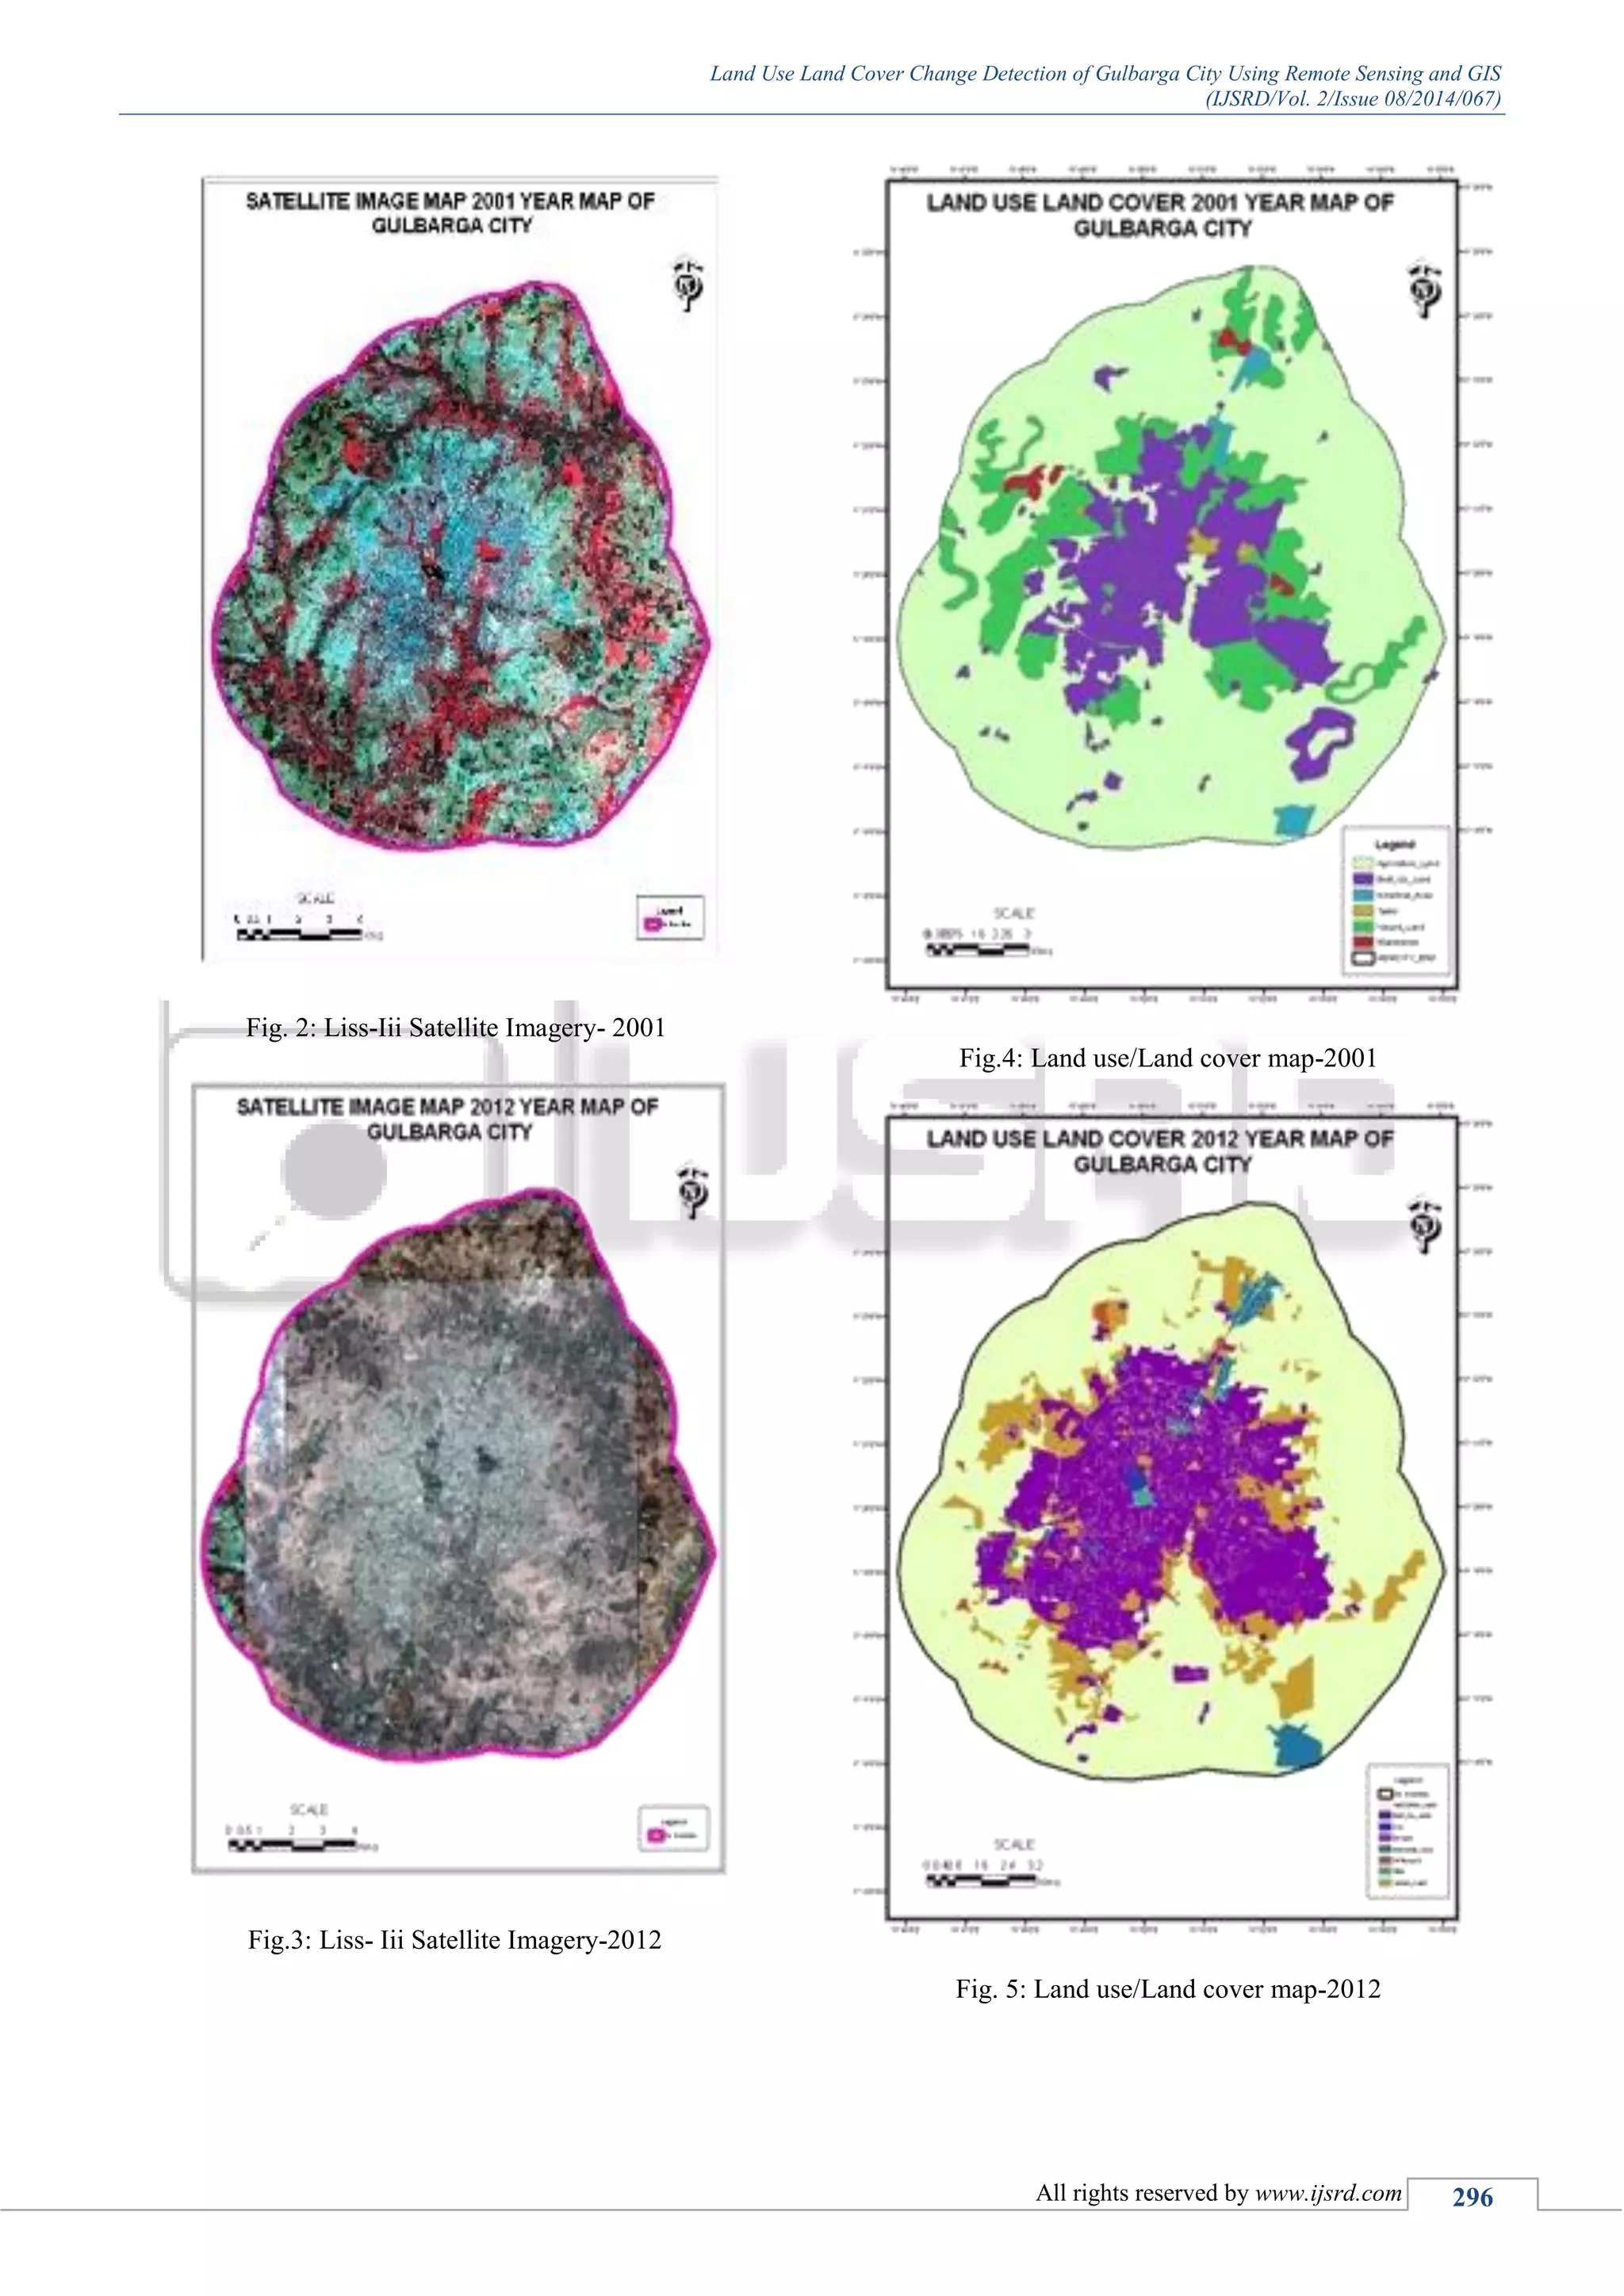
IV. MATERIALS AND METHODOLOGY
The materials utilized for this study will be GIS and RS
related programming models. These delicate products help us
to make maps furthermore help in the administration of
information. By utilizing these product models, altering and
investigation of the information is possible in shorter time of
time.
A. Geographic Information System (GIS):
The Geographic Information System (GIS) is a machine
supported framework for obtaining, stockpiling, investigation
and showcase of geographic information. Geographic
Information System (GIS) is an incorporated situated of
fittings and programming devices utilized for the control and
administration of spatial (geographic) and related credit
information to digitally speak to and examine the geographic
gimmicks exhibit on the world's surface and the occasions
occurring on it.
GIS takes into consideration making, keeping up
and questioning electronic databases of data ordinarily
showed on maps. These databases are spatially turned, the
crucial incorporating component being their position on the
world's surface. This framework comprises of a set of
automated devices and methodology that could be utilized to
adequately encode, store, recover, overlay, relate, control,
dissect, inquiry, and showcase area related data. They
additionally encourage the determination and exchange of
information to application particular scientific models
equipped for evaluating the effect of options on the earth.
The underlying establishment of sound GIS is a successful
advanced guide database, fixing to a precise level control
overview structure.
B. Remote Sensing (RS):
Remote sensing is the investigation of obtaining data about
earth's surface without really being in contact with it. This is
carried out by sensing & recording reflected or emitted
vitality & handling, investigating & applying that data. A
further venture of picture examination and understanding is
needed with a specific end goal to concentrate helpful data
from the picture. The human visual framework is an
illustration of a remote sensing framework in this general
sense. In a more confined sense, remote sensing generally
alludes to the engineering of obtaining data about the world's
surface (area and sea) and environment utilizing sensors
installed airborne(aircraft, inflatables) or space borne
(satellites, space shuttles) stages. In Optical Remote Sensing,
optical sensors distinguish sun based radiation reflected or
scattered from the earth, shaping pictures taking after photos
taken by a cam high up in space. The wavelength district
generally stretches out from the Visible and Near Infrared
(VNIR) to the Short-Wave Infrared (SWIR). Diverse
materials, for example, water, soil, vegetation, structures and
streets reflect unmistakable and infrared light in distinctive
ways. They have distinctive colors and shine when seen
under the sun. The translations of optical pictures require the
learning of the ghastly reflectance marks of the different
materials (regular or man-made) coating the surface of the
earth. There are additionally infrared sensors measuring the
warm infrared radiation emitted from the earth, from which
the area or ocean surface temperature might be inferred. [5]
C. Programming Model Used For The Study
(1) arcgis 10.0
(2) erdas IMAGINE 8.7
Arcgis 10.0 is a product model which incorporates a
gathering of geographic data framework (GIS). This product
model is created by ESRI.
Arcgis 10.0 is constructed around the geodatabase,
which utilizes an item social database approach for putting
away spatial information. A geodatabase is a "holder" for
holding datasets, entwining the spatial peculiarities with
properties. The geodatabase can additionally contain
topology data, and can display conduct of peculiarities, for
example, street crossing points, with guidelines on how
gimmicks identify with each other. At the point when
working with geodatabases, it is vital to see about peculiarity
classes which are a situated of gimmicks, spoke to with
focuses, lines, or polygons. With shape records, each one
record can just handle one kind of gimmick. A geodatabase
can store numerous peculiarity classes or sort of gimmicks
inside one document. Arcgis for Desktop comprises of a few
incorporated applications, including Arc Map, Arc Catalog,
Arc Toolbox, and Arc Globe. Circular segment Catalog is the
information administration application, used to scan datasets
and records on one's machine, database, or different sources.
Notwithstanding indicating what information is accessible,
Arc Catalog likewise permits clients to see the information
on a guide. Circular segment Catalog additionally gives the
capacity to view and oversee metadata for spatial datasets.
Bend Map is the application used to view, alter and inquiry
geospatial information, and make maps. The Arc Map
interface has two fundamental segments, including a list of
chapters on the left and the information frame(s) which show
the guide. Things in the list of chapters compare with layers
on the guide. Circular segment Toolbox contains geo
handling, information transformation, and dissection
instruments, alongside a great part of the usefulness in
Arcinfo. It is likewise conceivable to utilize group preparing
with Arc Toolbox, for regularly rehashed undertakings.
ERDAS IMAGINE 8.7 is basically utilized for
handling of geo-spatial raster information and permitting the
client to show the computerized pictures for mapping in GIS
programming. This product model permits the client to
perform distinctive operations on a picture. ERDAS
IMAGINE Suite which has developed to backing most
optical and radar mapping satellites, airborne mapping cams,
advanced sensors utilized for mapping. It was discharged on
a Sun Workstation utilizing Sunos giving a Graphical User
Interface to support in envisioning symbolism utilized within
mapping, vector GIS information, making map.
D. Generation of Thematic Maps
Survey of India toposheets No.56C/15 on 1:50,000
scale.
Acquisition of the LISS-III & the satellite data of
the year 2001&2012 from
NRSC,Bangalore&toposheet from survey of India
Bangalore.
Geo-referencing of toposheet based on latitude &
longitudinal values.](https://image.slidesharecdn.com/ijsrdv2i8088-150923095131-lva1-app6891/75/Land-Use-Land-Cover-Change-Detection-of-Gulbarga-City-Using-Remote-Sensing-and-GIS-3-2048.jpg)
![Land Use Land Cover Change Detection of Gulbarga City Using Remote Sensing and GIS
(IJSRD/Vol. 2/Issue 08/2014/067)
All rights reserved by www.ijsrd.com 298
normally at the cost of surrounding agriculture & other
lands. the waste generated by these urban areas(solid &
liquid) pose threat to quality of life..the industrial effluents
pollutes the surface water & ground water. Plumes from
industry causes air pollution.The Growth of city at a rate of
agricultural, forest & other land also results in the
environmental imbalance. Remote sensing data, satellite&
aerial accompanied by ground investigations are found
useful in mapping the urban land use/land cover etc..suitable
sites for 1.disposal of solid waste& 2.sewage treatment
plants can also be identified using remote sensing data.
LULC play a very important role in the climate change @
different scales such as regional, local&global.At global
scale LULC change is responsible for releasing greenhouse
gases to the atmosphere which results in the global warming
.LULC change is capable to increase the carbon dioxide
balance to the atmosphere by disturbance of terrestrial soils
and vegetation. most important is LULC change plays very
important role in emission of green house gases. Hence the
government should think seriously & take the necessary
steps to protect agricultural land which is a major parameter
& deforestation should be avoided for widening of roads .As
good as best land use planning is needed or else we
definitely loose our natural resourcesi.e water bodies,
agricultural soil. Hence finally it is concluded that satellite
imagery can be very effective and fast in change detection
of landuse and landcover changes.
REFERENCES
[1] INNOCENT EZEOMEDO and JOELIGBOKWE.
“Mapping and analysis of land use and land cover for
a sustainable development using high resolution
satellite images and gis, Nigeria” (2013).
[2] HUSSAIN ALI OUMER. Land use and land cover
change, drivers and its impact: a “comparative study
from kuhar michael and lenche dima of blue nile and
awash basins of the Ethiopia (2009)”.
[3] PRAKASAM.C. “Land use and land cover change
detection through remote sensing approach A case
study of Kodaikanal taluk, Tamilnadu,Department of
Geography, The University of Burdwan
[4] http:// www.wikimapia.org/wiki/gulbarga_dist.
[5] http://www.crisp.nus.edu.sg/~research/tutorial/intro.h
tml](https://image.slidesharecdn.com/ijsrdv2i8088-150923095131-lva1-app6891/75/Land-Use-Land-Cover-Change-Detection-of-Gulbarga-City-Using-Remote-Sensing-and-GIS-7-2048.jpg)

This document summarizes a study that analyzed land use and land cover change in Gulbarga City, India between 2001 and 2012 using remote sensing and GIS techniques. Satellite images from 2001 and 2012 were classified to identify changes in land cover categories such as vegetation, soil, water, and forest area. The study found expansion of urban areas led to losses of agricultural land, vegetation land, and water bodies. This urban sprawl also created environmental issues like decreased air quality and increased temperatures. The goal of the study was to understand land use and land cover change in Gulbarga City and quantify changes that occurred between 2001 and 2012 by comparing satellite image data from the two time periods.